The same plot in 14 other libraries — JavaScript: D3.js, Apache ECharts, Highcharts, MUI X Charts; Python: Altair, Bokeh, lets-plot, Matplotlib, Plotly, plotnine, Pygal, Seaborn; R: ggplot2; Julia: Makie.jl. Compare all 15 side by side: Basic Sudoku Grid in Python, R, Julia and JavaScript.
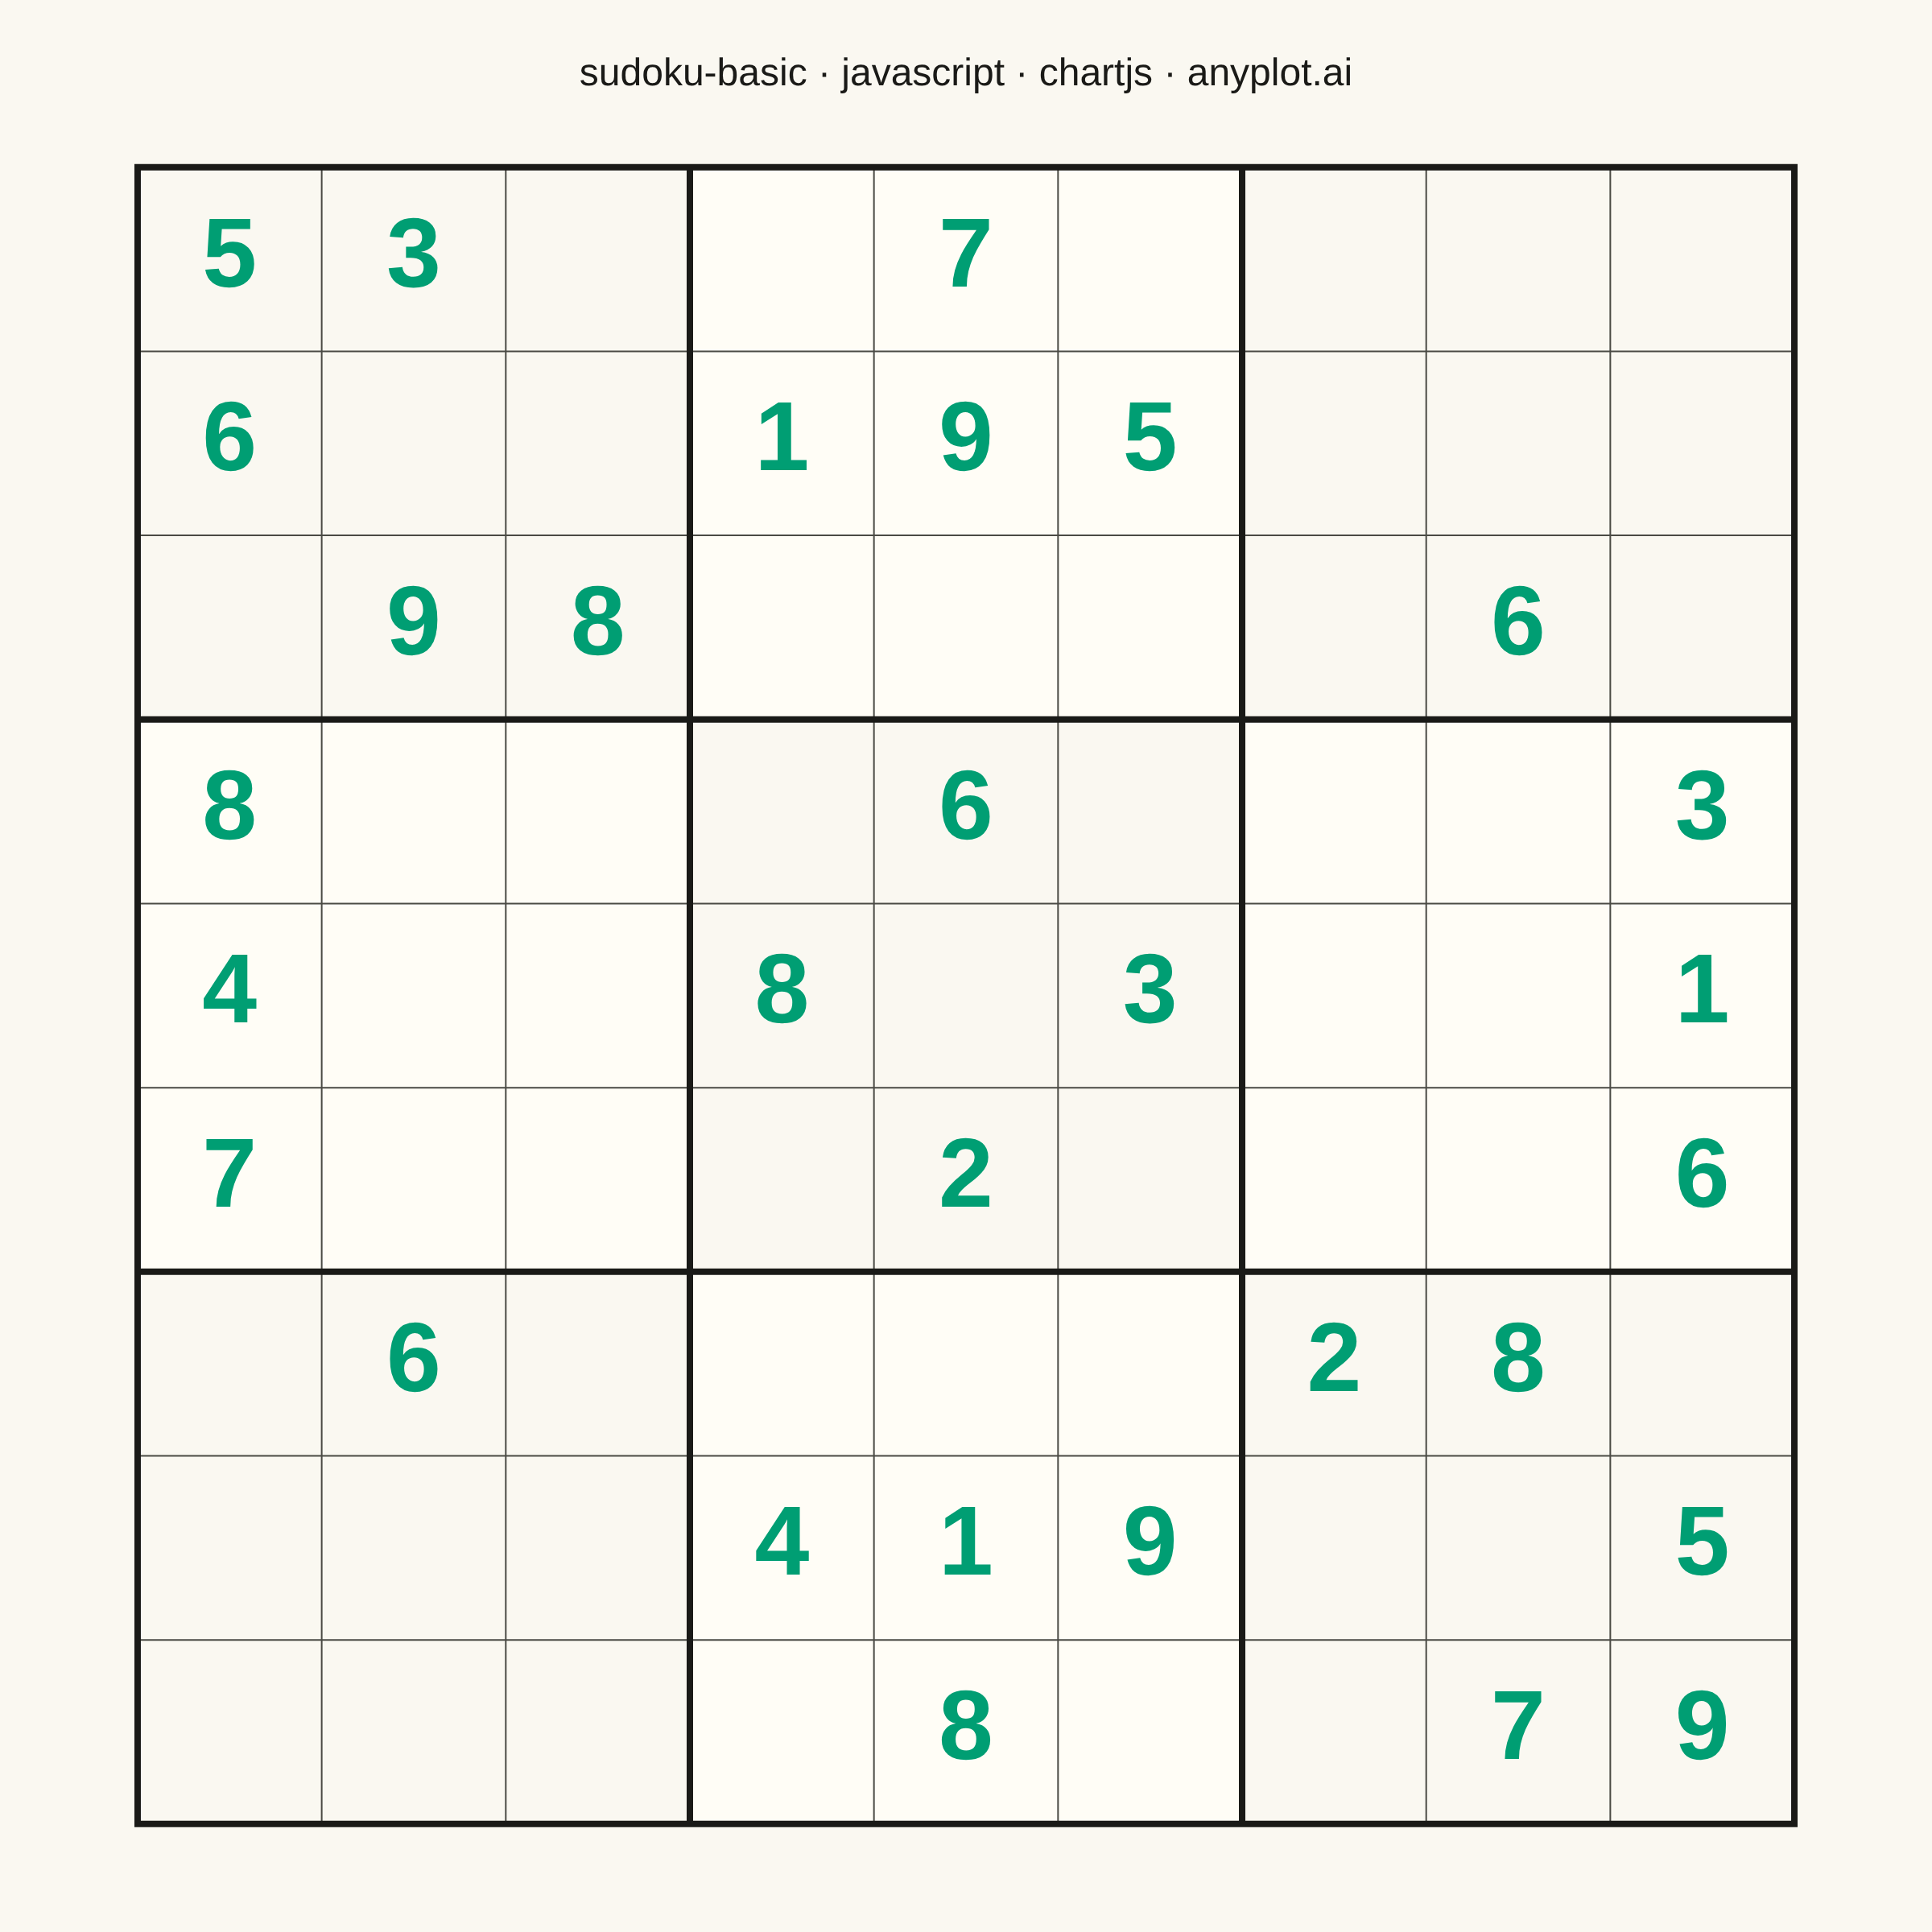
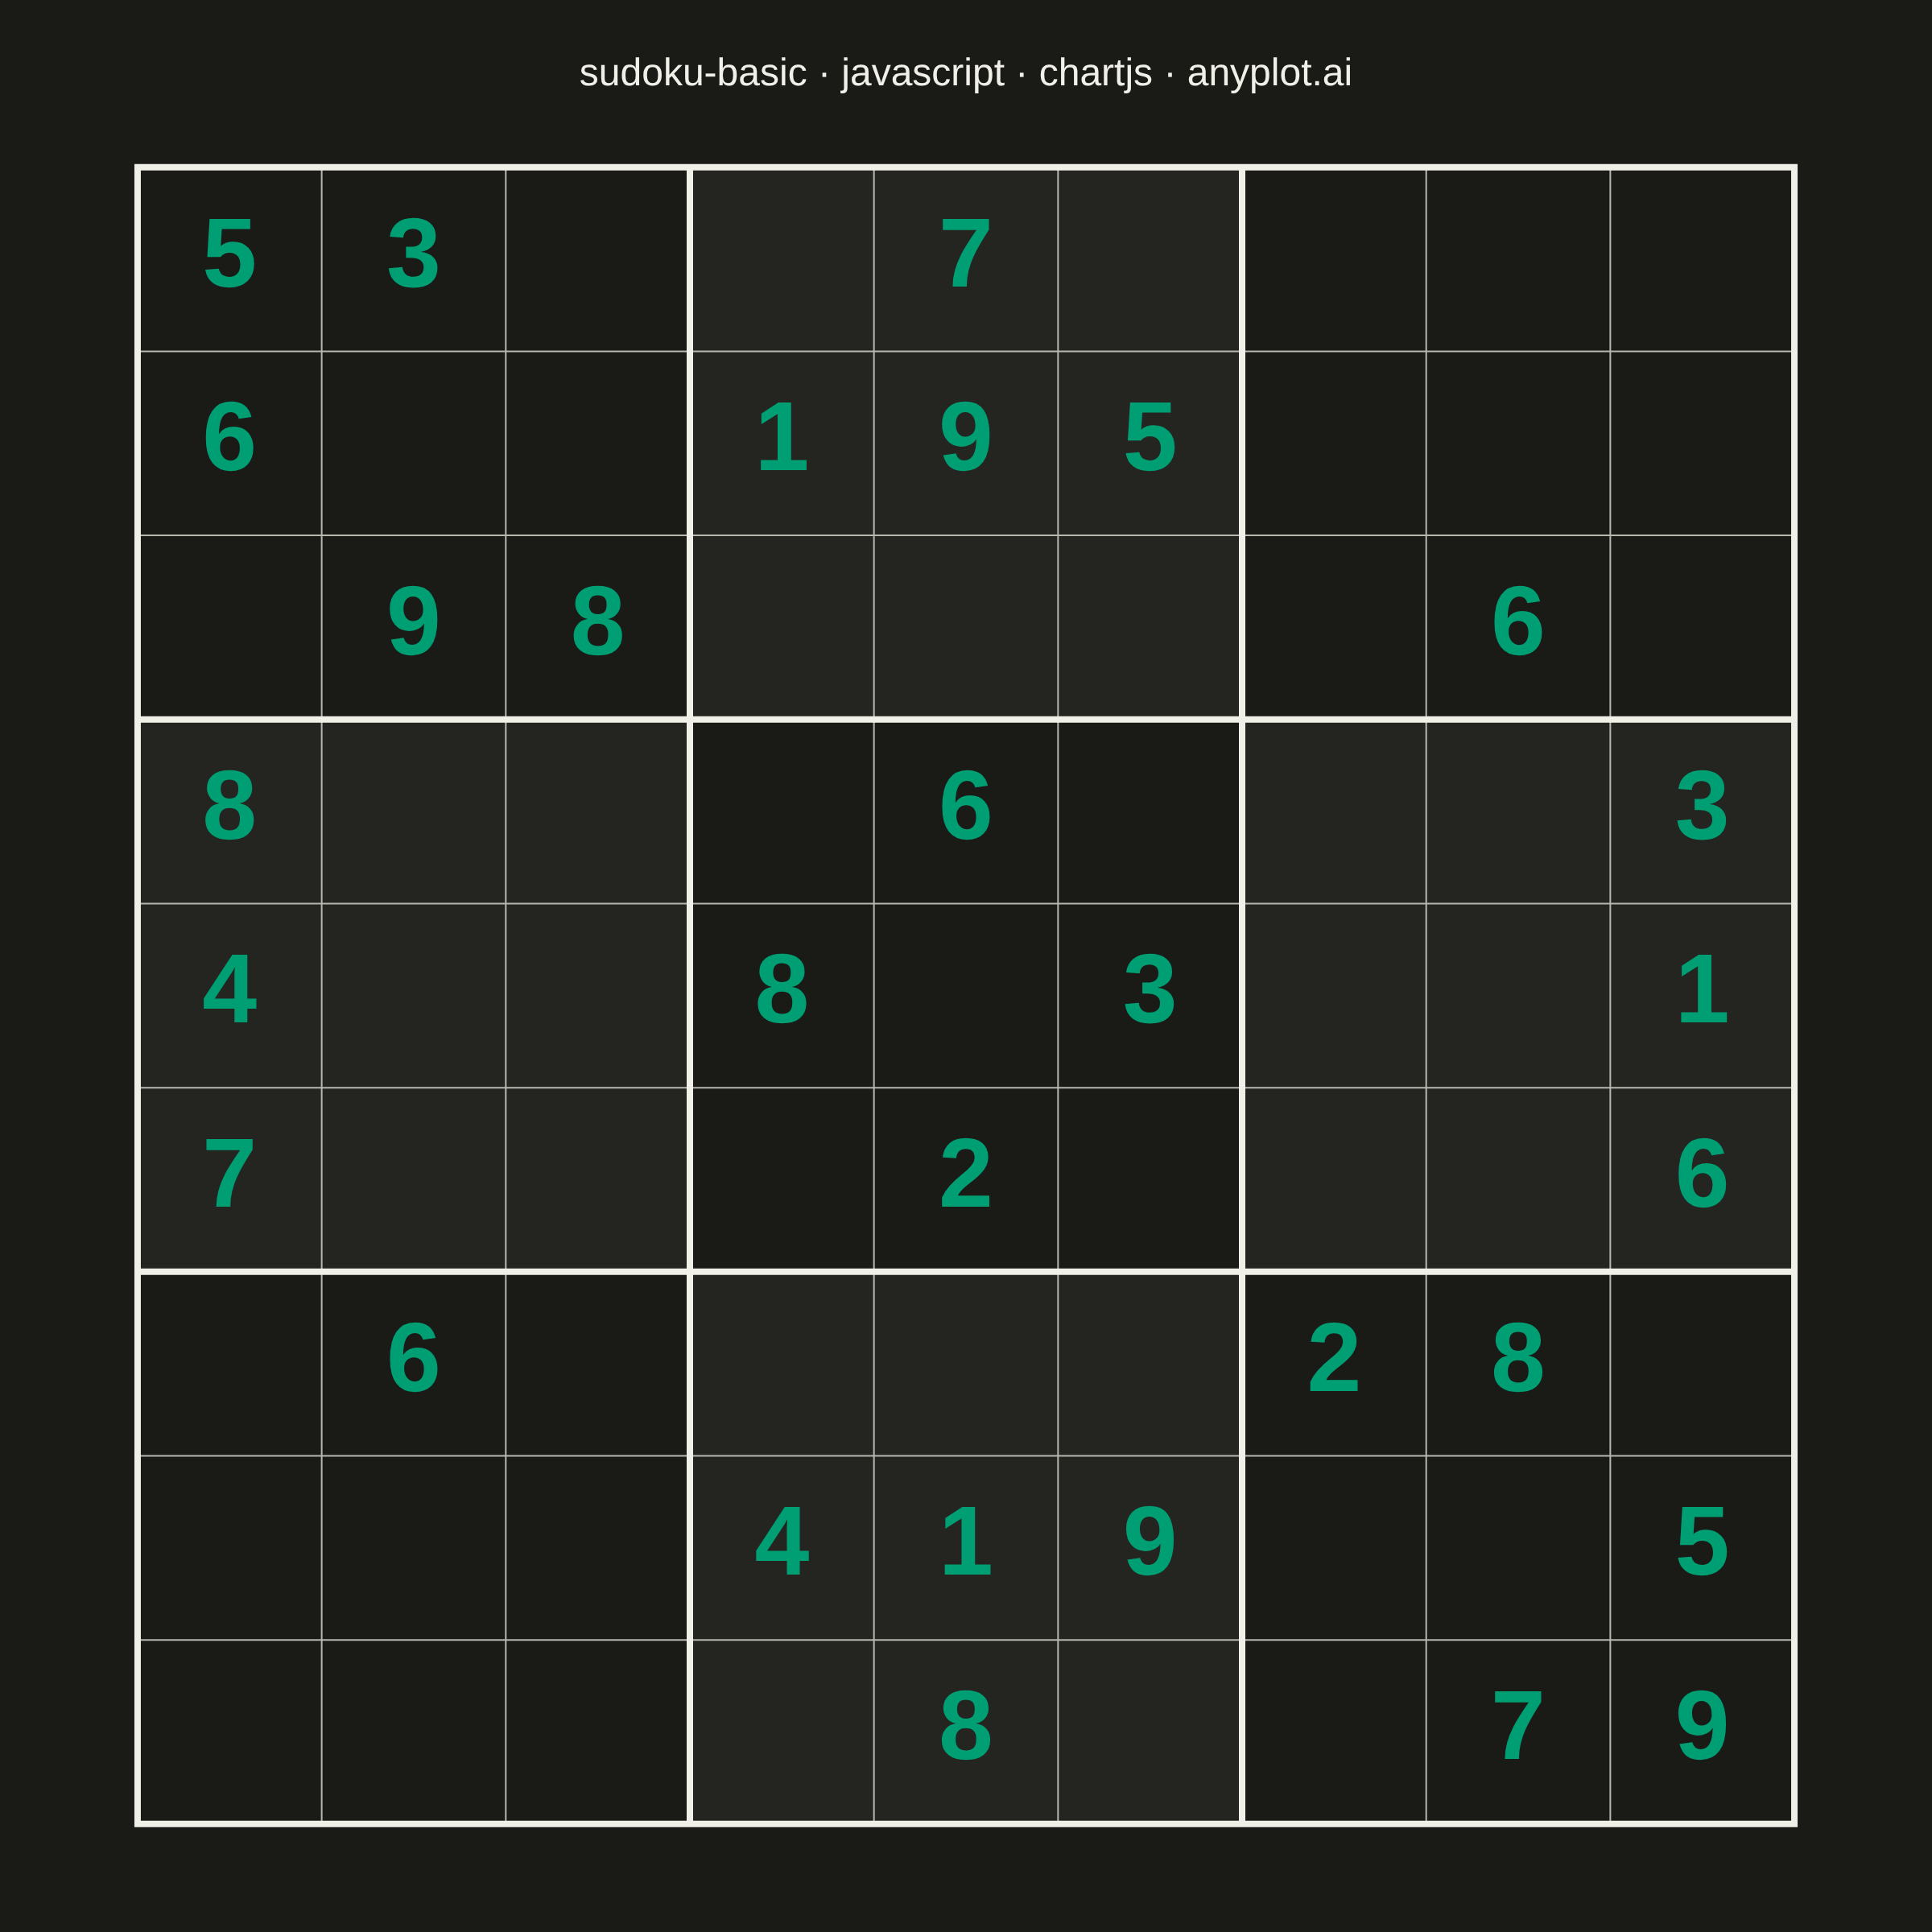
A standard 9×9 Sudoku grid with proper visual hierarchy showing 3×3 box regions. Thick lines separate the nine boxes while thin lines divide individual cells. The clean black-and-white design is optimized for printing and solving puzzles.
// anyplot.ai
// sudoku-basic: Basic Sudoku Grid
// Library: chartjs 4.4.7 | JavaScript 22.22.3
// Quality: 89/100 | Created: 2026-06-25
//# anyplot-orientation: square

const t = window.ANYPLOT_TOKENS;

// Classic Sudoku puzzle (0 = empty cell, from Wikipedia's Sudoku article)
const grid = [
  [5, 3, 0, 0, 7, 0, 0, 0, 0],
  [6, 0, 0, 1, 9, 5, 0, 0, 0],
  [0, 9, 8, 0, 0, 0, 0, 6, 0],
  [8, 0, 0, 0, 6, 0, 0, 0, 3],
  [4, 0, 0, 8, 0, 3, 0, 0, 1],
  [7, 0, 0, 0, 2, 0, 0, 0, 6],
  [0, 6, 0, 0, 0, 0, 2, 8, 0],
  [0, 0, 0, 4, 1, 9, 0, 0, 5],
  [0, 0, 0, 0, 8, 0, 0, 7, 9],
];

// Mount
const canvas = document.createElement("canvas");
document.getElementById("container").appendChild(canvas);

// Inline plugin — draws the 9×9 grid with thick box borders and thin cell borders
const sudokuPlugin = {
  id: "sudokuGrid",
  beforeDraw(chart) {
    const ctx = chart.ctx;
    ctx.save();
    ctx.fillStyle = t.pageBg;
    ctx.fillRect(0, 0, chart.width, chart.height);
    ctx.restore();
  },
  afterDraw(chart) {
    const ctx = chart.ctx;
    const { left, top, right, bottom } = chart.chartArea;
    const w = right - left;
    const h = bottom - top;

    // Centered square grid within the chart area
    const gridSz = Math.min(w, h) * 0.95;
    const startX = left + (w - gridSz) / 2;
    const startY = top + (h - gridSz) / 2;
    const cell = gridSz / 9;

    ctx.save();

    const boxSz = cell * 3;

    // Grid background — full grid in pageBg
    ctx.fillStyle = t.pageBg;
    ctx.fillRect(startX, startY, gridSz, gridSz);

    // Alternating 3×3 box region tints for visual depth
    for (let br = 0; br < 3; br++) {
      for (let bc = 0; bc < 3; bc++) {
        ctx.fillStyle = (br + bc) % 2 === 1 ? t.elevatedBg : t.pageBg;
        ctx.fillRect(startX + bc * boxSz, startY + br * boxSz, boxSz, boxSz);
      }
    }

    // Thin cell lines — skip every 3rd (those are box boundaries)
    ctx.strokeStyle = t.inkSoft;
    ctx.lineWidth = 1;
    ctx.lineCap = "butt";
    ctx.beginPath();
    for (let i = 1; i < 9; i++) {
      if (i % 3 === 0) continue;
      ctx.moveTo(startX + i * cell, startY);
      ctx.lineTo(startX + i * cell, startY + gridSz);
      ctx.moveTo(startX, startY + i * cell);
      ctx.lineTo(startX + gridSz, startY + i * cell);
    }
    ctx.stroke();

    // Thick box boundary lines at 0, 3, 6, 9 — square caps fill corners cleanly
    ctx.strokeStyle = t.ink;
    ctx.lineWidth = 4;
    ctx.lineCap = "square";
    ctx.beginPath();
    for (let i = 0; i <= 3; i++) {
      const d = i * 3 * cell;
      ctx.moveTo(startX + d, startY);
      ctx.lineTo(startX + d, startY + gridSz);
      ctx.moveTo(startX, startY + d);
      ctx.lineTo(startX + gridSz, startY + d);
    }
    ctx.stroke();

    // Given numbers centered in each cell — Imprint palette[0] distinguishes clues
    const fontSize = Math.floor(cell * 0.54);
    ctx.font = `bold ${fontSize}px Arial, sans-serif`;
    ctx.fillStyle = t.palette[0];
    ctx.textAlign = "center";
    ctx.textBaseline = "middle";
    for (let r = 0; r < 9; r++) {
      for (let c = 0; c < 9; c++) {
        if (grid[r][c] !== 0) {
          ctx.fillText(
            String(grid[r][c]),
            startX + c * cell + cell / 2,
            startY + r * cell + cell / 2
          );
        }
      }
    }

    ctx.restore();
  },
};

// Chart — scatter with hidden axes; the custom plugin draws everything
new Chart(canvas, {
  type: "scatter",
  data: { datasets: [] },
  plugins: [sudokuPlugin],
  options: {
    responsive: true,
    maintainAspectRatio: false,
    animation: false,
    layout: {
      padding: { top: 20, right: 40, bottom: 40, left: 40 },
    },
    plugins: {
      title: {
        display: true,
        text: "sudoku-basic · javascript · chartjs · anyplot.ai",
        color: t.ink,
        font: { size: 24, weight: "normal" },
        padding: { top: 12, bottom: 16 },
      },
      legend: { display: false },
    },
    scales: {
      x: { display: false },
      y: { display: false },
    },
  },
});
Runnable source as JSON, for any HTTP client: https://api.anyplot.ai/specs/sudoku-basic/chartjs/code. Any spec id and library id listed in llms-full.txt fit the same URL shape; every URL below is complete and callable.
{
  "spec_id": "sudoku-basic",
  "language": "javascript",
  "library": "chartjs",
  "page": "https://anyplot.ai/sudoku-basic/javascript/chartjs",
  "hub": "https://anyplot.ai/sudoku-basic",
  "code_json": "https://api.anyplot.ai/specs/sudoku-basic/chartjs/code",
  "spec_json": "https://api.anyplot.ai/specs/sudoku-basic",
  "render_light_png": "https://storage.googleapis.com/anyplot-images/plots/sudoku-basic/javascript/chartjs/plot-light.png",
  "render_dark_png": "https://storage.googleapis.com/anyplot-images/plots/sudoku-basic/javascript/chartjs/plot-dark.png",
  "interactive_light_html": "https://storage.googleapis.com/anyplot-images/plots/sudoku-basic/javascript/chartjs/plot-light.html",
  "interactive_dark_html": "https://storage.googleapis.com/anyplot-images/plots/sudoku-basic/javascript/chartjs/plot-dark.html",
  "quality_score": 89.0,
  "license": "MIT",
  "guide": "https://anyplot.ai/llms.txt"
}
Part of Basic Sudoku Grid on anyplot.ai.