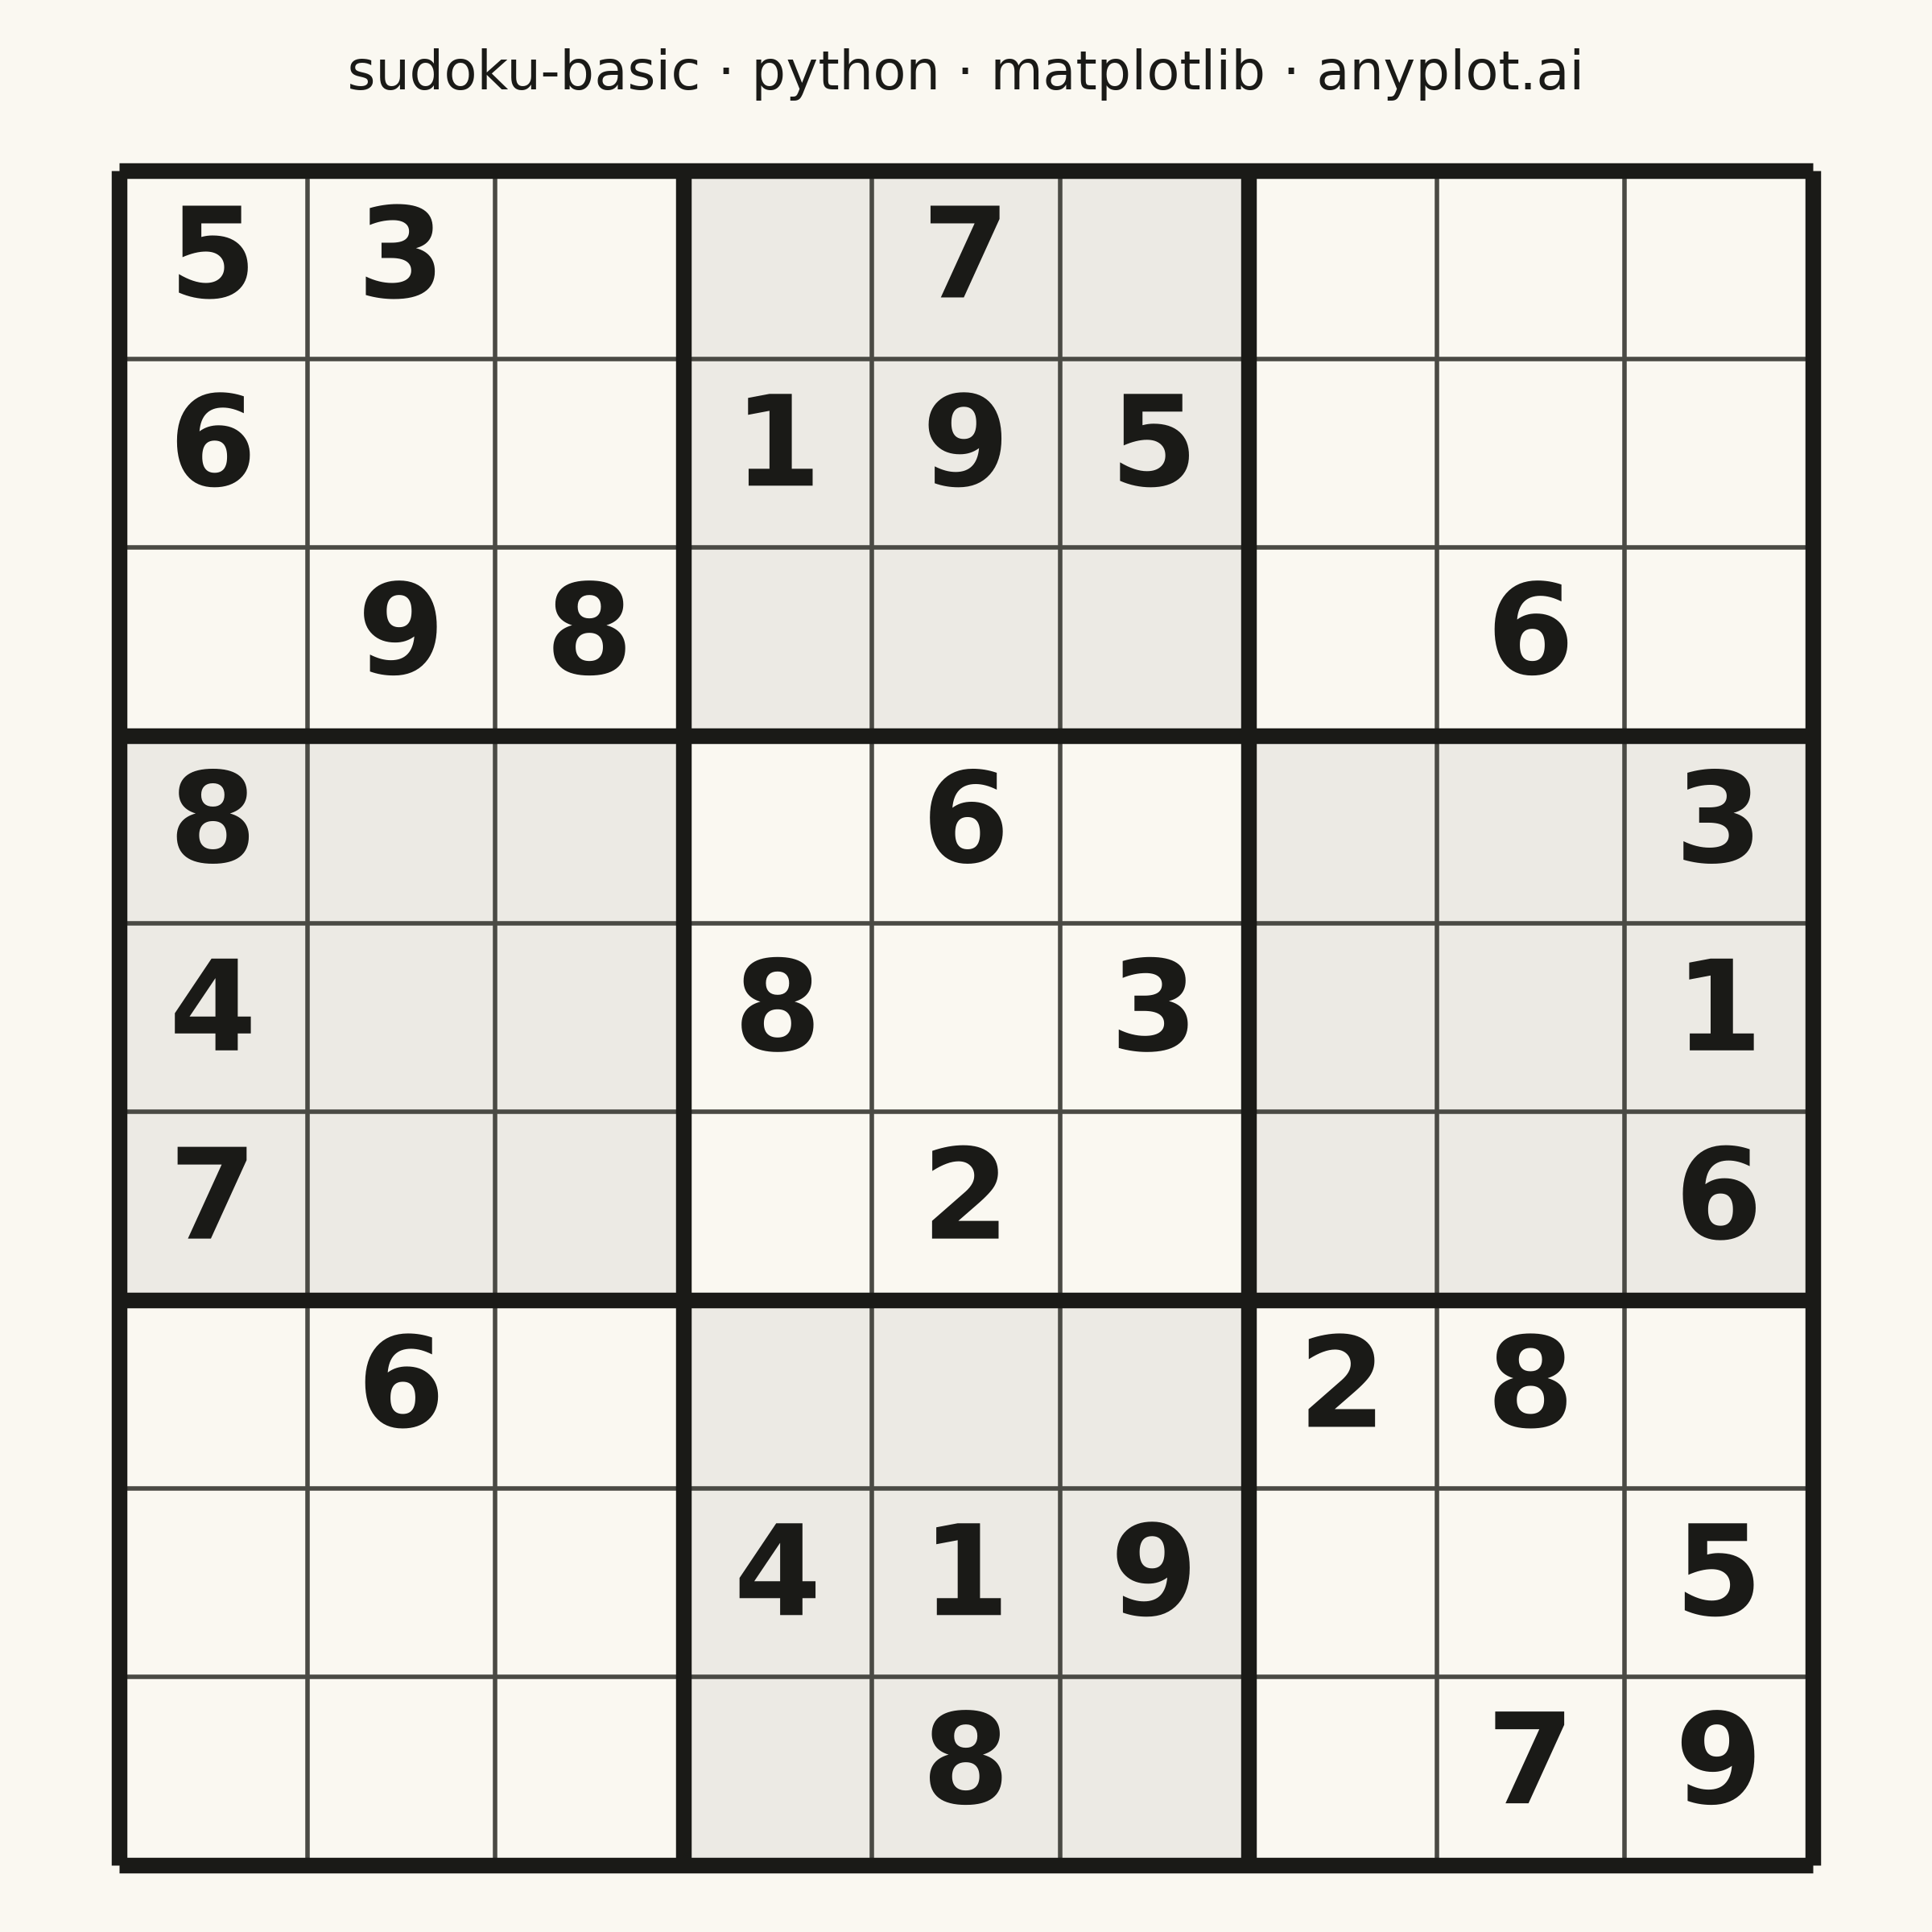
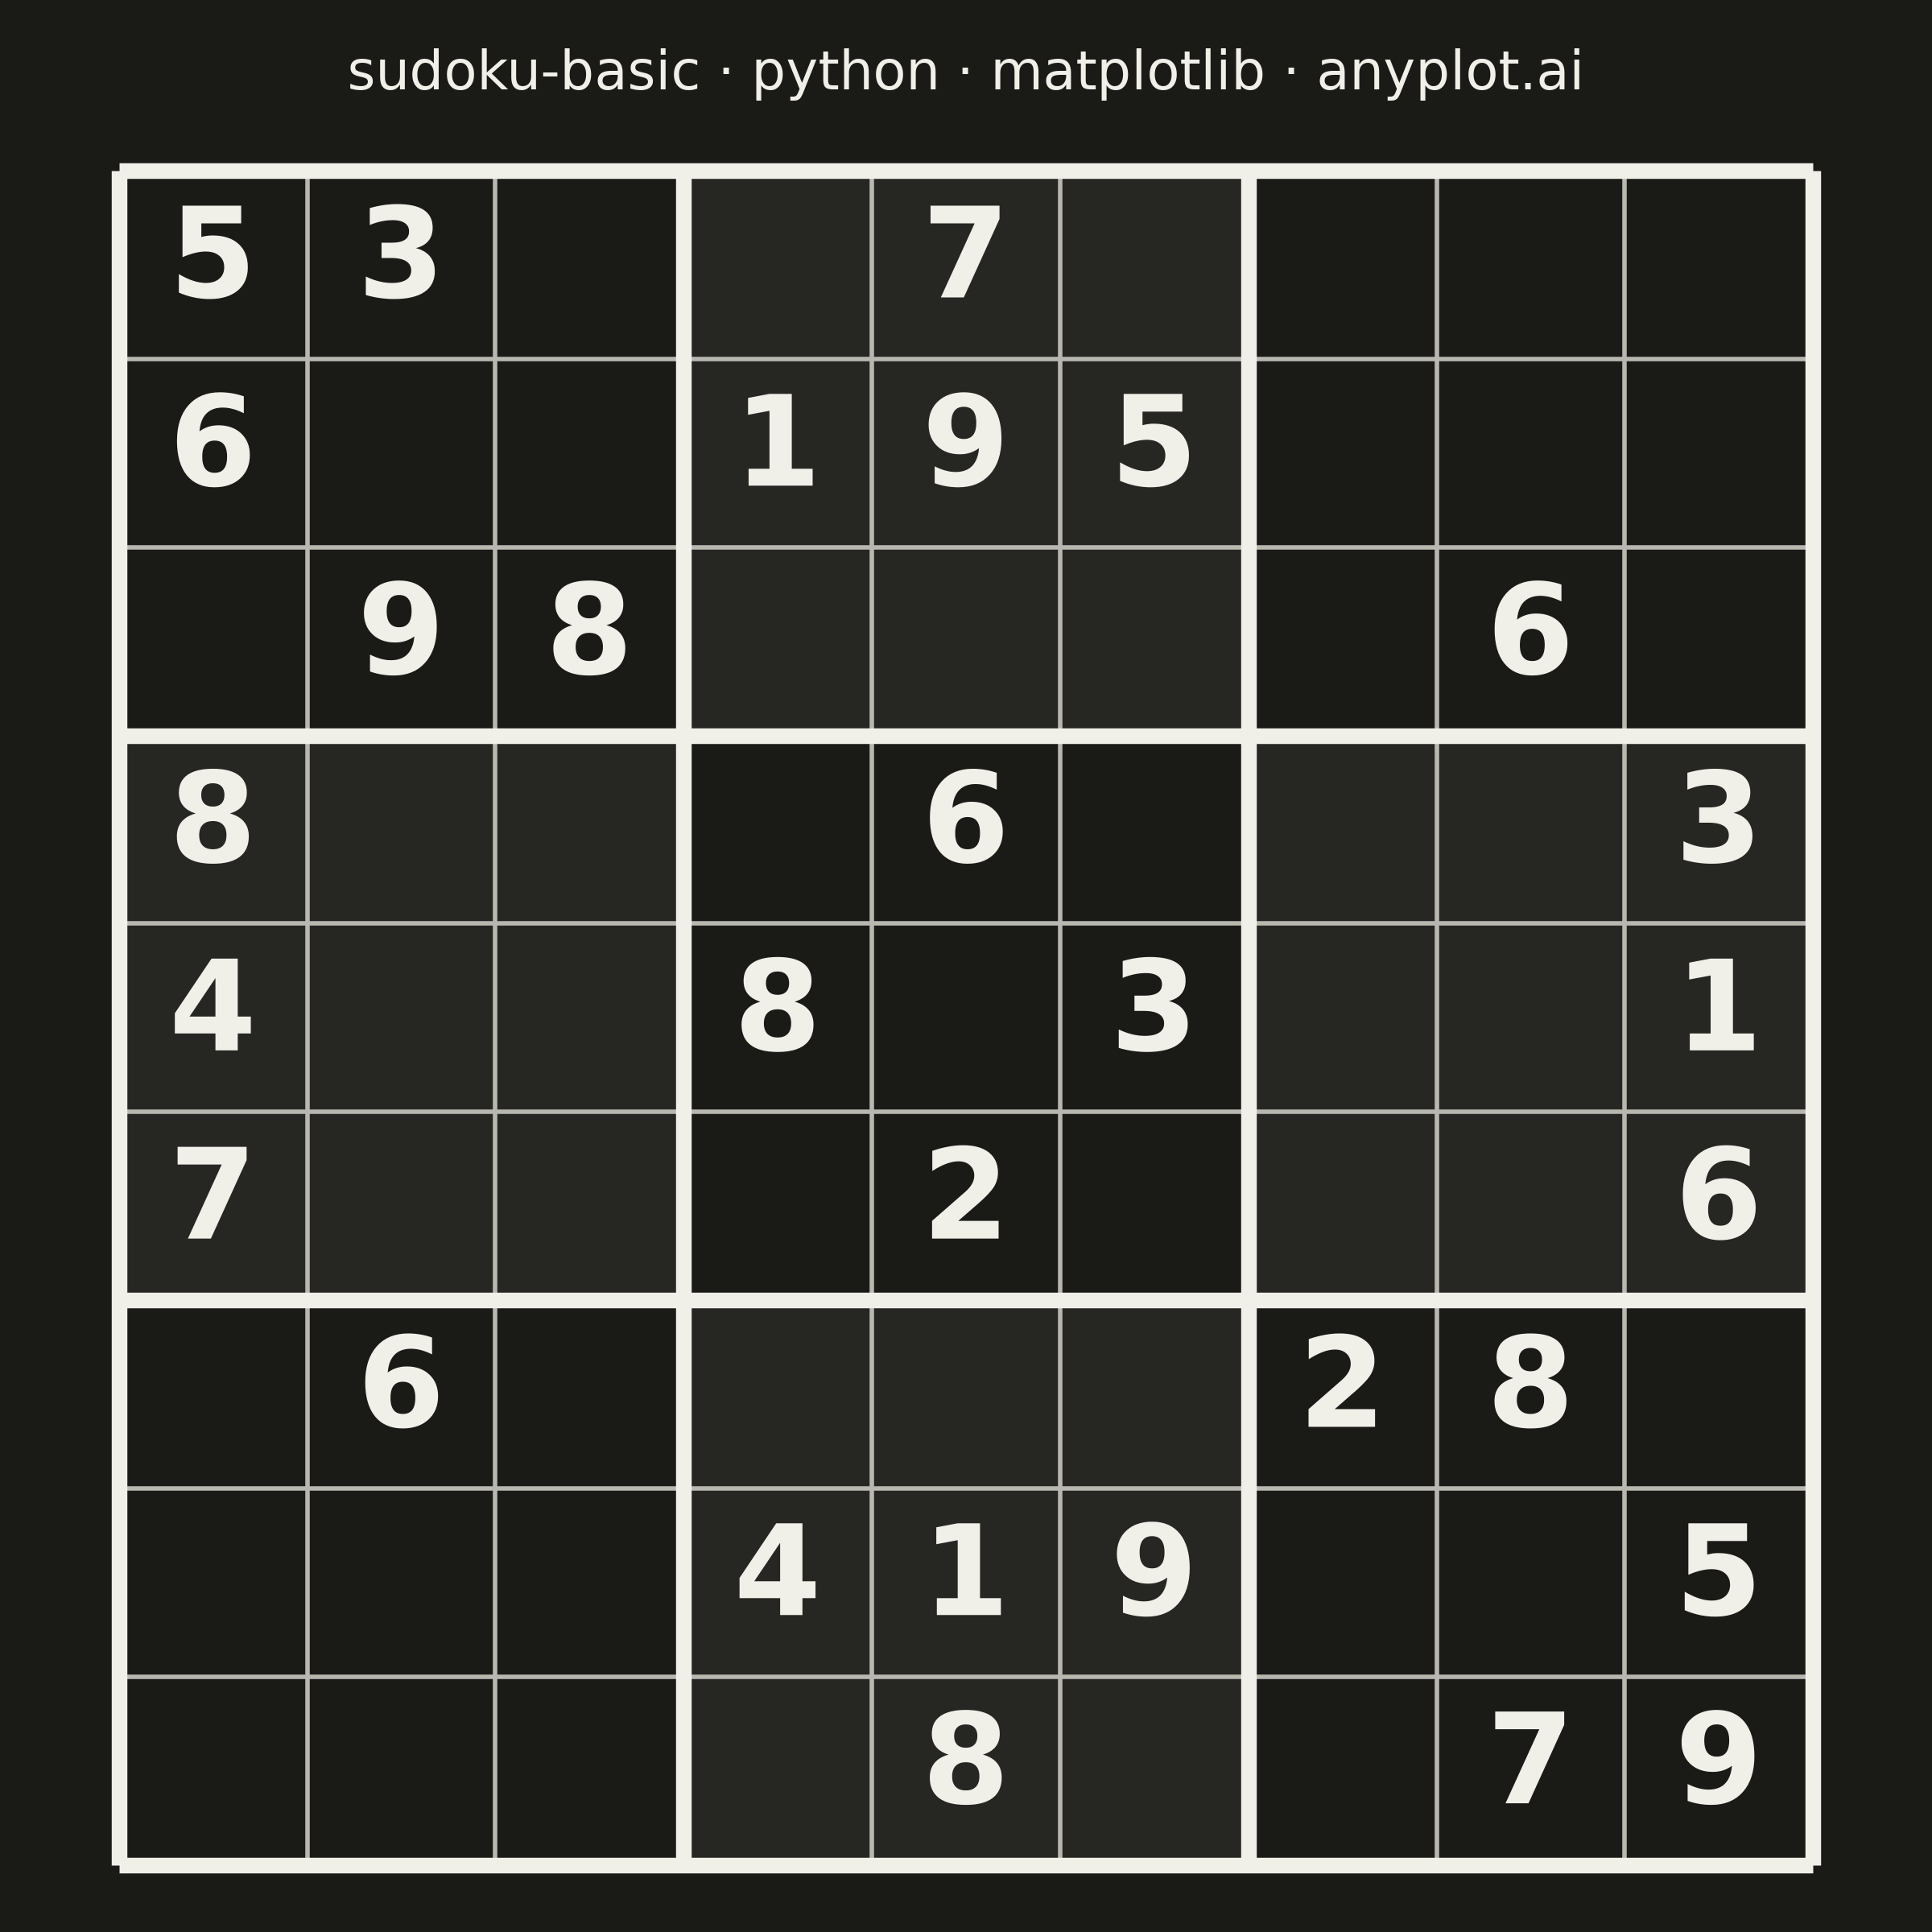
A standard 9×9 Sudoku grid with proper visual hierarchy showing 3×3 box regions. Thick lines separate the nine boxes while thin lines divide individual cells. The clean black-and-white design is optimized for printing and solving puzzles.
""" anyplot.ai
sudoku-basic: Basic Sudoku Grid
Library: matplotlib 3.11.0 | Python 3.13.14
Quality: 90/100 | Updated: 2026-06-25
"""

import os

import matplotlib.pyplot as plt
import numpy as np


# Theme tokens
THEME = os.getenv("ANYPLOT_THEME", "light")
PAGE_BG = "#FAF8F1" if THEME == "light" else "#1A1A17"
INK = "#1A1A17" if THEME == "light" else "#F0EFE8"
INK_SOFT = "#4A4A44" if THEME == "light" else "#B8B7B0"

# Data - A partially filled Sudoku puzzle (0 = empty cell)
grid = np.array(
    [
        [5, 3, 0, 0, 7, 0, 0, 0, 0],
        [6, 0, 0, 1, 9, 5, 0, 0, 0],
        [0, 9, 8, 0, 0, 0, 0, 6, 0],
        [8, 0, 0, 0, 6, 0, 0, 0, 3],
        [4, 0, 0, 8, 0, 3, 0, 0, 1],
        [7, 0, 0, 0, 2, 0, 0, 0, 6],
        [0, 6, 0, 0, 0, 0, 2, 8, 0],
        [0, 0, 0, 4, 1, 9, 0, 0, 5],
        [0, 0, 0, 0, 8, 0, 0, 7, 9],
    ]
)

# Plot (square canvas: 2400×2400 px at dpi=400)
fig, ax = plt.subplots(figsize=(6, 6), dpi=400, facecolor=PAGE_BG)
ax.set_facecolor(PAGE_BG)
ax.set_aspect("equal")
ax.set_xlim(-0.1, 9.1)
ax.set_ylim(-0.1, 9.1)

# Alternating 3×3 box shading (chess-board pattern) for visual navigation
for box_row in range(3):
    for box_col in range(3):
        if (box_row + box_col) % 2 == 1:
            x0, x1 = box_col * 3, (box_col + 1) * 3
            y0, y1 = box_row * 3, (box_row + 1) * 3
            ax.fill([x0, x1, x1, x0], [y0, y0, y1, y1], color=INK, alpha=0.06, linewidth=0, zorder=0)

# Inner thin lines for individual cell boundaries (skip box boundaries at 0,3,6,9)
for i in range(1, 9):
    if i % 3 != 0:
        ax.plot([0, 9], [i, i], color=INK_SOFT, linewidth=1.0, zorder=1, solid_capstyle="butt")
        ax.plot([i, i], [0, 9], color=INK_SOFT, linewidth=1.0, zorder=1, solid_capstyle="butt")

# Thick lines for 3×3 box boundaries with butt caps for crisp corners
for i in range(0, 10, 3):
    ax.plot([0, 9], [i, i], color=INK, linewidth=3.5, zorder=2, solid_capstyle="butt")
    ax.plot([i, i], [0, 9], color=INK, linewidth=3.5, zorder=2, solid_capstyle="butt")

# Numbers centered in cells
for i in range(9):
    for j in range(9):
        value = grid[i, j]
        if value != 0:
            ax.text(
                j + 0.5,
                8 - i + 0.5,
                str(value),
                fontsize=28,
                fontweight="bold",
                color=INK,
                ha="center",
                va="center",
                zorder=3,
            )

# Hide axes, ticks, and spines (grid itself is the visual frame)
ax.set_xticks([])
ax.set_yticks([])
for spine in ax.spines.values():
    spine.set_visible(False)

title = "sudoku-basic · python · matplotlib · anyplot.ai"
title_n = len(title)
title_fontsize = max(8, round(12 * 67 / title_n)) if title_n > 67 else 12
ax.set_title(title, fontsize=title_fontsize, fontweight="medium", color=INK, pad=14)

plt.tight_layout()
plt.savefig(f"plot-{THEME}.png", dpi=400, facecolor=PAGE_BG)
Runnable source as JSON, for any HTTP client: https://api.anyplot.ai/specs/sudoku-basic/matplotlib/code. Any spec id and library id listed in llms-full.txt fit the same URL shape; every URL below is complete and callable.
{
  "spec_id": "sudoku-basic",
  "language": "python",
  "library": "matplotlib",
  "page": "https://anyplot.ai/sudoku-basic/python/matplotlib",
  "hub": "https://anyplot.ai/sudoku-basic",
  "code_json": "https://api.anyplot.ai/specs/sudoku-basic/matplotlib/code",
  "spec_json": "https://api.anyplot.ai/specs/sudoku-basic",
  "render_light_png": "https://storage.googleapis.com/anyplot-images/plots/sudoku-basic/python/matplotlib/plot-light.png",
  "render_dark_png": "https://storage.googleapis.com/anyplot-images/plots/sudoku-basic/python/matplotlib/plot-dark.png",
  "quality_score": 90.0,
  "license": "MIT",
  "guide": "https://anyplot.ai/llms.txt"
}
Part of Basic Sudoku Grid on anyplot.ai.