The same plot in 14 other libraries — JavaScript: Chart.js, D3.js, Highcharts, MUI X Charts; Python: Altair, Bokeh, lets-plot, Matplotlib, Plotly, plotnine, Pygal, Seaborn; R: ggplot2; Julia: Makie.jl. Compare all 15 side by side: Basic Sudoku Grid in Python, R, Julia and JavaScript.
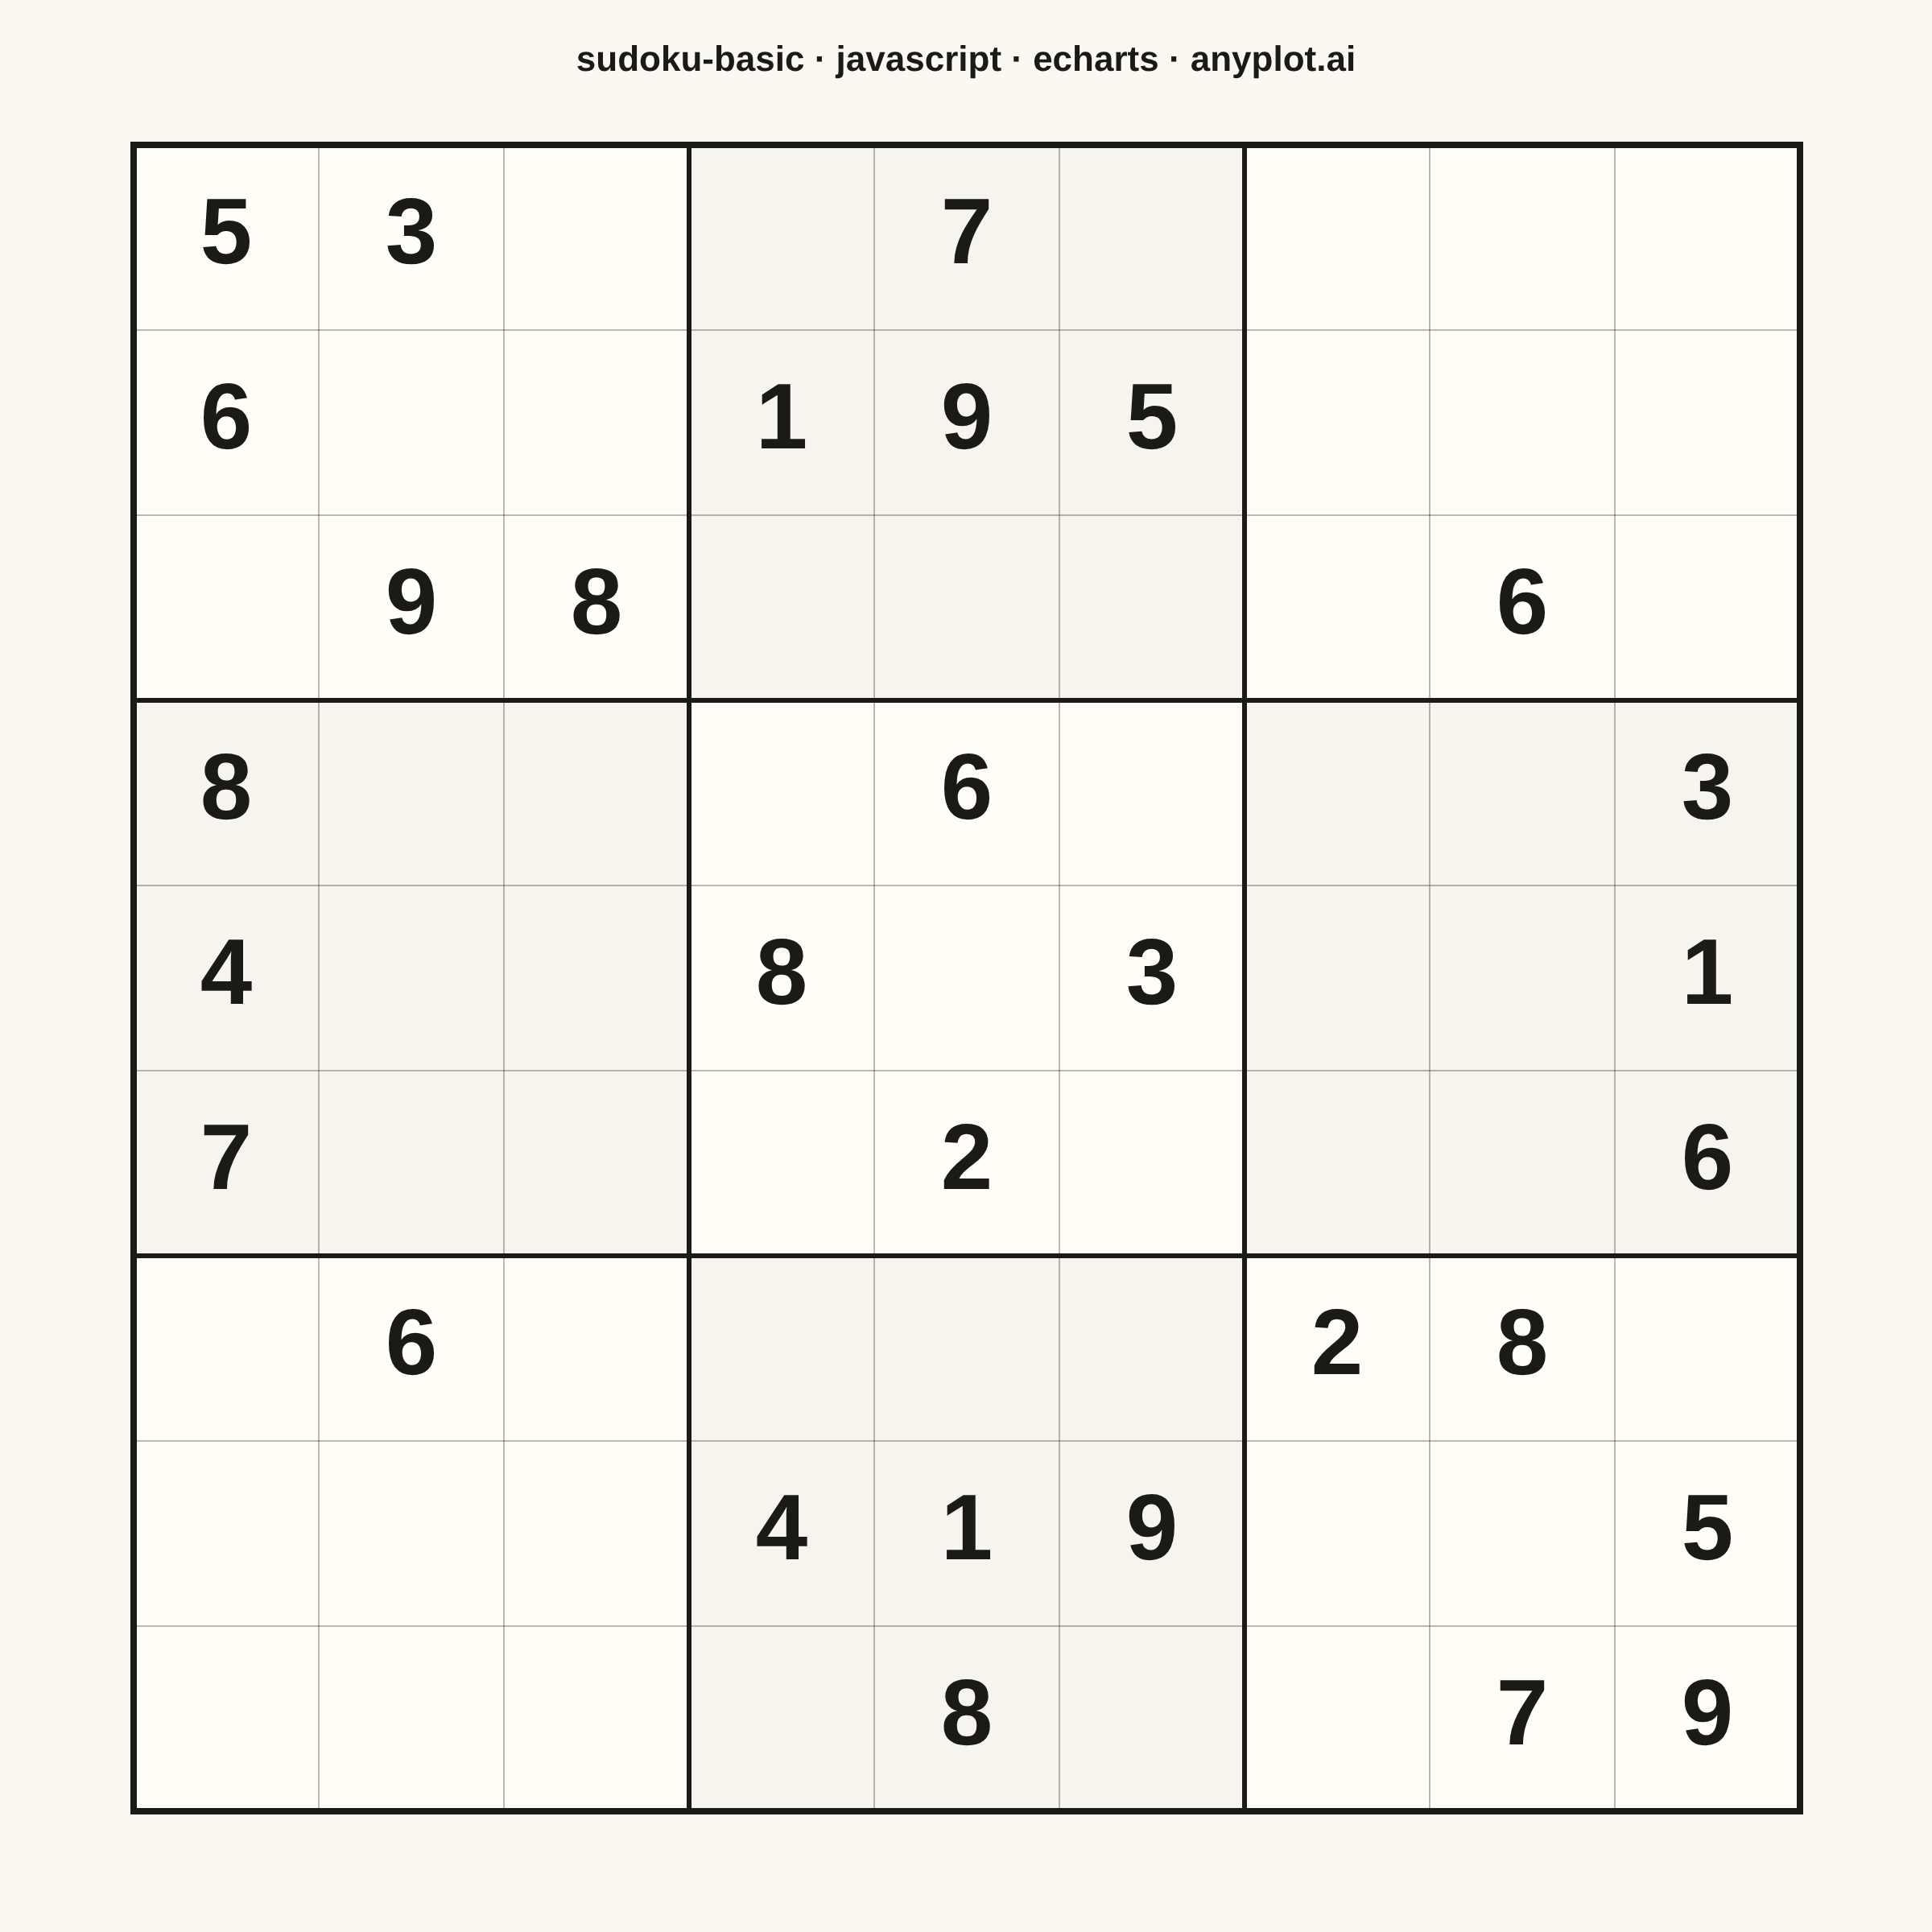
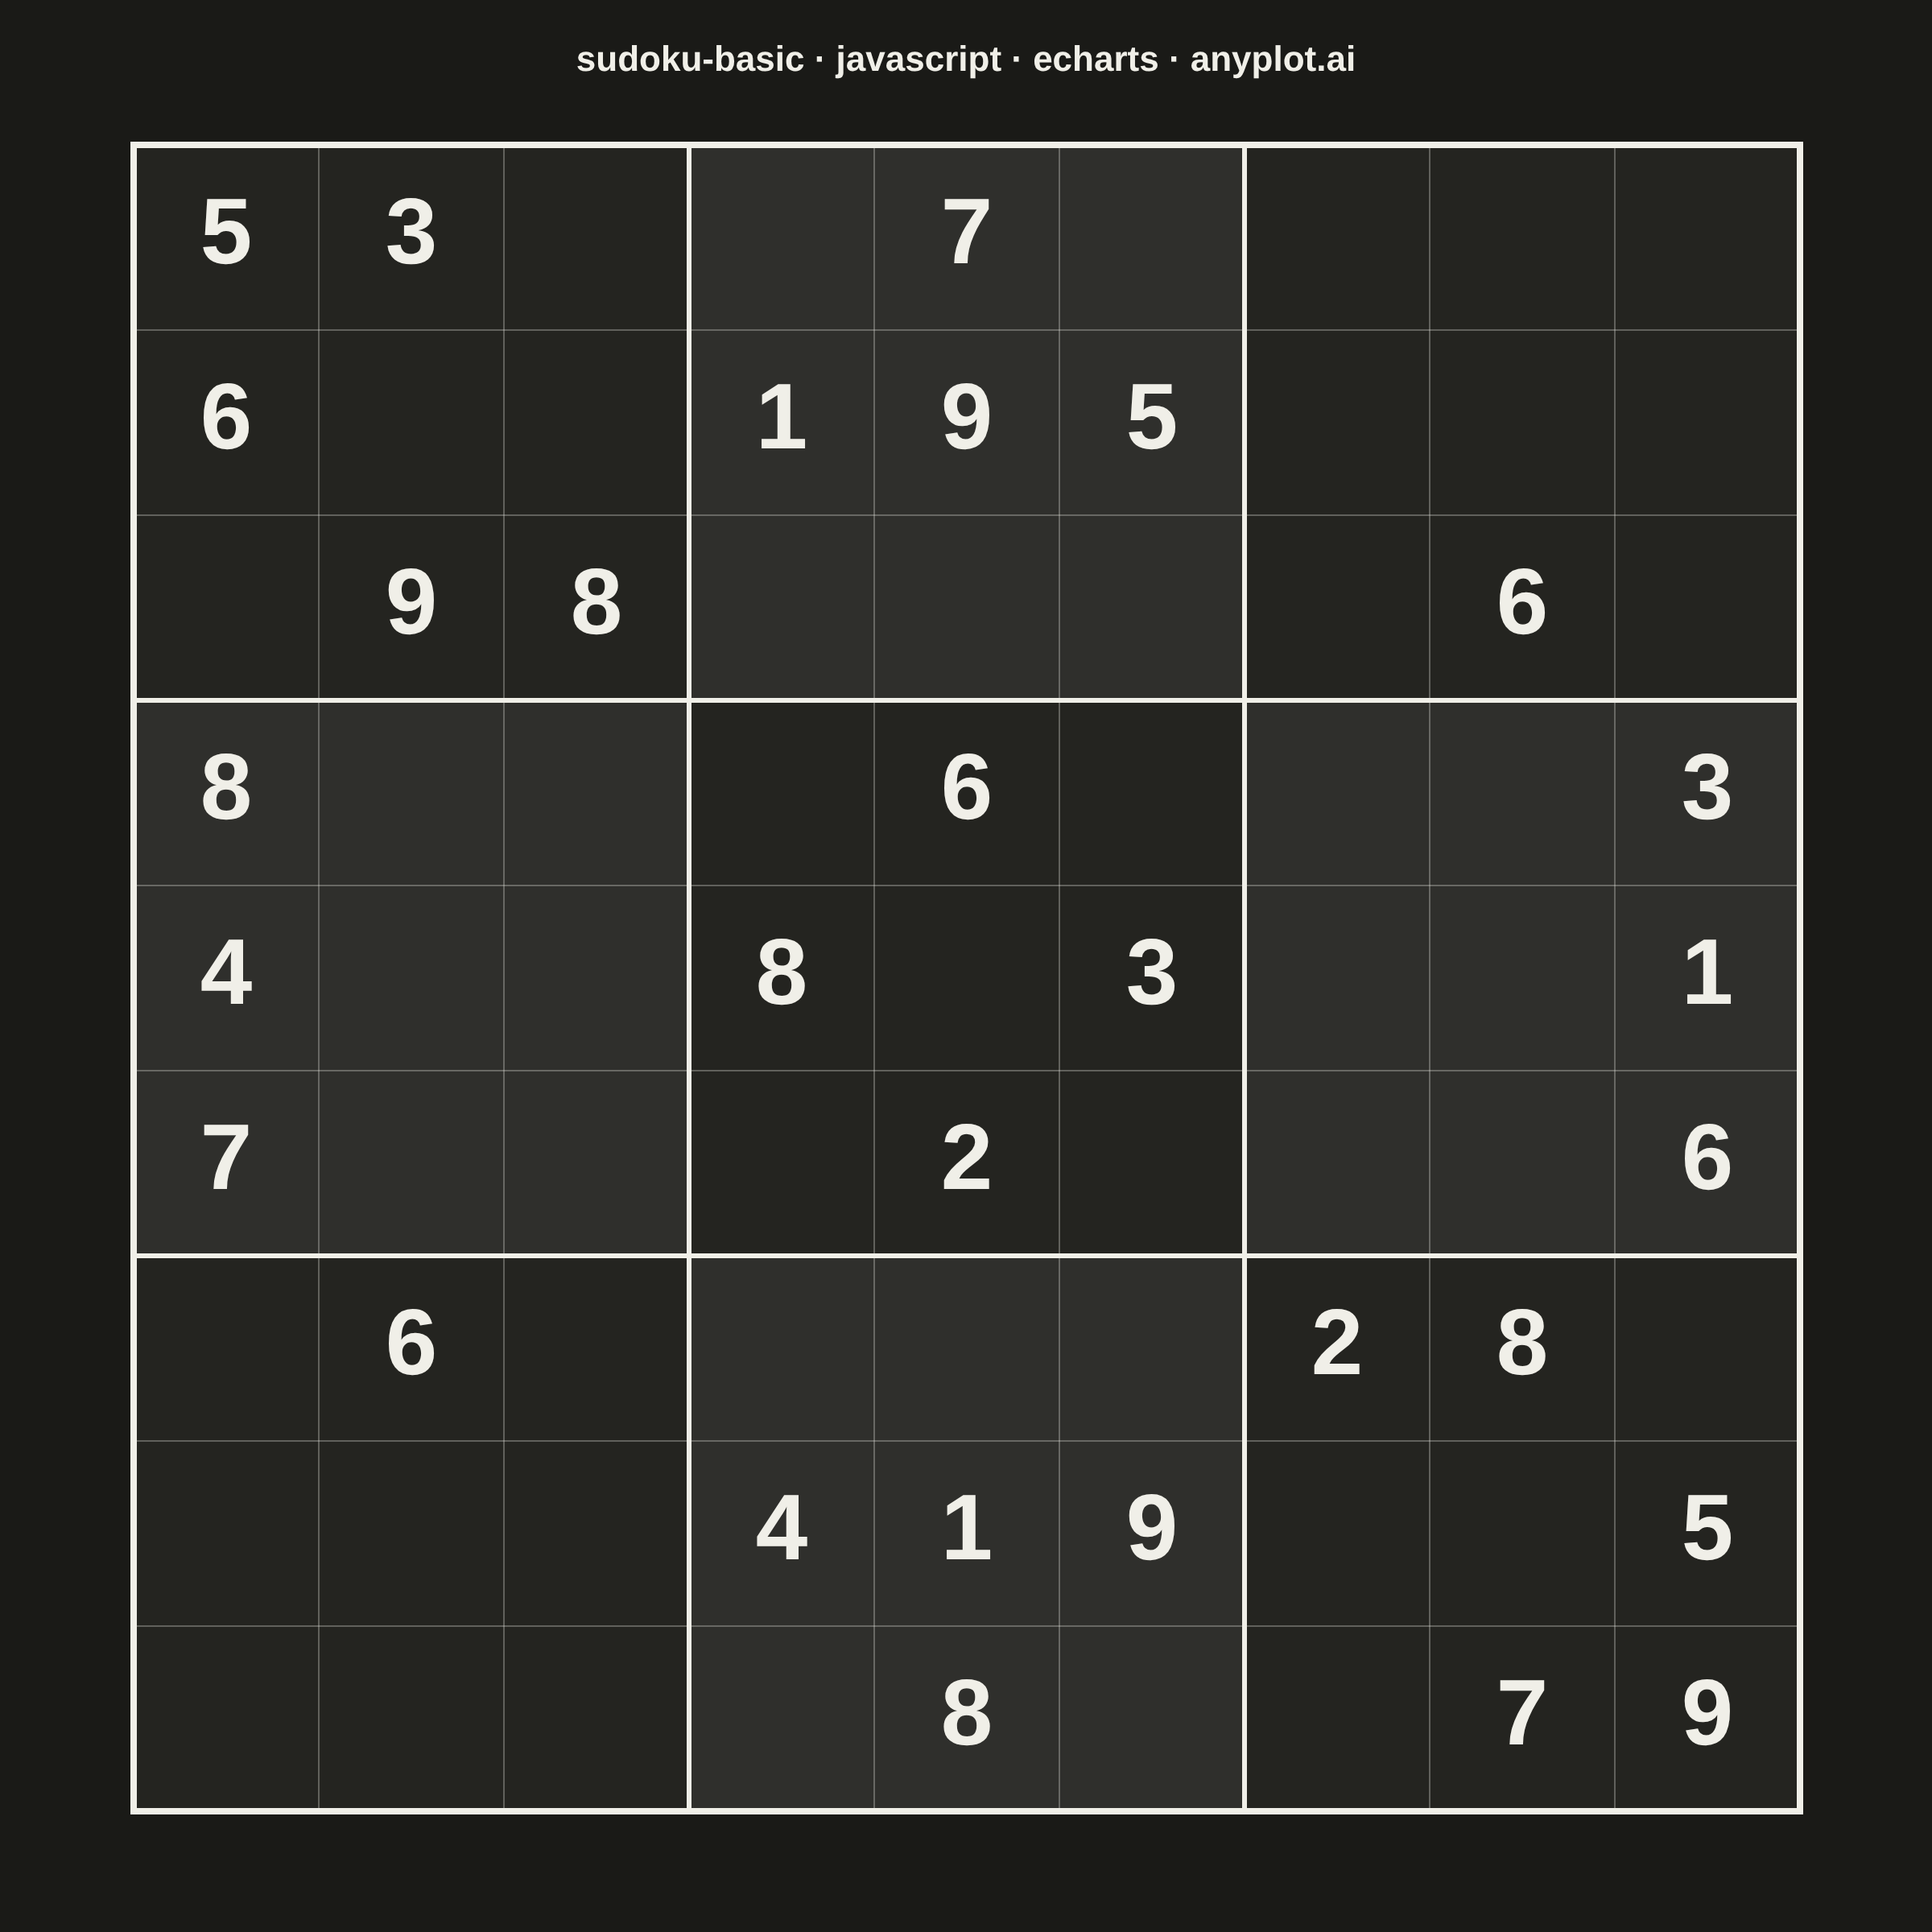
A standard 9×9 Sudoku grid with proper visual hierarchy showing 3×3 box regions. Thick lines separate the nine boxes while thin lines divide individual cells. The clean black-and-white design is optimized for printing and solving puzzles.
// anyplot.ai
// sudoku-basic: Basic Sudoku Grid
// Library: echarts 5.5.1 | JavaScript 22.23.0
// Quality: 89/100 | Created: 2026-06-25
//# anyplot-orientation: square

const t = window.ANYPLOT_TOKENS;
const THEME = window.ANYPLOT_THEME;
const W = window.ANYPLOT_SIZE.width;
const H = window.ANYPLOT_SIZE.height;

// --- Data -------------------------------------------------------------------
// Classic Sudoku puzzle (0 = empty cell)
const puzzle = [
  [5, 3, 0, 0, 7, 0, 0, 0, 0],
  [6, 0, 0, 1, 9, 5, 0, 0, 0],
  [0, 9, 8, 0, 0, 0, 0, 6, 0],
  [8, 0, 0, 0, 6, 0, 0, 0, 3],
  [4, 0, 0, 8, 0, 3, 0, 0, 1],
  [7, 0, 0, 0, 2, 0, 0, 0, 6],
  [0, 6, 0, 0, 0, 0, 2, 8, 0],
  [0, 0, 0, 4, 1, 9, 0, 0, 5],
  [0, 0, 0, 0, 8, 0, 0, 7, 9],
];

// --- Theme tokens -----------------------------------------------------------
const INK = t.ink;
const CELL_BG = t.elevatedBg;
const BOX_ALT_BG = THEME === "light"
  ? "rgba(26,26,23,0.04)"
  : "rgba(240,239,232,0.06)";
const THIN_LINE = THEME === "light"
  ? "rgba(26,26,23,0.30)"
  : "rgba(240,239,232,0.30)";

// --- Layout (CSS pixels; square canvas = 1200×1200 CSS → 2400×2400 PNG) ----
const TITLE_H = 90;
const PAD = 75;
const GRID_SIZE = Math.min(W - 2 * PAD, H - TITLE_H - PAD);
const OFFSET_X = Math.round((W - GRID_SIZE) / 2);
const OFFSET_Y = TITLE_H + Math.round((H - TITLE_H - PAD - GRID_SIZE) / 2);
const CELL = GRID_SIZE / 9;
const BOX = CELL * 3;
const NUM_FONT = Math.round(CELL * 0.50);

// --- Build graphic elements -------------------------------------------------
const els = [];

// 1. Cell background fill (base)
els.push({
  type: "rect",
  shape: { x: OFFSET_X, y: OFFSET_Y, width: GRID_SIZE, height: GRID_SIZE },
  style: { fill: CELL_BG, stroke: "none" },
  z: 1,
});

// 1b. Alternating 3×3 box tonal overlay to reinforce box region grouping
for (let br = 0; br < 3; br++) {
  for (let bc = 0; bc < 3; bc++) {
    if ((br + bc) % 2 === 0) continue;
    els.push({
      type: "rect",
      shape: {
        x: OFFSET_X + bc * BOX,
        y: OFFSET_Y + br * BOX,
        width: BOX,
        height: BOX,
      },
      style: { fill: BOX_ALT_BG, stroke: "none" },
      z: 1,
    });
  }
}

// 2. Thin cell lines (skip box boundaries at multiples of 3)
for (let i = 1; i < 9; i++) {
  if (i % 3 === 0) continue;
  const lx = OFFSET_X + i * CELL;
  const ly = OFFSET_Y + i * CELL;
  els.push({
    type: "line",
    shape: { x1: lx, y1: OFFSET_Y, x2: lx, y2: OFFSET_Y + GRID_SIZE },
    style: { stroke: THIN_LINE, lineWidth: 1 },
    z: 2,
  });
  els.push({
    type: "line",
    shape: { x1: OFFSET_X, y1: ly, x2: OFFSET_X + GRID_SIZE, y2: ly },
    style: { stroke: THIN_LINE, lineWidth: 1 },
    z: 2,
  });
}

// 3. Thick box-boundary lines at columns/rows 3 and 6
for (let i = 3; i < 9; i += 3) {
  const bx = OFFSET_X + i * CELL;
  const by = OFFSET_Y + i * CELL;
  els.push({
    type: "line",
    shape: { x1: bx, y1: OFFSET_Y, x2: bx, y2: OFFSET_Y + GRID_SIZE },
    style: { stroke: INK, lineWidth: 3 },
    z: 3,
  });
  els.push({
    type: "line",
    shape: { x1: OFFSET_X, y1: by, x2: OFFSET_X + GRID_SIZE, y2: by },
    style: { stroke: INK, lineWidth: 3 },
    z: 3,
  });
}

// 4. Outer border (slightly heavier than box lines)
els.push({
  type: "rect",
  shape: { x: OFFSET_X, y: OFFSET_Y, width: GRID_SIZE, height: GRID_SIZE },
  style: { fill: "none", stroke: INK, lineWidth: 4 },
  z: 4,
});

// 5. Numbers — bold, centered in each cell
for (let row = 0; row < 9; row++) {
  for (let col = 0; col < 9; col++) {
    const num = puzzle[row][col];
    if (num === 0) continue;
    els.push({
      type: "text",
      style: {
        text: String(num),
        x: OFFSET_X + col * CELL + CELL / 2,
        y: OFFSET_Y + row * CELL + CELL / 2,
        textAlign: "center",
        textVerticalAlign: "middle",
        fill: INK,
        fontSize: NUM_FONT,
        fontFamily: "'Helvetica Neue', Arial, sans-serif",
        fontWeight: "bold",
      },
      z: 5,
    });
  }
}

// --- Init -------------------------------------------------------------------
const chart = echarts.init(document.getElementById("container"));

chart.setOption({
  animation: false,
  backgroundColor: "transparent",
  title: {
    text: "sudoku-basic · javascript · echarts · anyplot.ai",
    left: "center",
    top: 22,
    textStyle: { color: t.ink, fontSize: 22 },
  },
  graphic: els,
});
Runnable source as JSON, for any HTTP client: https://api.anyplot.ai/specs/sudoku-basic/echarts/code. Any spec id and library id listed in llms-full.txt fit the same URL shape; every URL below is complete and callable.
{
  "spec_id": "sudoku-basic",
  "language": "javascript",
  "library": "echarts",
  "page": "https://anyplot.ai/sudoku-basic/javascript/echarts",
  "hub": "https://anyplot.ai/sudoku-basic",
  "code_json": "https://api.anyplot.ai/specs/sudoku-basic/echarts/code",
  "spec_json": "https://api.anyplot.ai/specs/sudoku-basic",
  "render_light_png": "https://storage.googleapis.com/anyplot-images/plots/sudoku-basic/javascript/echarts/plot-light.png",
  "render_dark_png": "https://storage.googleapis.com/anyplot-images/plots/sudoku-basic/javascript/echarts/plot-dark.png",
  "interactive_light_html": "https://storage.googleapis.com/anyplot-images/plots/sudoku-basic/javascript/echarts/plot-light.html",
  "interactive_dark_html": "https://storage.googleapis.com/anyplot-images/plots/sudoku-basic/javascript/echarts/plot-dark.html",
  "quality_score": 89.0,
  "license": "MIT",
  "guide": "https://anyplot.ai/llms.txt"
}
Part of Basic Sudoku Grid on anyplot.ai.