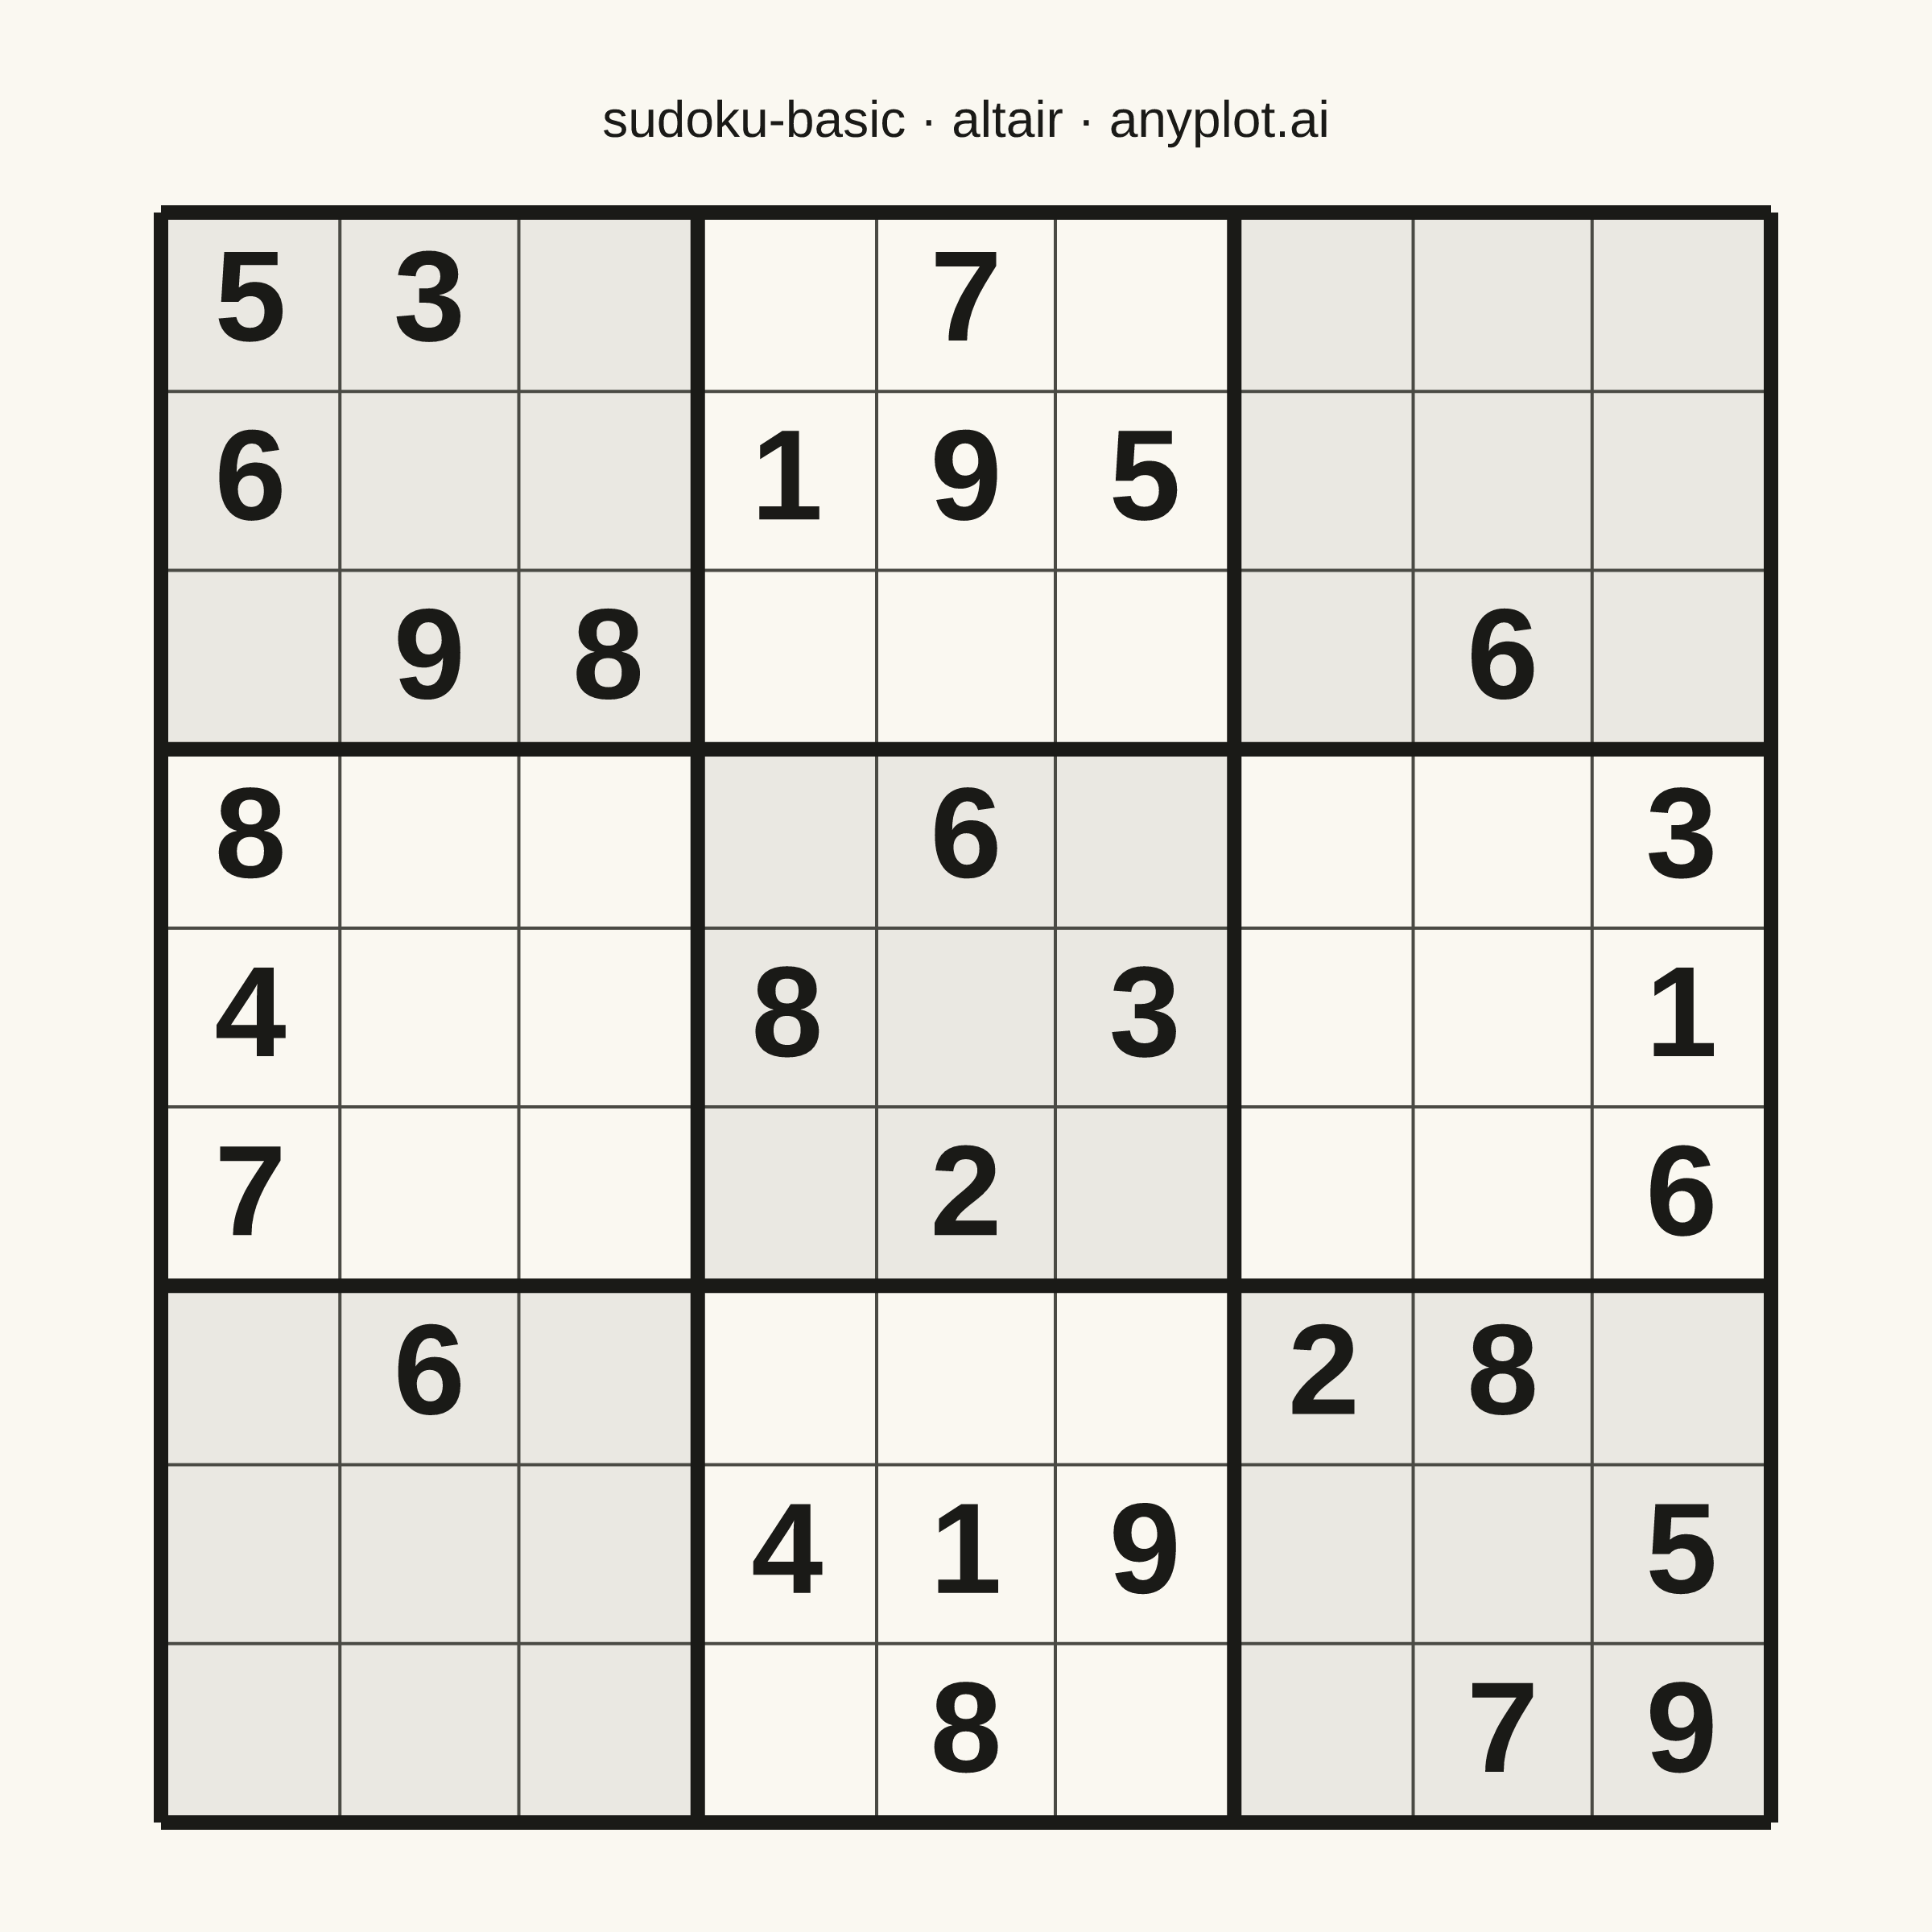
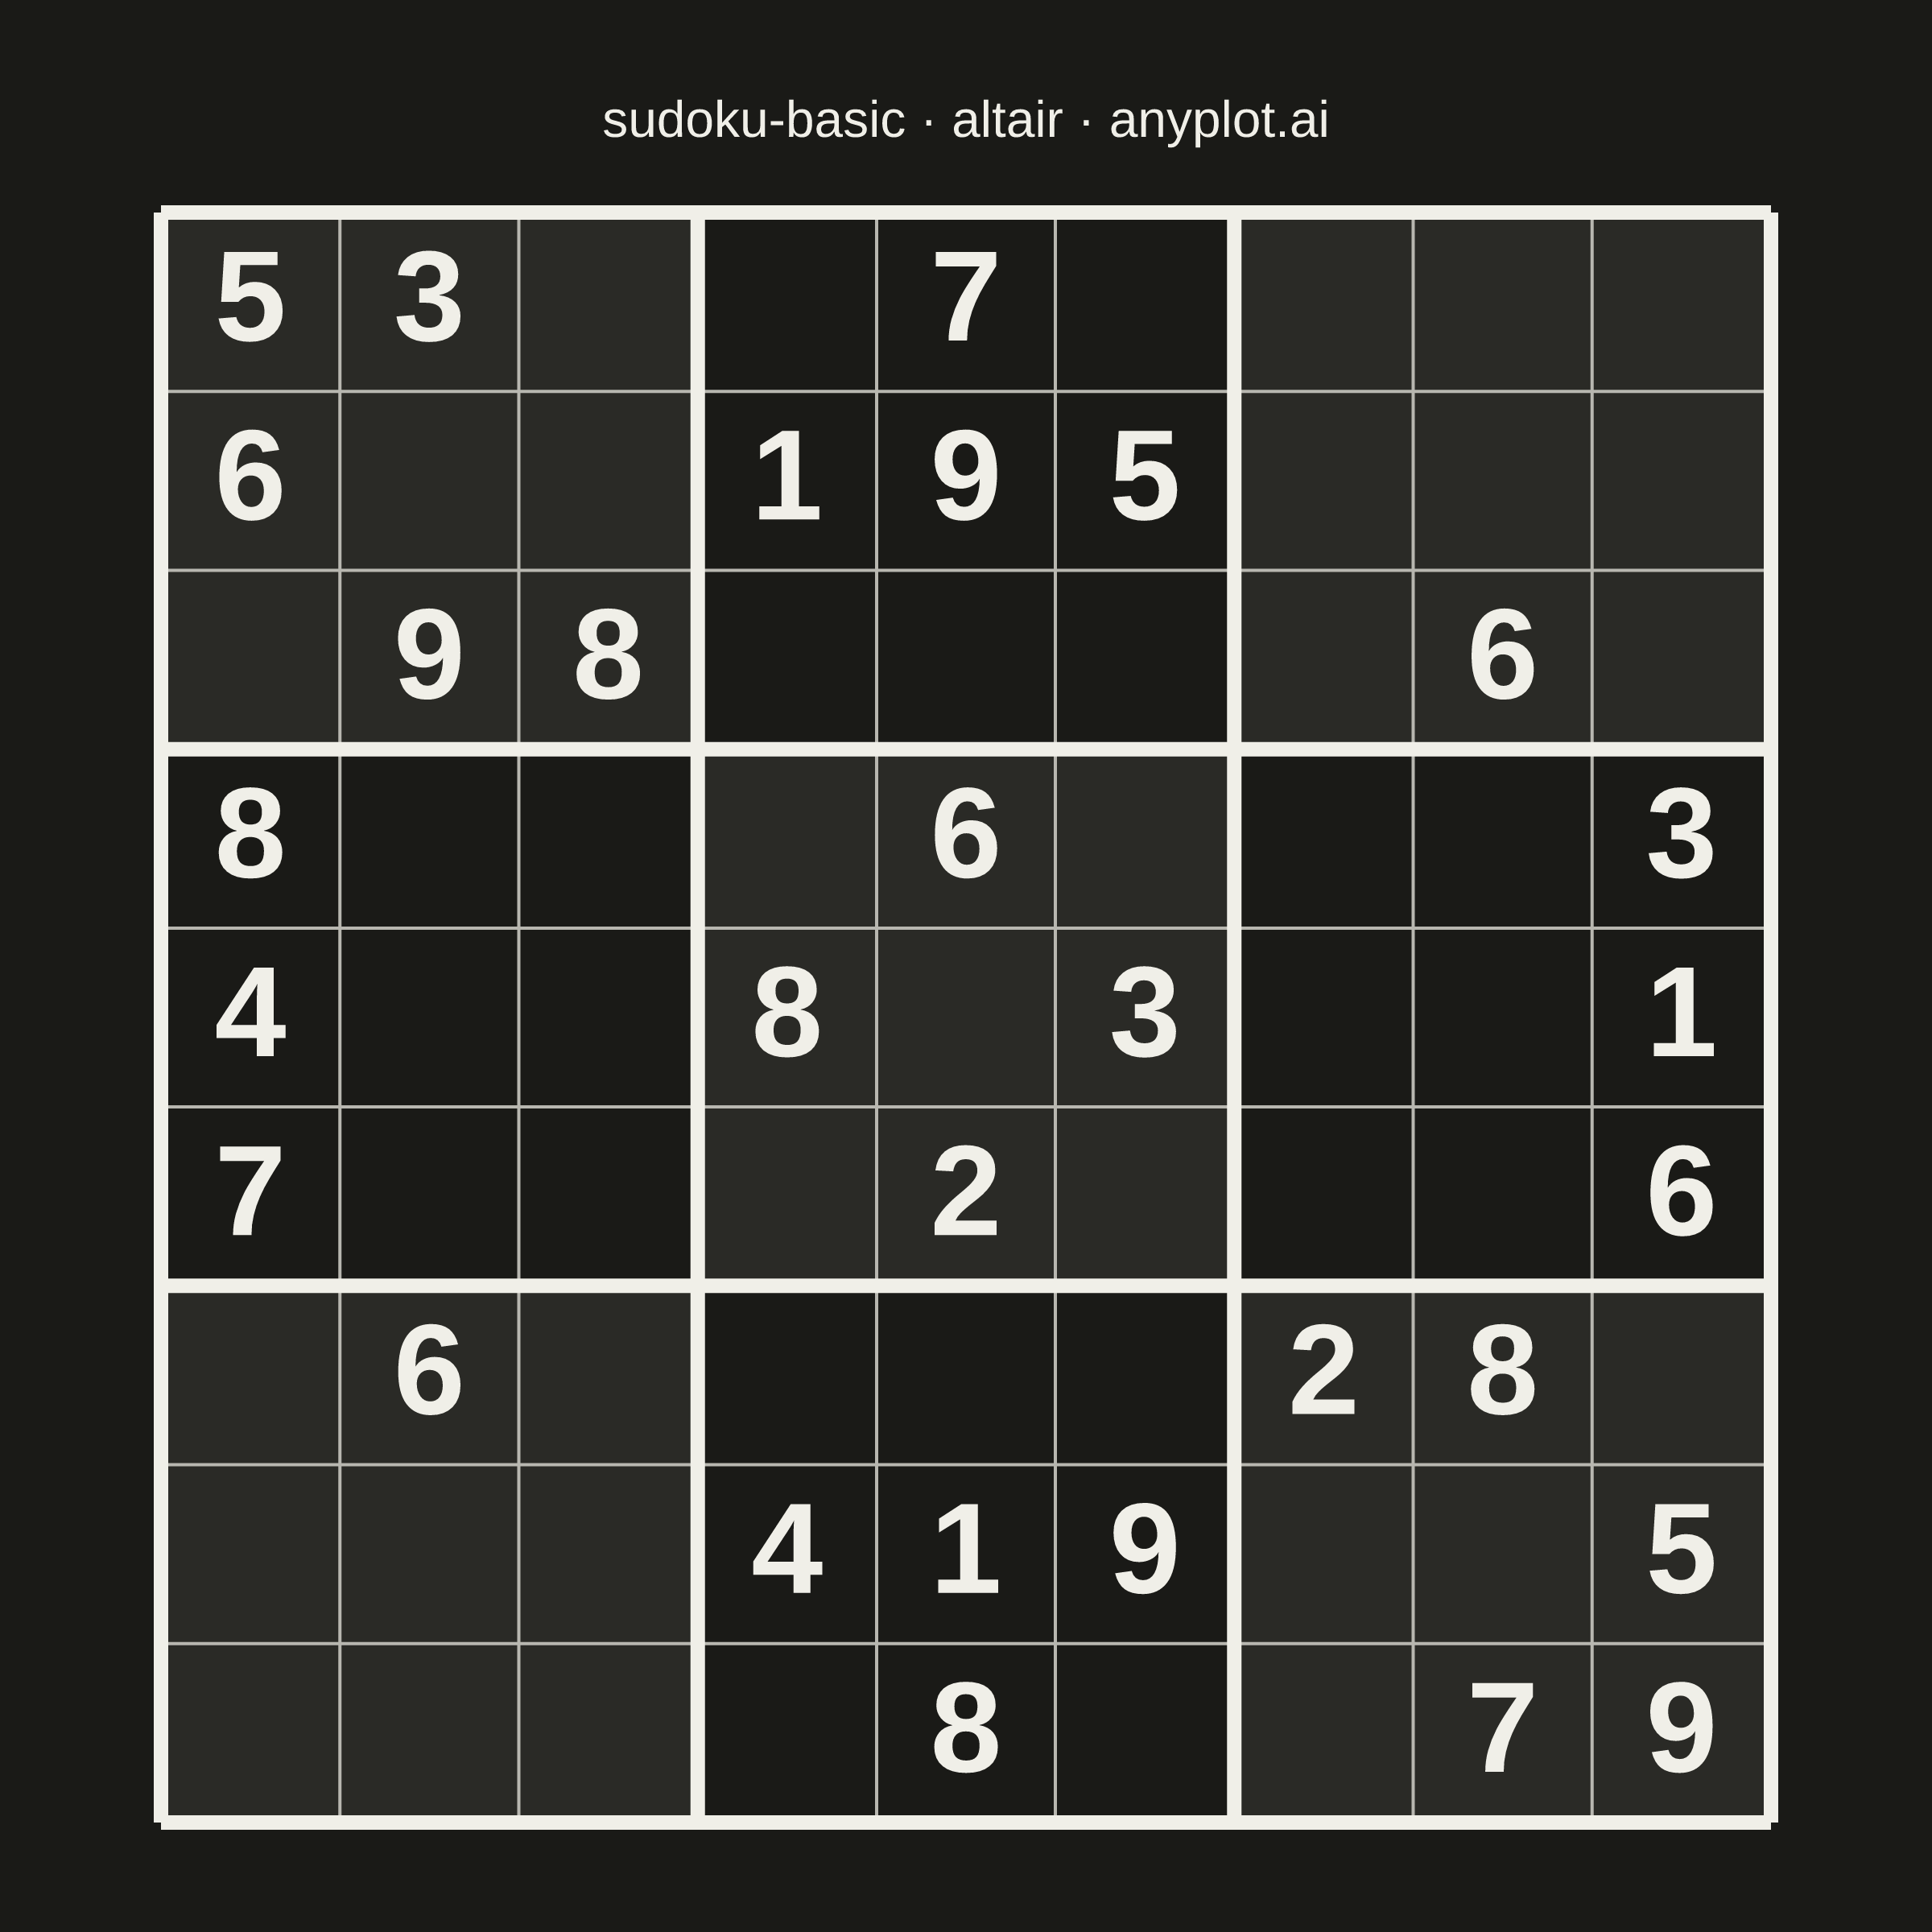
A standard 9×9 Sudoku grid with proper visual hierarchy showing 3×3 box regions. Thick lines separate the nine boxes while thin lines divide individual cells. The clean black-and-white design is optimized for printing and solving puzzles.
""" anyplot.ai
sudoku-basic: Basic Sudoku Grid
Library: altair 6.2.2 | Python 3.13.14
Quality: 88/100 | Updated: 2026-06-25
"""

import os

import altair as alt
import pandas as pd
from PIL import Image


# Theme tokens
THEME = os.getenv("ANYPLOT_THEME", "light")
PAGE_BG = "#FAF8F1" if THEME == "light" else "#1A1A17"
INK = "#1A1A17" if THEME == "light" else "#F0EFE8"
INK_SOFT = "#4A4A44" if THEME == "light" else "#B8B7B0"

# Sudoku grid data - "World's Hardest Sudoku"
grid = [
    [5, 3, 0, 0, 7, 0, 0, 0, 0],
    [6, 0, 0, 1, 9, 5, 0, 0, 0],
    [0, 9, 8, 0, 0, 0, 0, 6, 0],
    [8, 0, 0, 0, 6, 0, 0, 0, 3],
    [4, 0, 0, 8, 0, 3, 0, 0, 1],
    [7, 0, 0, 0, 2, 0, 0, 0, 6],
    [0, 6, 0, 0, 0, 0, 2, 8, 0],
    [0, 0, 0, 4, 1, 9, 0, 0, 5],
    [0, 0, 0, 0, 8, 0, 0, 7, 9],
]

# Cell data with tooltip metadata
cell_data = []
for row in range(9):
    for col in range(9):
        value = grid[row][col]
        if value != 0:
            cell_data.append(
                {
                    "col": col + 0.5,
                    "row": 8 - row + 0.5,
                    "value": str(value),
                    "row_num": row + 1,
                    "col_num": col + 1,
                    "box": (row // 3) * 3 + col // 3 + 1,
                }
            )

df_numbers = pd.DataFrame(cell_data)

# Alternating 3×3 box backgrounds — checkerboard pattern for visual depth
shaded_boxes = [
    {"x": bc * 3, "x2": bc * 3 + 3, "y": br * 3, "y2": br * 3 + 3}
    for br in range(3)
    for bc in range(3)
    if (br + bc) % 2 == 0
]
df_shaded = pd.DataFrame(shaded_boxes)

# Grid lines — thin for cells, thick for 3×3 box boundaries
thin_lines = []
thick_lines = []
for i in range(10):
    v_line = {"x": i, "x2": i, "y": 0, "y2": 9}
    h_line = {"x": 0, "x2": 9, "y": i, "y2": i}
    if i % 3 == 0:
        thick_lines.append(v_line)
        thick_lines.append(h_line)
    else:
        thin_lines.append(v_line)
        thin_lines.append(h_line)

df_thin = pd.DataFrame(thin_lines)
df_thick = pd.DataFrame(thick_lines)

# Layer 1: subtle checkerboard shading for 3×3 box regions
box_bg = alt.Chart(df_shaded).mark_rect(color=INK, fillOpacity=0.07).encode(x="x:Q", x2="x2:Q", y="y:Q", y2="y2:Q")

# Layer 2 & 3: thin cell lines, thick box-separator lines
thin_grid = alt.Chart(df_thin).mark_rule(color=INK_SOFT, strokeWidth=1.0).encode(x="x:Q", x2="x2:Q", y="y:Q", y2="y2:Q")

thick_grid = alt.Chart(df_thick).mark_rule(color=INK, strokeWidth=4.5).encode(x="x:Q", x2="x2:Q", y="y:Q", y2="y2:Q")

# Layer 4: numbers with interactive tooltips for the HTML output
numbers = (
    alt.Chart(df_numbers)
    .mark_text(fontSize=40, fontWeight="bold", color=INK)
    .encode(
        x="col:Q",
        y="row:Q",
        text="value:N",
        tooltip=[
            alt.Tooltip("row_num:Q", title="Row"),
            alt.Tooltip("col_num:Q", title="Column"),
            alt.Tooltip("value:N", title="Digit"),
            alt.Tooltip("box:Q", title="Box"),
        ],
    )
)

chart = (
    alt.layer(box_bg, thin_grid, thick_grid, numbers)
    .properties(
        width=500,
        height=500,
        background=PAGE_BG,
        title=alt.Title(
            "sudoku-basic · python · altair · anyplot.ai",
            fontSize=16,
            fontWeight="normal",
            color=INK,
            anchor="middle",
            offset=16,
        ),
    )
    .configure_view(fill=PAGE_BG, stroke=None)
    .configure_axis(grid=False, domain=False, ticks=False, labels=False, title=None)
    .configure_scale(bandPaddingInner=0, bandPaddingOuter=0)
)

# Save — square target 2400×2400
TW, TH = 2400, 2400
chart.save(f"plot-{THEME}.png", scale_factor=4.0)
chart.save(f"plot-{THEME}.html")

# Pad to exact target dimensions (vl-convert inner-view is smaller than the PNG target)
_img = Image.open(f"plot-{THEME}.png").convert("RGB")
_w, _h = _img.size
if _w > TW or _h > TH:
    raise SystemExit(
        f"altair vl-convert produced {_w}×{_h}, exceeds target {TW}×{TH}. "
        f"Shrink chart .properties(width=, height=) values and re-render."
    )
if _w < TW or _h < TH:
    _canvas = Image.new("RGB", (TW, TH), PAGE_BG)
    _canvas.paste(_img, ((TW - _w) // 2, (TH - _h) // 2))
    _canvas.save(f"plot-{THEME}.png")
Runnable source as JSON, for any HTTP client: https://api.anyplot.ai/specs/sudoku-basic/altair/code. Any spec id and library id listed in llms-full.txt fit the same URL shape; every URL below is complete and callable.
{
  "spec_id": "sudoku-basic",
  "language": "python",
  "library": "altair",
  "page": "https://anyplot.ai/sudoku-basic/python/altair",
  "hub": "https://anyplot.ai/sudoku-basic",
  "code_json": "https://api.anyplot.ai/specs/sudoku-basic/altair/code",
  "spec_json": "https://api.anyplot.ai/specs/sudoku-basic",
  "render_light_png": "https://storage.googleapis.com/anyplot-images/plots/sudoku-basic/python/altair/plot-light.png",
  "render_dark_png": "https://storage.googleapis.com/anyplot-images/plots/sudoku-basic/python/altair/plot-dark.png",
  "interactive_light_html": "https://storage.googleapis.com/anyplot-images/plots/sudoku-basic/python/altair/plot-light.html",
  "interactive_dark_html": "https://storage.googleapis.com/anyplot-images/plots/sudoku-basic/python/altair/plot-dark.html",
  "quality_score": 88.0,
  "license": "MIT",
  "guide": "https://anyplot.ai/llms.txt"
}
Part of Basic Sudoku Grid on anyplot.ai.