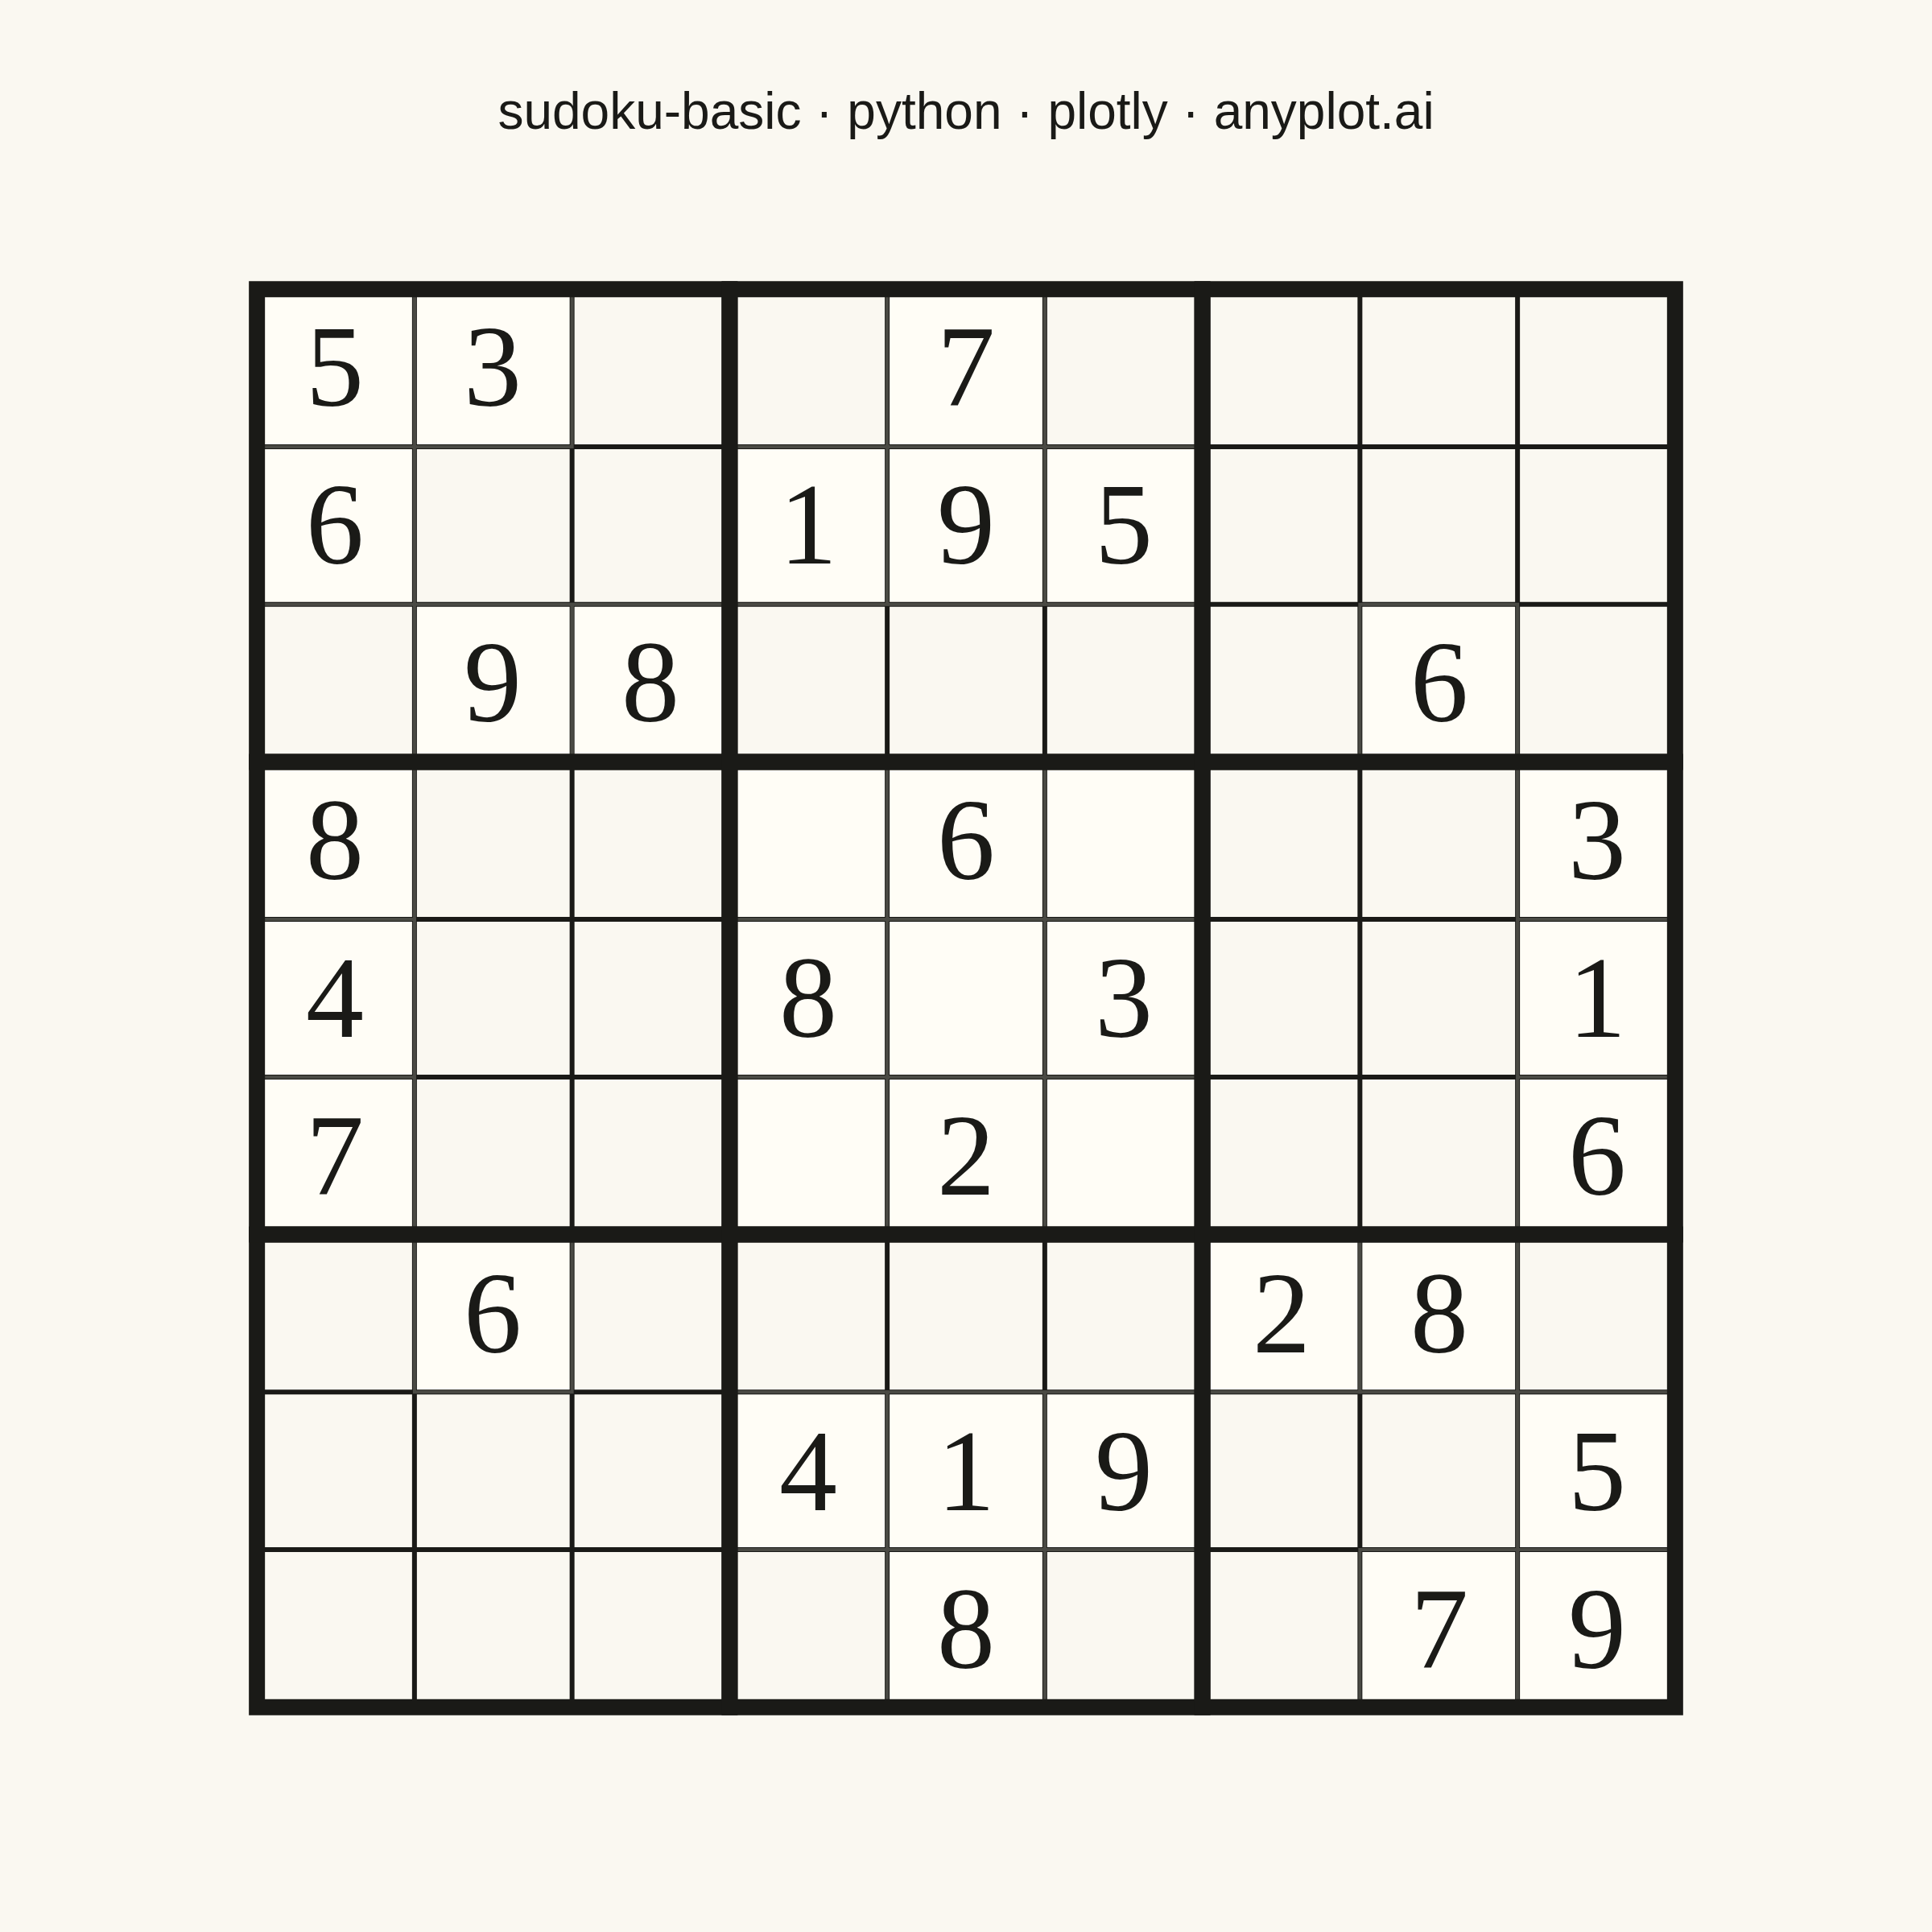
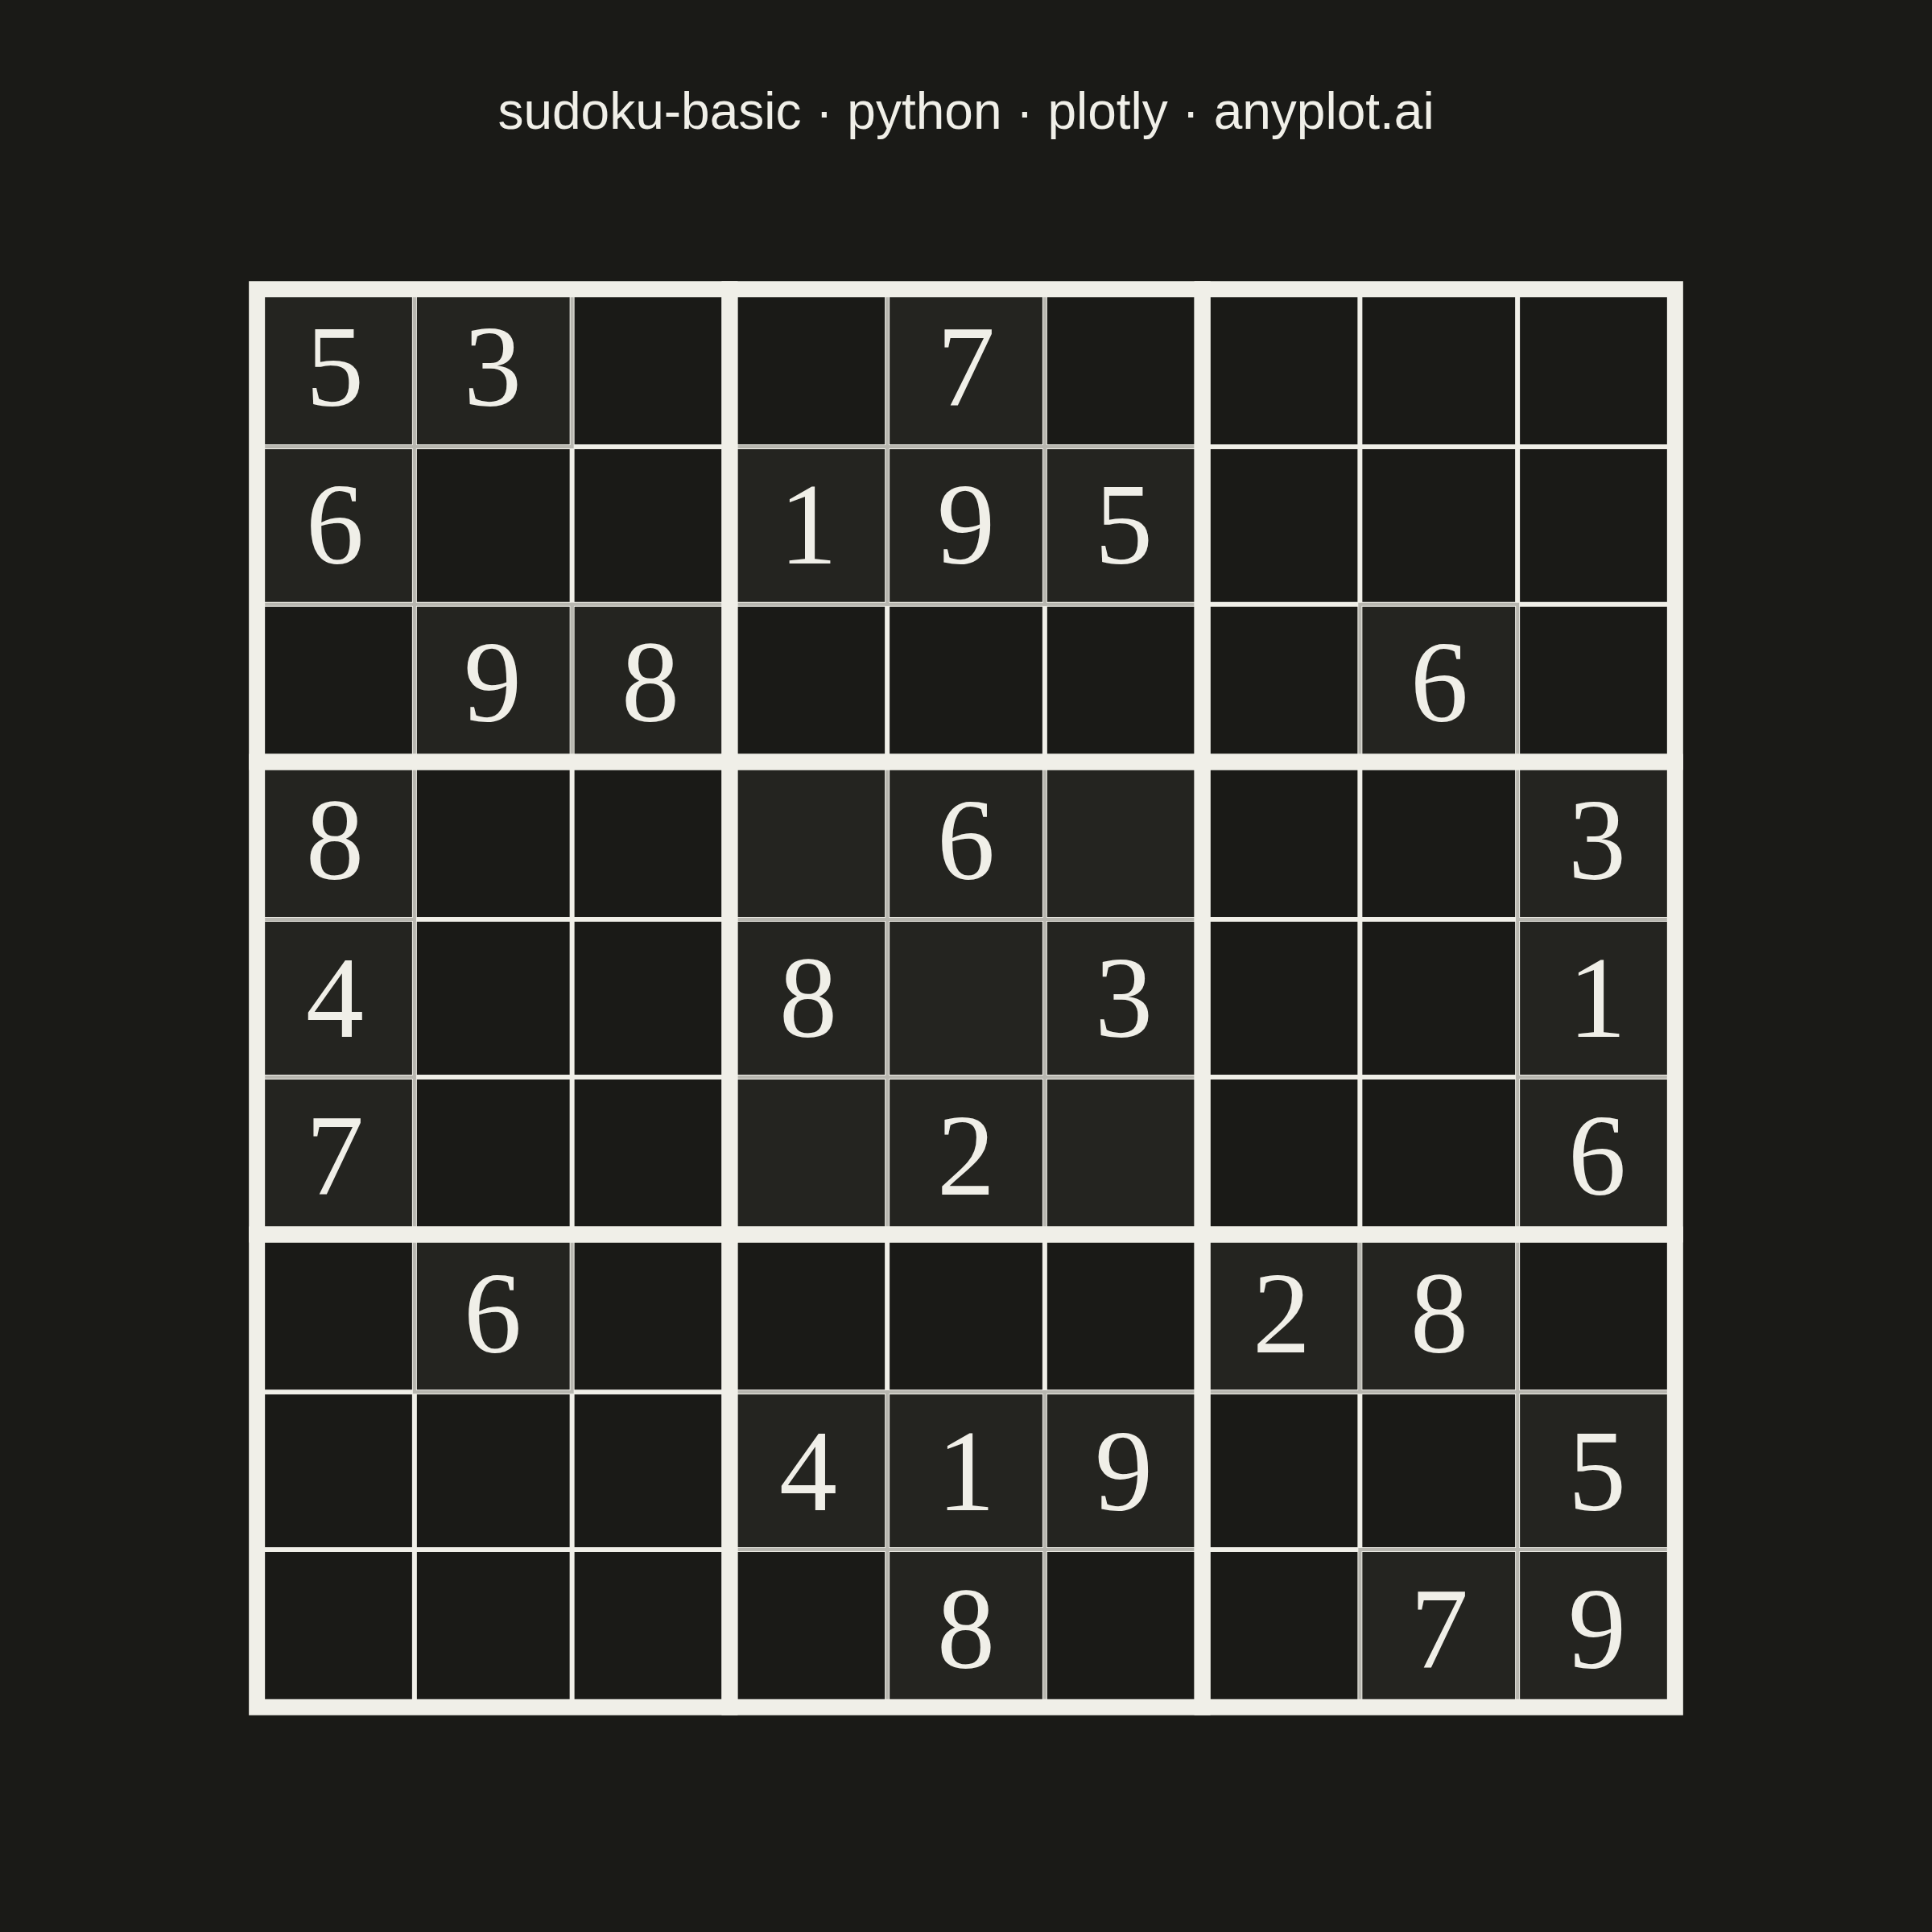
A standard 9×9 Sudoku grid with proper visual hierarchy showing 3×3 box regions. Thick lines separate the nine boxes while thin lines divide individual cells. The clean black-and-white design is optimized for printing and solving puzzles.
""" anyplot.ai
sudoku-basic: Basic Sudoku Grid
Library: plotly 6.8.0 | Python 3.13.14
Quality: 92/100 | Updated: 2026-06-25
"""

import os
import sys


# Remove script's own directory from sys.path so 'plotly.py' doesn't shadow the plotly package
sys.path.pop(0)

import plotly.graph_objects as go


# Theme tokens (Imprint palette chrome)
THEME = os.getenv("ANYPLOT_THEME", "light")
PAGE_BG = "#FAF8F1" if THEME == "light" else "#1A1A17"
ELEVATED_BG = "#FFFDF6" if THEME == "light" else "#242420"
INK = "#1A1A17" if THEME == "light" else "#F0EFE8"
INK_SOFT = "#4A4A44" if THEME == "light" else "#B8B7B0"

# Data - A partially filled Sudoku puzzle (0 = empty cell)
grid = [
    [5, 3, 0, 0, 7, 0, 0, 0, 0],
    [6, 0, 0, 1, 9, 5, 0, 0, 0],
    [0, 9, 8, 0, 0, 0, 0, 6, 0],
    [8, 0, 0, 0, 6, 0, 0, 0, 3],
    [4, 0, 0, 8, 0, 3, 0, 0, 1],
    [7, 0, 0, 0, 2, 0, 0, 0, 6],
    [0, 6, 0, 0, 0, 0, 2, 8, 0],
    [0, 0, 0, 4, 1, 9, 0, 0, 5],
    [0, 0, 0, 0, 8, 0, 0, 7, 9],
]

fig = go.Figure()

shapes = []

# Center box (rows 3-5, cols 3-5) focal point — ELEVATED_BG on all cells creates a visual anchor
for row in range(3, 6):
    for col in range(3, 6):
        if grid[row][col] == 0:
            shapes.append(
                {
                    "type": "rect",
                    "x0": col,
                    "x1": col + 1,
                    "y0": 8 - row,
                    "y1": 9 - row,
                    "fillcolor": ELEVATED_BG,
                    "line": {"width": 0},
                    "layer": "below",
                }
            )

# Given-number cell fills — ELEVATED_BG background (below traces)
for row in range(9):
    for col in range(9):
        if grid[row][col] != 0:
            shapes.append(
                {
                    "type": "rect",
                    "x0": col,
                    "x1": col + 1,
                    "y0": 8 - row,
                    "y1": 9 - row,
                    "fillcolor": ELEVATED_BG,
                    "line": {"width": 0},
                    "layer": "below",
                }
            )

# Given-number cell accent borders (above traces) — clearly distinguishes givens from empty cells
for row in range(9):
    for col in range(9):
        if grid[row][col] != 0:
            shapes.append(
                {
                    "type": "rect",
                    "x0": col,
                    "x1": col + 1,
                    "y0": 8 - row,
                    "y1": 9 - row,
                    "fillcolor": "rgba(0,0,0,0)",
                    "line": {"color": INK_SOFT, "width": 1},
                    "layer": "above",
                }
            )

# Thick box boundaries via shapes API — rect shapes give clean corner joins (9 boxes)
for box_row in range(3):
    for box_col in range(3):
        shapes.append(
            {
                "type": "rect",
                "x0": box_col * 3,
                "x1": (box_col + 1) * 3,
                "y0": box_row * 3,
                "y1": (box_row + 1) * 3,
                "fillcolor": "rgba(0,0,0,0)",
                "line": {"color": INK, "width": 5},
                "layer": "above",
            }
        )

# Cell numbers as annotations (36px × scale=4 → 144px rendered — fills cell nicely)
annotations = []
for row in range(9):
    for col in range(9):
        value = grid[row][col]
        if value != 0:
            annotations.append(
                {
                    "x": col + 0.5,
                    "y": 8 - row + 0.5,
                    "text": str(value),
                    "font": {"size": 36, "color": INK, "family": "Arial Black"},
                    "showarrow": False,
                    "xanchor": "center",
                    "yanchor": "middle",
                }
            )

# Thin lines for individual cell boundaries (skip multiples of 3 — those are box lines)
thin_lines_x = []
thin_lines_y = []
for i in range(10):
    if i % 3 != 0:
        thin_lines_x.extend([i, i, None, 0, 9, None])
        thin_lines_y.extend([0, 9, None, i, i, None])

fig.add_trace(
    go.Scatter(
        x=thin_lines_x,
        y=thin_lines_y,
        mode="lines",
        line={"color": INK, "width": 1.5},
        hoverinfo="skip",
        showlegend=False,
    )
)

# Invisible hover layer — includes box number for richer cell context in HTML
hover_x = [c + 0.5 for r in range(9) for c in range(9)]
hover_y = [8 - r + 0.5 for r in range(9) for c in range(9)]
hover_text = [
    f"Box {(r // 3) * 3 + (c // 3) + 1}, R{r + 1}C{c + 1}" + (f" = {grid[r][c]}" if grid[r][c] != 0 else " (empty)")
    for r in range(9)
    for c in range(9)
]
fig.add_trace(
    go.Scatter(
        x=hover_x,
        y=hover_y,
        mode="markers",
        marker={"size": 50, "color": "rgba(0,0,0,0)"},
        hovertext=hover_text,
        hoverinfo="text",
        showlegend=False,
    )
)

# Layout — square canvas (2400×2400) matches the symmetric 9×9 grid
fig.update_layout(
    autosize=False,
    title={
        "text": "sudoku-basic · python · plotly · anyplot.ai",
        "font": {"size": 16, "color": INK},
        "x": 0.5,
        "xanchor": "center",
    },
    xaxis={
        "showgrid": False,
        "zeroline": False,
        "showticklabels": False,
        "range": [-0.2, 9.2],
        "scaleanchor": "y",
        "scaleratio": 1,
        "fixedrange": True,
    },
    yaxis={"showgrid": False, "zeroline": False, "showticklabels": False, "range": [-0.2, 9.2], "fixedrange": True},
    paper_bgcolor=PAGE_BG,
    plot_bgcolor=PAGE_BG,
    font={"color": INK_SOFT},
    annotations=annotations,
    shapes=shapes,
    margin={"l": 60, "r": 60, "t": 80, "b": 60},
)

# Save — square 2400×2400 (width=600, height=600, scale=4)
fig.write_image(f"plot-{THEME}.png", width=600, height=600, scale=4)
fig.write_html(f"plot-{THEME}.html", include_plotlyjs="cdn")
Runnable source as JSON, for any HTTP client: https://api.anyplot.ai/specs/sudoku-basic/plotly/code. Any spec id and library id listed in llms-full.txt fit the same URL shape; every URL below is complete and callable.
{
  "spec_id": "sudoku-basic",
  "language": "python",
  "library": "plotly",
  "page": "https://anyplot.ai/sudoku-basic/python/plotly",
  "hub": "https://anyplot.ai/sudoku-basic",
  "code_json": "https://api.anyplot.ai/specs/sudoku-basic/plotly/code",
  "spec_json": "https://api.anyplot.ai/specs/sudoku-basic",
  "render_light_png": "https://storage.googleapis.com/anyplot-images/plots/sudoku-basic/python/plotly/plot-light.png",
  "render_dark_png": "https://storage.googleapis.com/anyplot-images/plots/sudoku-basic/python/plotly/plot-dark.png",
  "interactive_light_html": "https://storage.googleapis.com/anyplot-images/plots/sudoku-basic/python/plotly/plot-light.html",
  "interactive_dark_html": "https://storage.googleapis.com/anyplot-images/plots/sudoku-basic/python/plotly/plot-dark.html",
  "quality_score": 92.0,
  "license": "MIT",
  "guide": "https://anyplot.ai/llms.txt"
}
Part of Basic Sudoku Grid on anyplot.ai.