The same plot in 14 other libraries — Python: Altair, Bokeh, lets-plot, Matplotlib, Plotly, plotnine, Pygal, Seaborn; Julia: Makie.jl; JavaScript: Chart.js, D3.js, Apache ECharts, Highcharts, MUI X Charts. Compare all 15 side by side: Basic Sudoku Grid in Python, R, Julia and JavaScript.
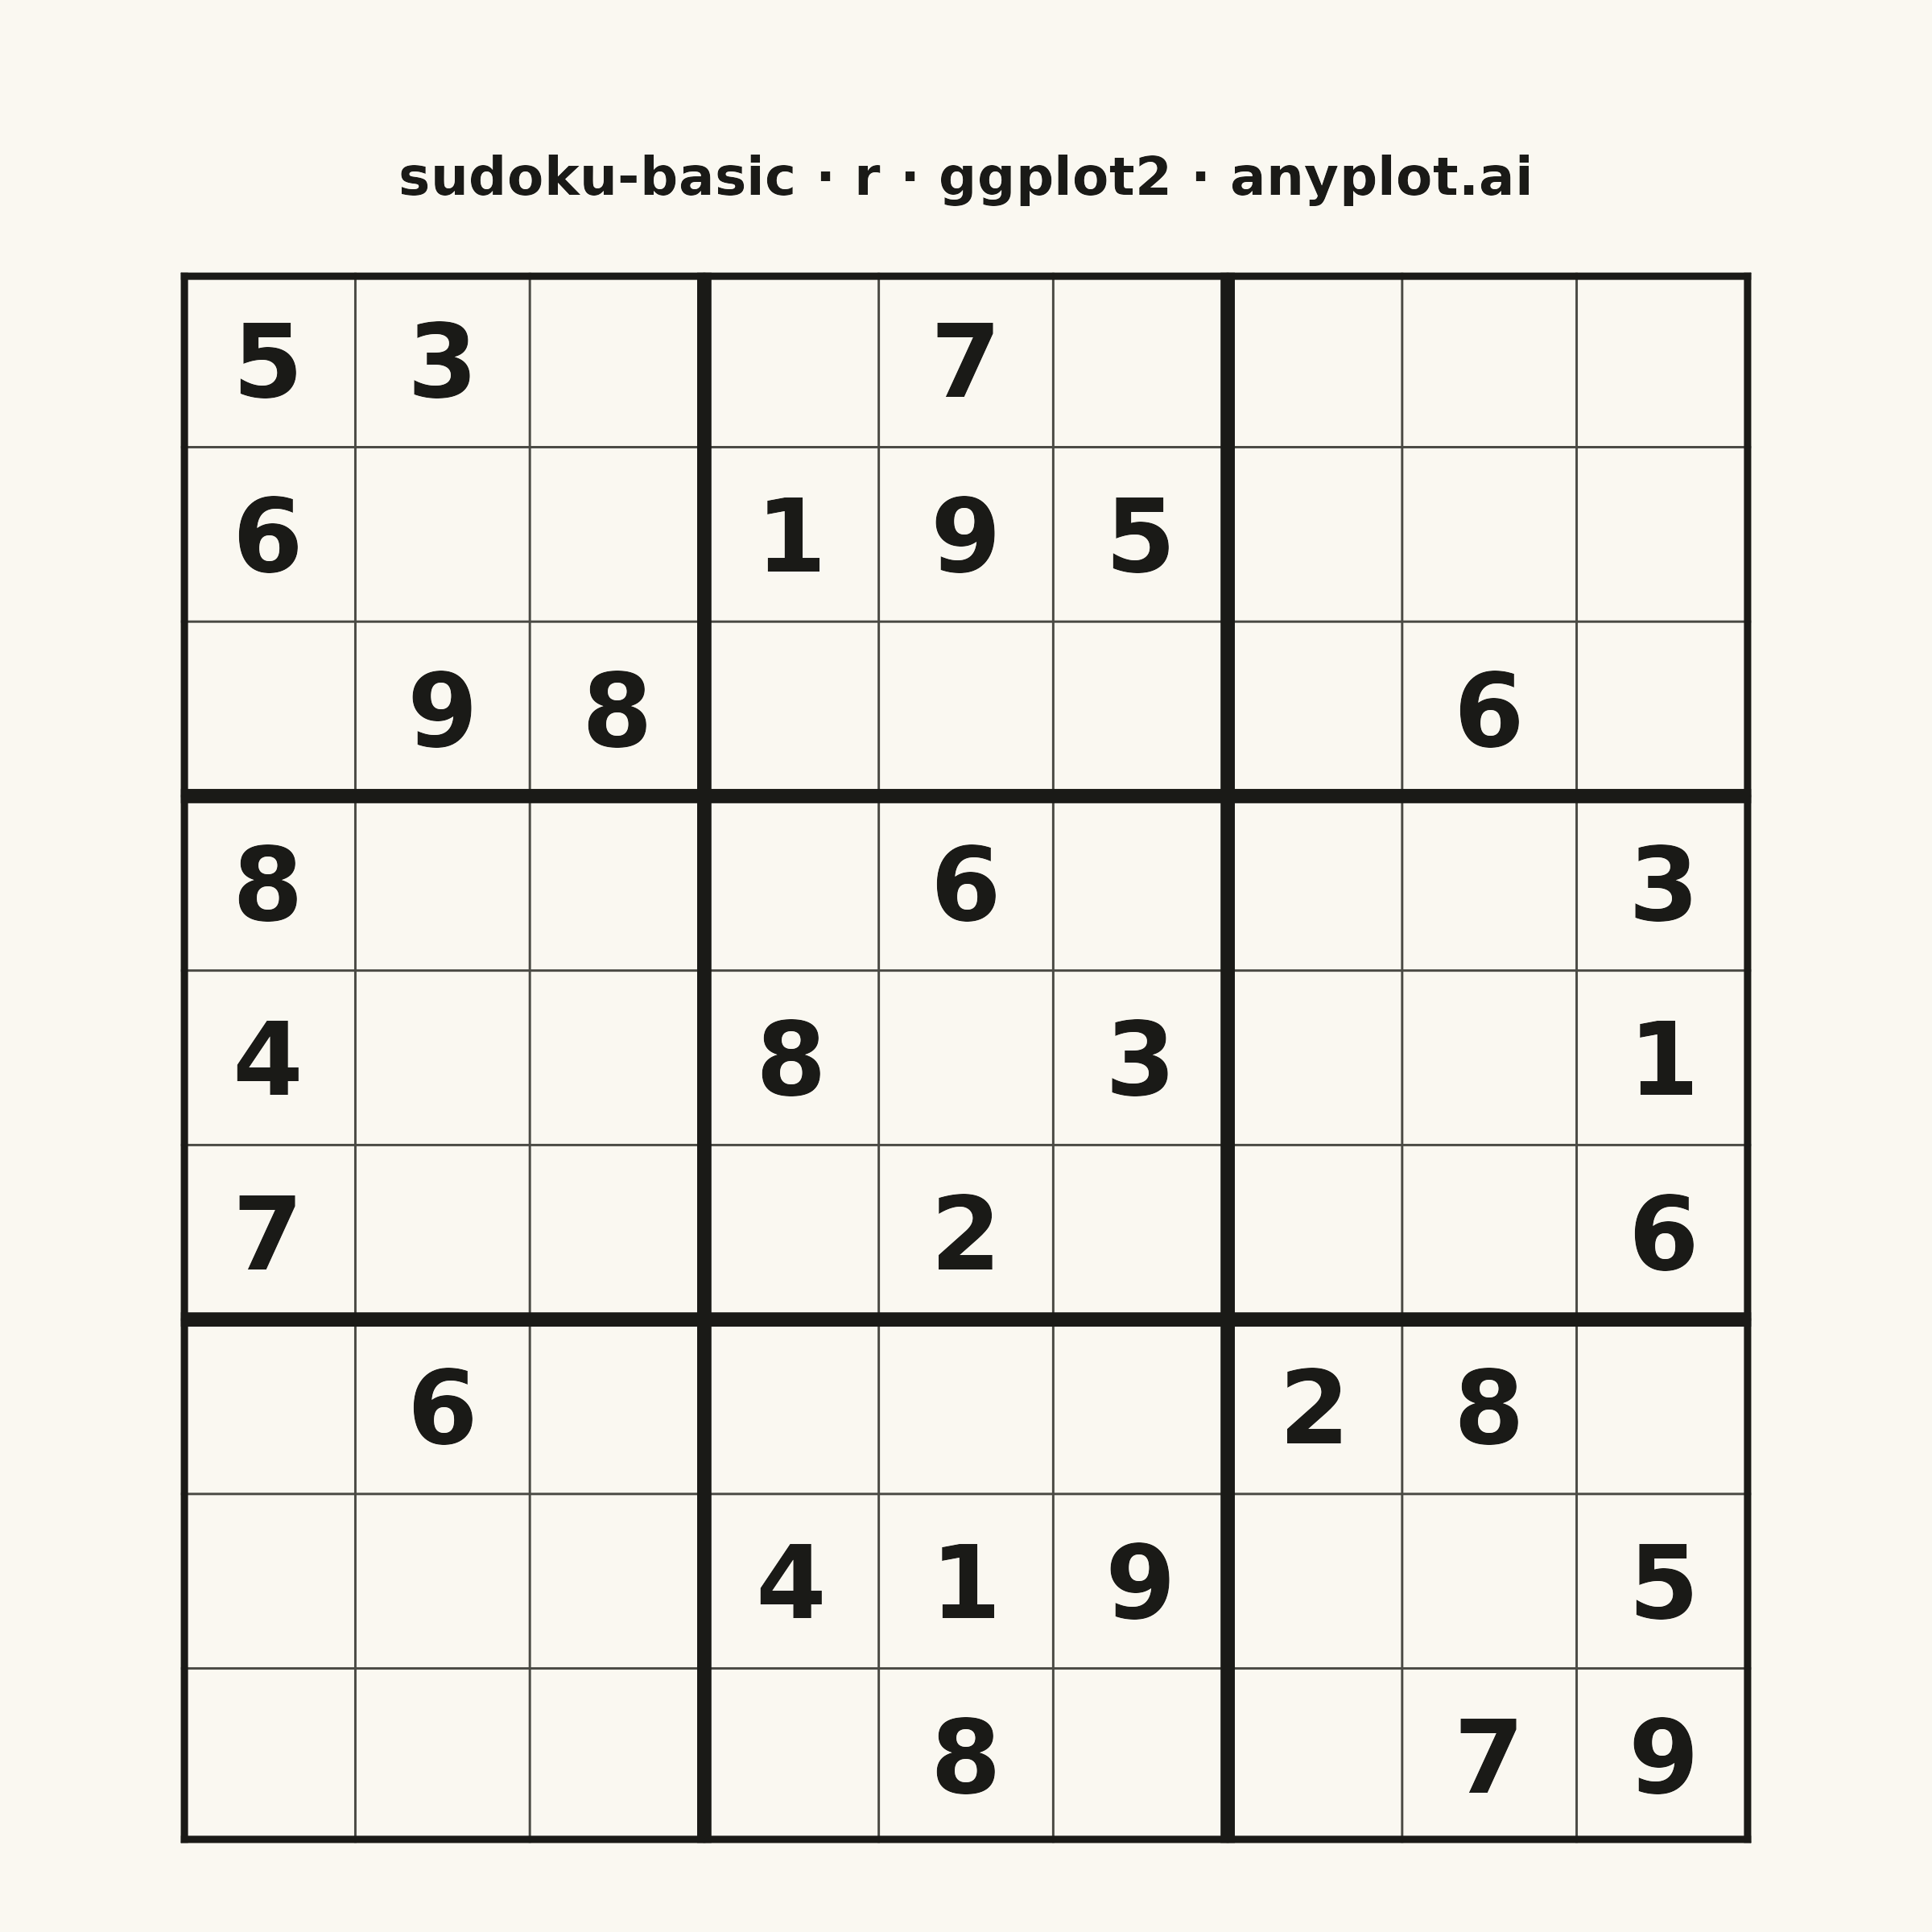
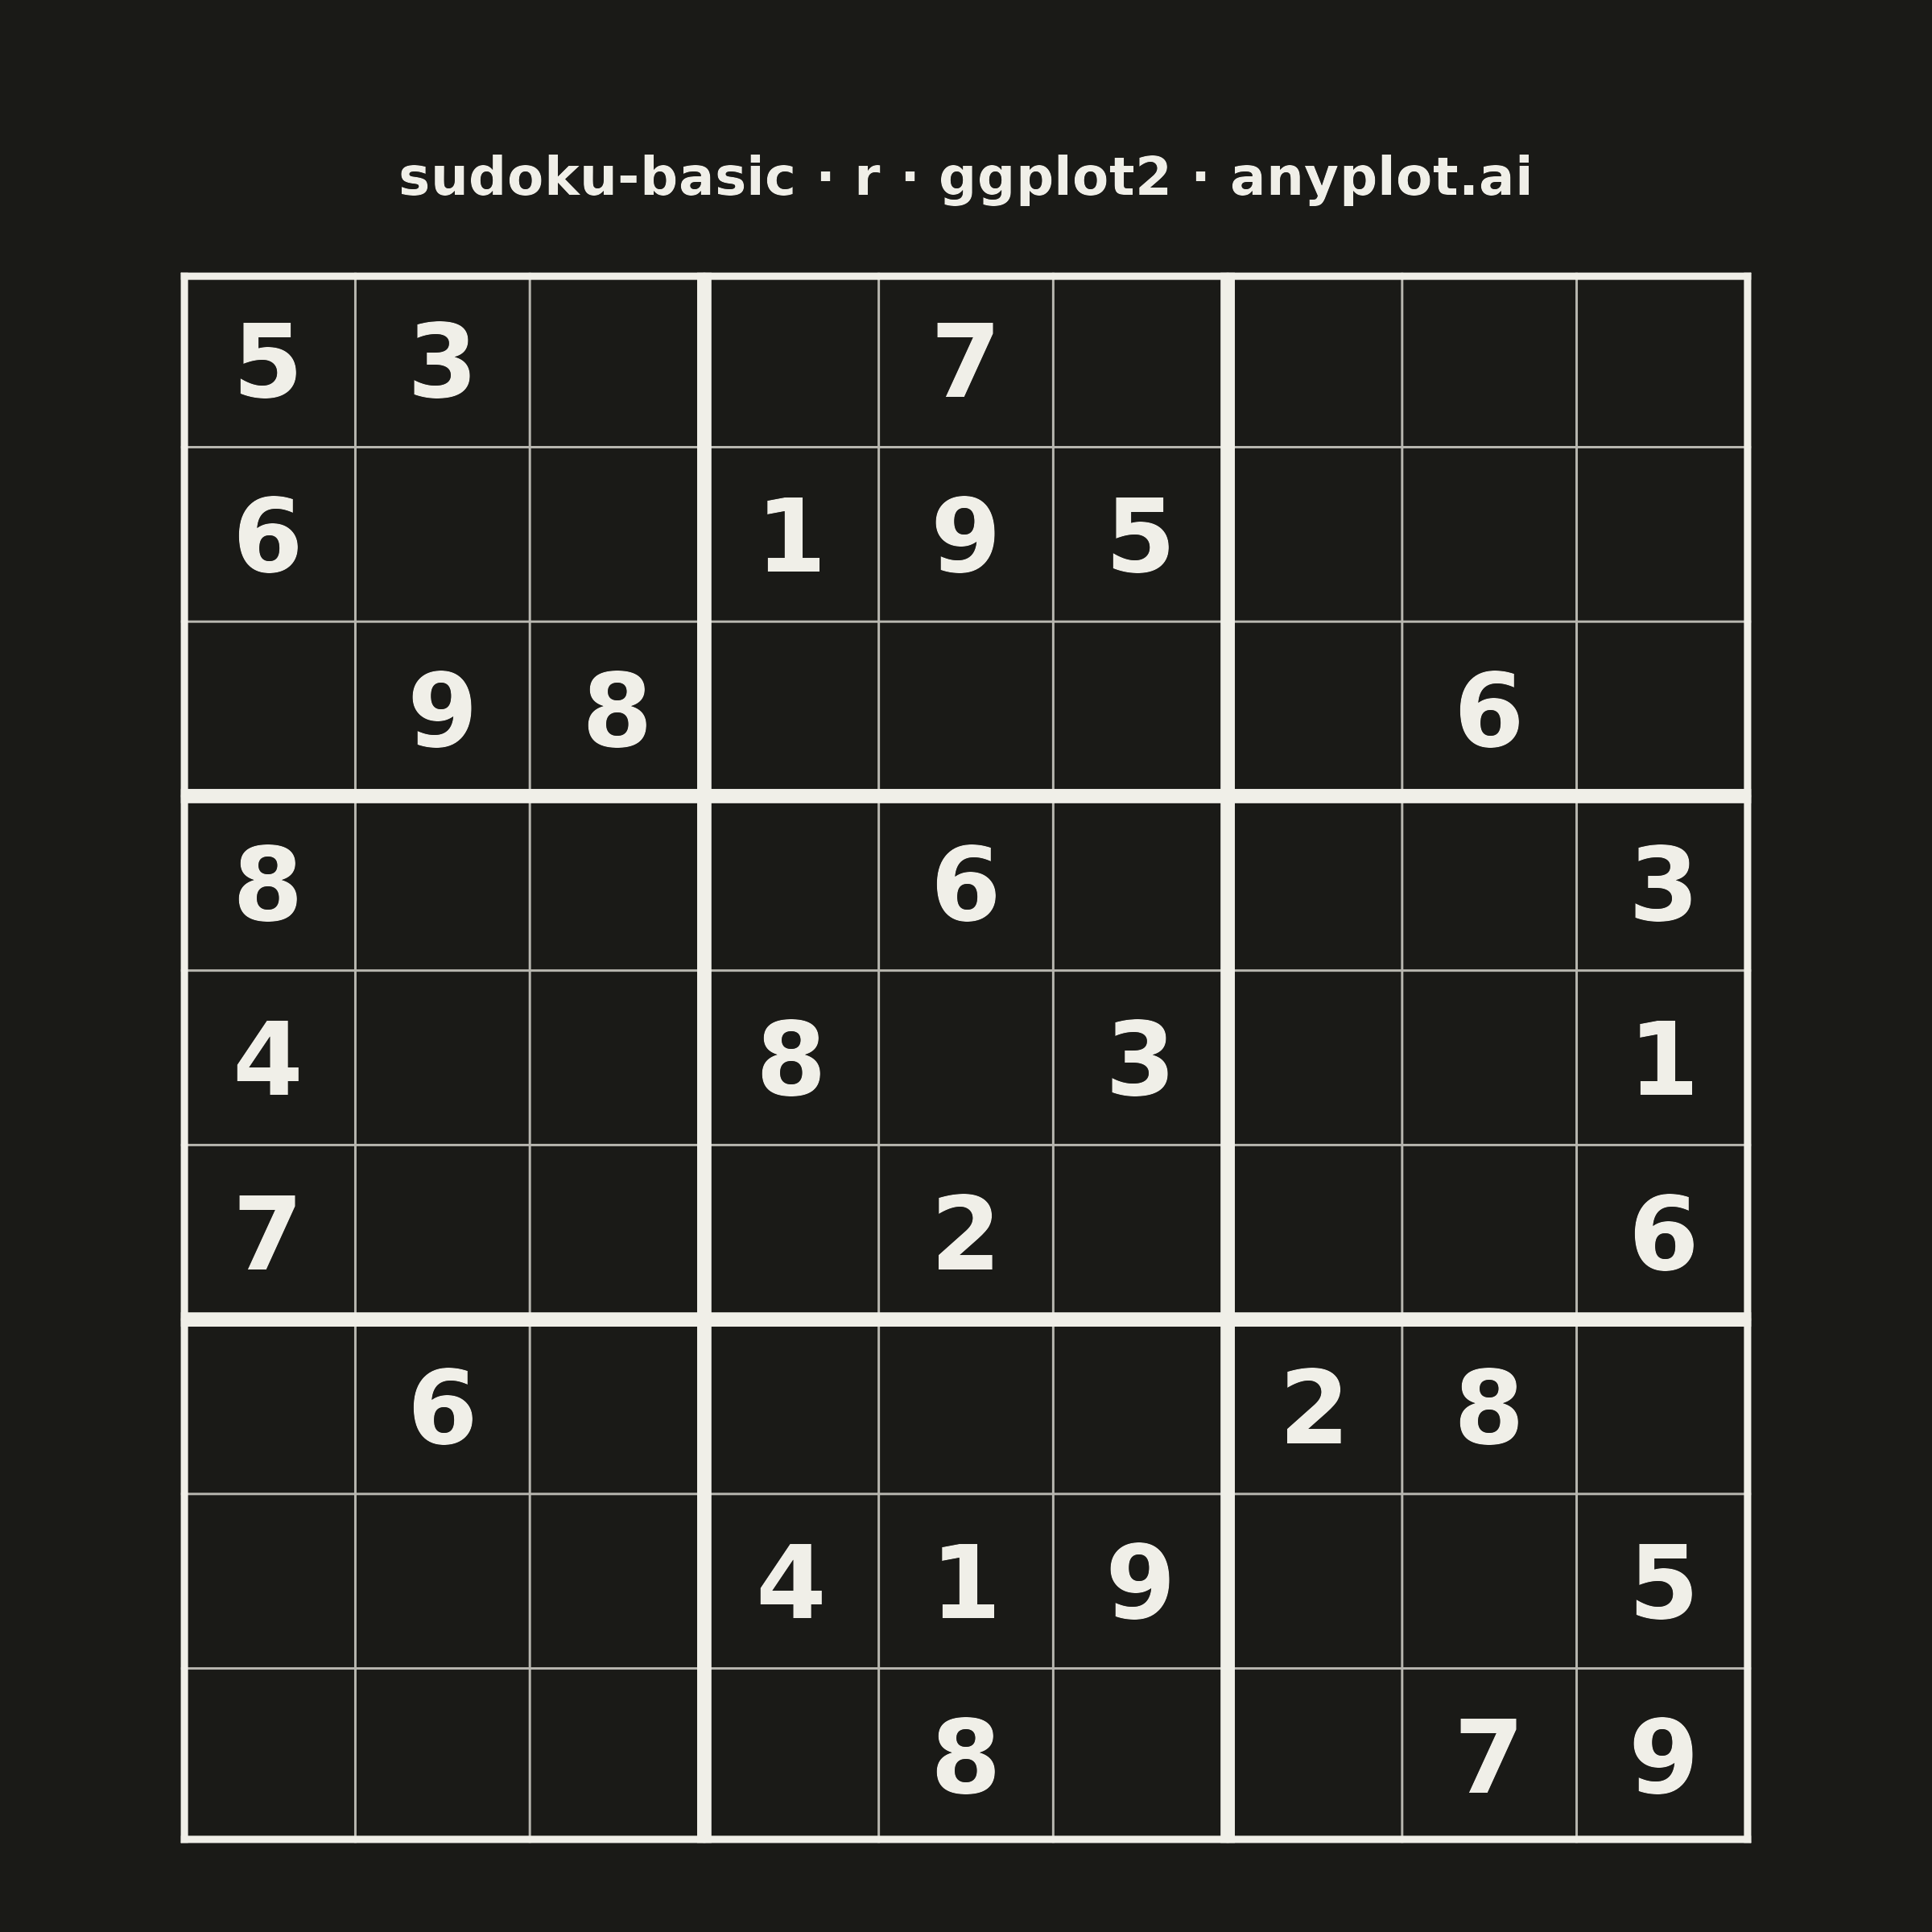
A standard 9×9 Sudoku grid with proper visual hierarchy showing 3×3 box regions. Thick lines separate the nine boxes while thin lines divide individual cells. The clean black-and-white design is optimized for printing and solving puzzles.
#' anyplot.ai
#' sudoku-basic: Basic Sudoku Grid
#' Library: ggplot2 3.5.1 | R 4.4.1
#' Quality: 88/100 | Created: 2026-06-25

library(ggplot2)
library(ragg)

# Theme tokens
THEME       <- Sys.getenv("ANYPLOT_THEME", "light")
PAGE_BG     <- if (THEME == "light") "#FAF8F1" else "#1A1A17"
INK         <- if (THEME == "light") "#1A1A17" else "#F0EFE8"
INK_SOFT    <- if (THEME == "light") "#4A4A44" else "#B8B7B0"

# Sudoku puzzle data (0 = empty cell, classic starter puzzle)
puzzle <- matrix(c(
  5, 3, 0, 0, 7, 0, 0, 0, 0,
  6, 0, 0, 1, 9, 5, 0, 0, 0,
  0, 9, 8, 0, 0, 0, 0, 6, 0,
  8, 0, 0, 0, 6, 0, 0, 0, 3,
  4, 0, 0, 8, 0, 3, 0, 0, 1,
  7, 0, 0, 0, 2, 0, 0, 0, 6,
  0, 6, 0, 0, 0, 0, 2, 8, 0,
  0, 0, 0, 4, 1, 9, 0, 0, 5,
  0, 0, 0, 0, 8, 0, 0, 7, 9
), nrow = 9, ncol = 9, byrow = TRUE)

# Build cell data frame: col (1=left to 9=right), y flipped so row 1 is at top
cells       <- expand.grid(col = 1:9, row = 1:9)
cells$value <- as.vector(t(puzzle))
cells$label <- ifelse(cells$value == 0L, "", as.character(cells$value))
cells$y     <- 10L - cells$row
filled      <- cells[cells$label != "", ]

# Grid line positions
all_pos <- seq(0.5, 9.5, by = 1)       # all 10 boundary positions (thin lines)
box_pos <- c(0.5, 3.5, 6.5, 9.5)       # 3x3 box boundary positions (thick lines)

thin_v  <- data.frame(x = all_pos, xend = all_pos, y = 0.5,     yend = 9.5)
thin_h  <- data.frame(x = 0.5,    xend = 9.5,      y = all_pos, yend = all_pos)
thick_v <- data.frame(x = box_pos, xend = box_pos,  y = 0.5,    yend = 9.5)
thick_h <- data.frame(x = 0.5,    xend = 9.5,       y = box_pos, yend = box_pos)

plot_title <- "sudoku-basic · r · ggplot2 · anyplot.ai"

p <- ggplot() +
  # Grid background fill
  annotate("rect",
           xmin = 0.5, xmax = 9.5, ymin = 0.5, ymax = 9.5,
           fill = PAGE_BG, color = NA) +
  # Thin individual cell lines
  geom_segment(data = thin_v,
               aes(x = x, xend = xend, y = y, yend = yend),
               color = INK_SOFT, linewidth = 0.25) +
  geom_segment(data = thin_h,
               aes(x = x, xend = xend, y = y, yend = yend),
               color = INK_SOFT, linewidth = 0.25) +
  # Thick 3x3 box boundary lines drawn on top
  geom_segment(data = thick_v,
               aes(x = x, xend = xend, y = y, yend = yend),
               color = INK, linewidth = 1.5) +
  geom_segment(data = thick_h,
               aes(x = x, xend = xend, y = y, yend = yend),
               color = INK, linewidth = 1.5) +
  # Puzzle numbers centered in each cell
  geom_text(data = filled,
            aes(x = col, y = y, label = label),
            color = INK, size = 8, fontface = "bold") +
  # 1:1 aspect ratio, exact bounds, no expansion padding
  coord_fixed(ratio = 1, xlim = c(0.5, 9.5), ylim = c(0.5, 9.5), expand = FALSE) +
  labs(title = plot_title) +
  theme_void() +
  theme(
    plot.background  = element_rect(fill = PAGE_BG, color = PAGE_BG),
    panel.background = element_rect(fill = PAGE_BG, color = NA),
    plot.title = element_text(
      color = INK, size = 12, hjust = 0.5, face = "bold",
      margin = margin(t = 15, b = 15)
    ),
    plot.margin = margin(20, 40, 20, 40)
  )

# Save — square canvas: 6x6 in at 400 dpi = 2400x2400 px
ggsave(
  filename = sprintf("plot-%s.png", THEME),
  plot     = p,
  device   = ragg::agg_png,
  width    = 6,
  height   = 6,
  units    = "in",
  dpi      = 400
)
Runnable source as JSON, for any HTTP client: https://api.anyplot.ai/specs/sudoku-basic/ggplot2/code. Any spec id and library id listed in llms-full.txt fit the same URL shape; every URL below is complete and callable.
{
  "spec_id": "sudoku-basic",
  "language": "r",
  "library": "ggplot2",
  "page": "https://anyplot.ai/sudoku-basic/r/ggplot2",
  "hub": "https://anyplot.ai/sudoku-basic",
  "code_json": "https://api.anyplot.ai/specs/sudoku-basic/ggplot2/code",
  "spec_json": "https://api.anyplot.ai/specs/sudoku-basic",
  "render_light_png": "https://storage.googleapis.com/anyplot-images/plots/sudoku-basic/r/ggplot2/plot-light.png",
  "render_dark_png": "https://storage.googleapis.com/anyplot-images/plots/sudoku-basic/r/ggplot2/plot-dark.png",
  "quality_score": 88.0,
  "license": "MIT",
  "guide": "https://anyplot.ai/llms.txt"
}
Part of Basic Sudoku Grid on anyplot.ai.