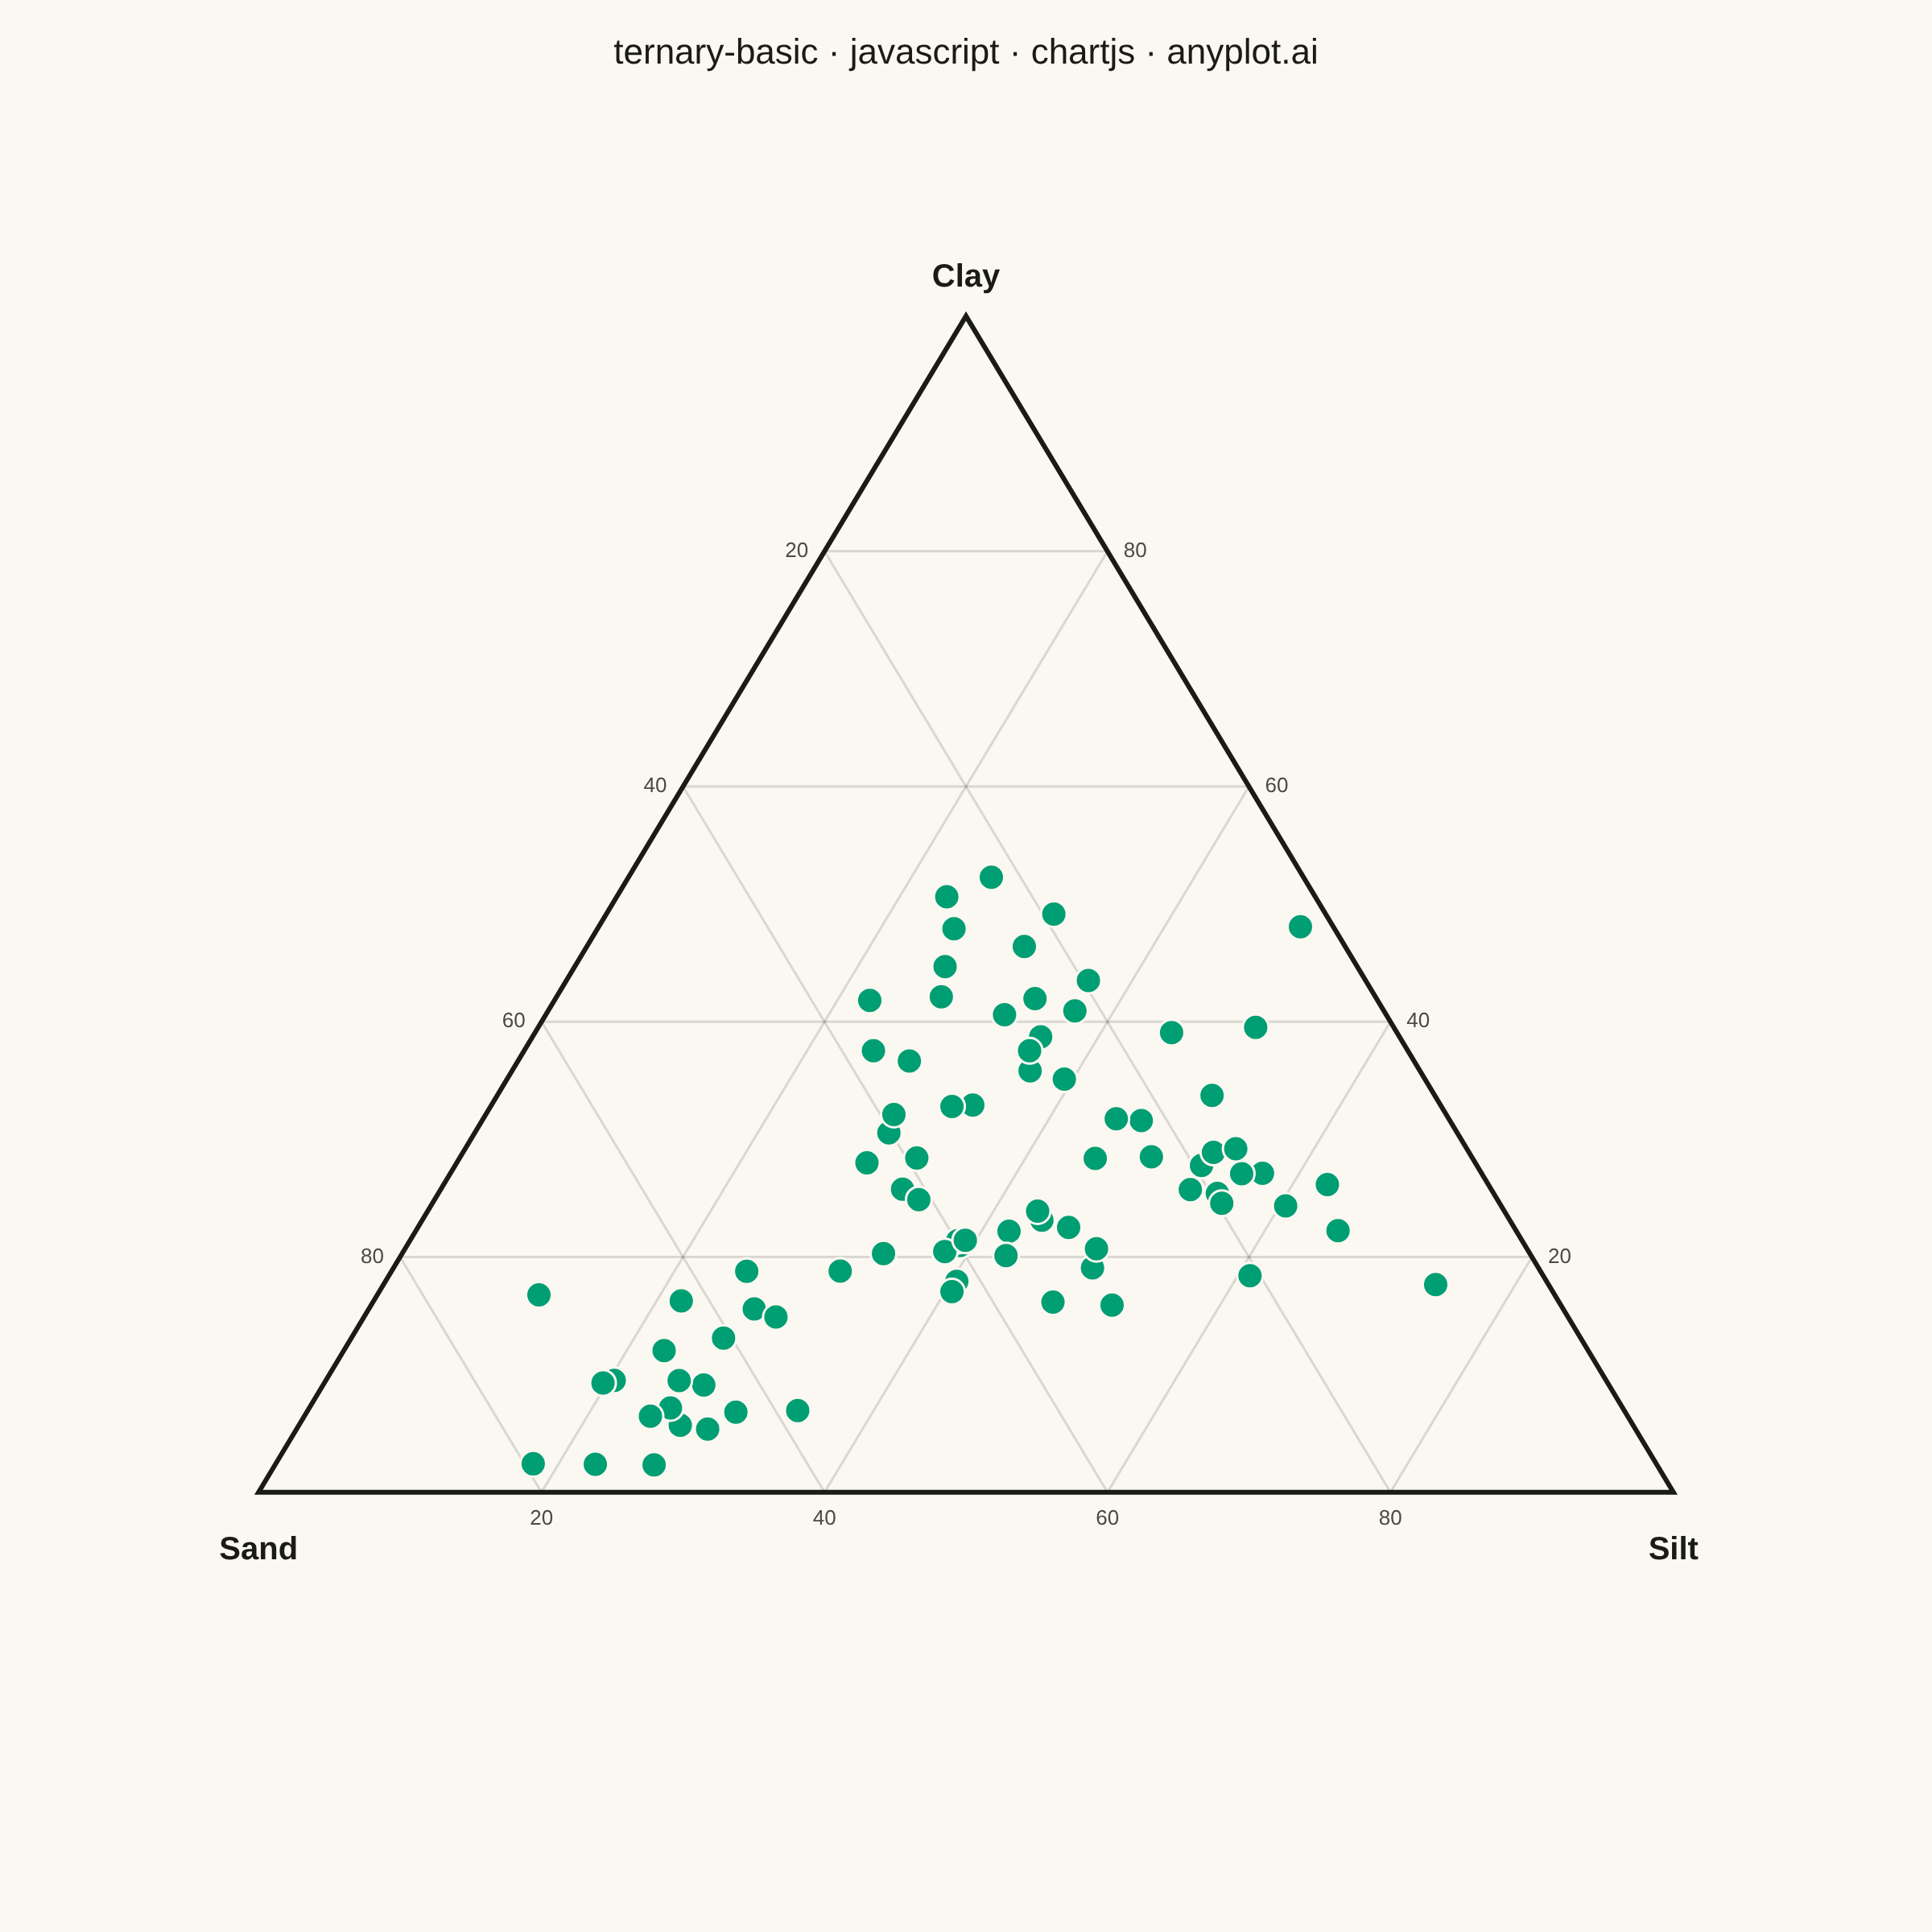
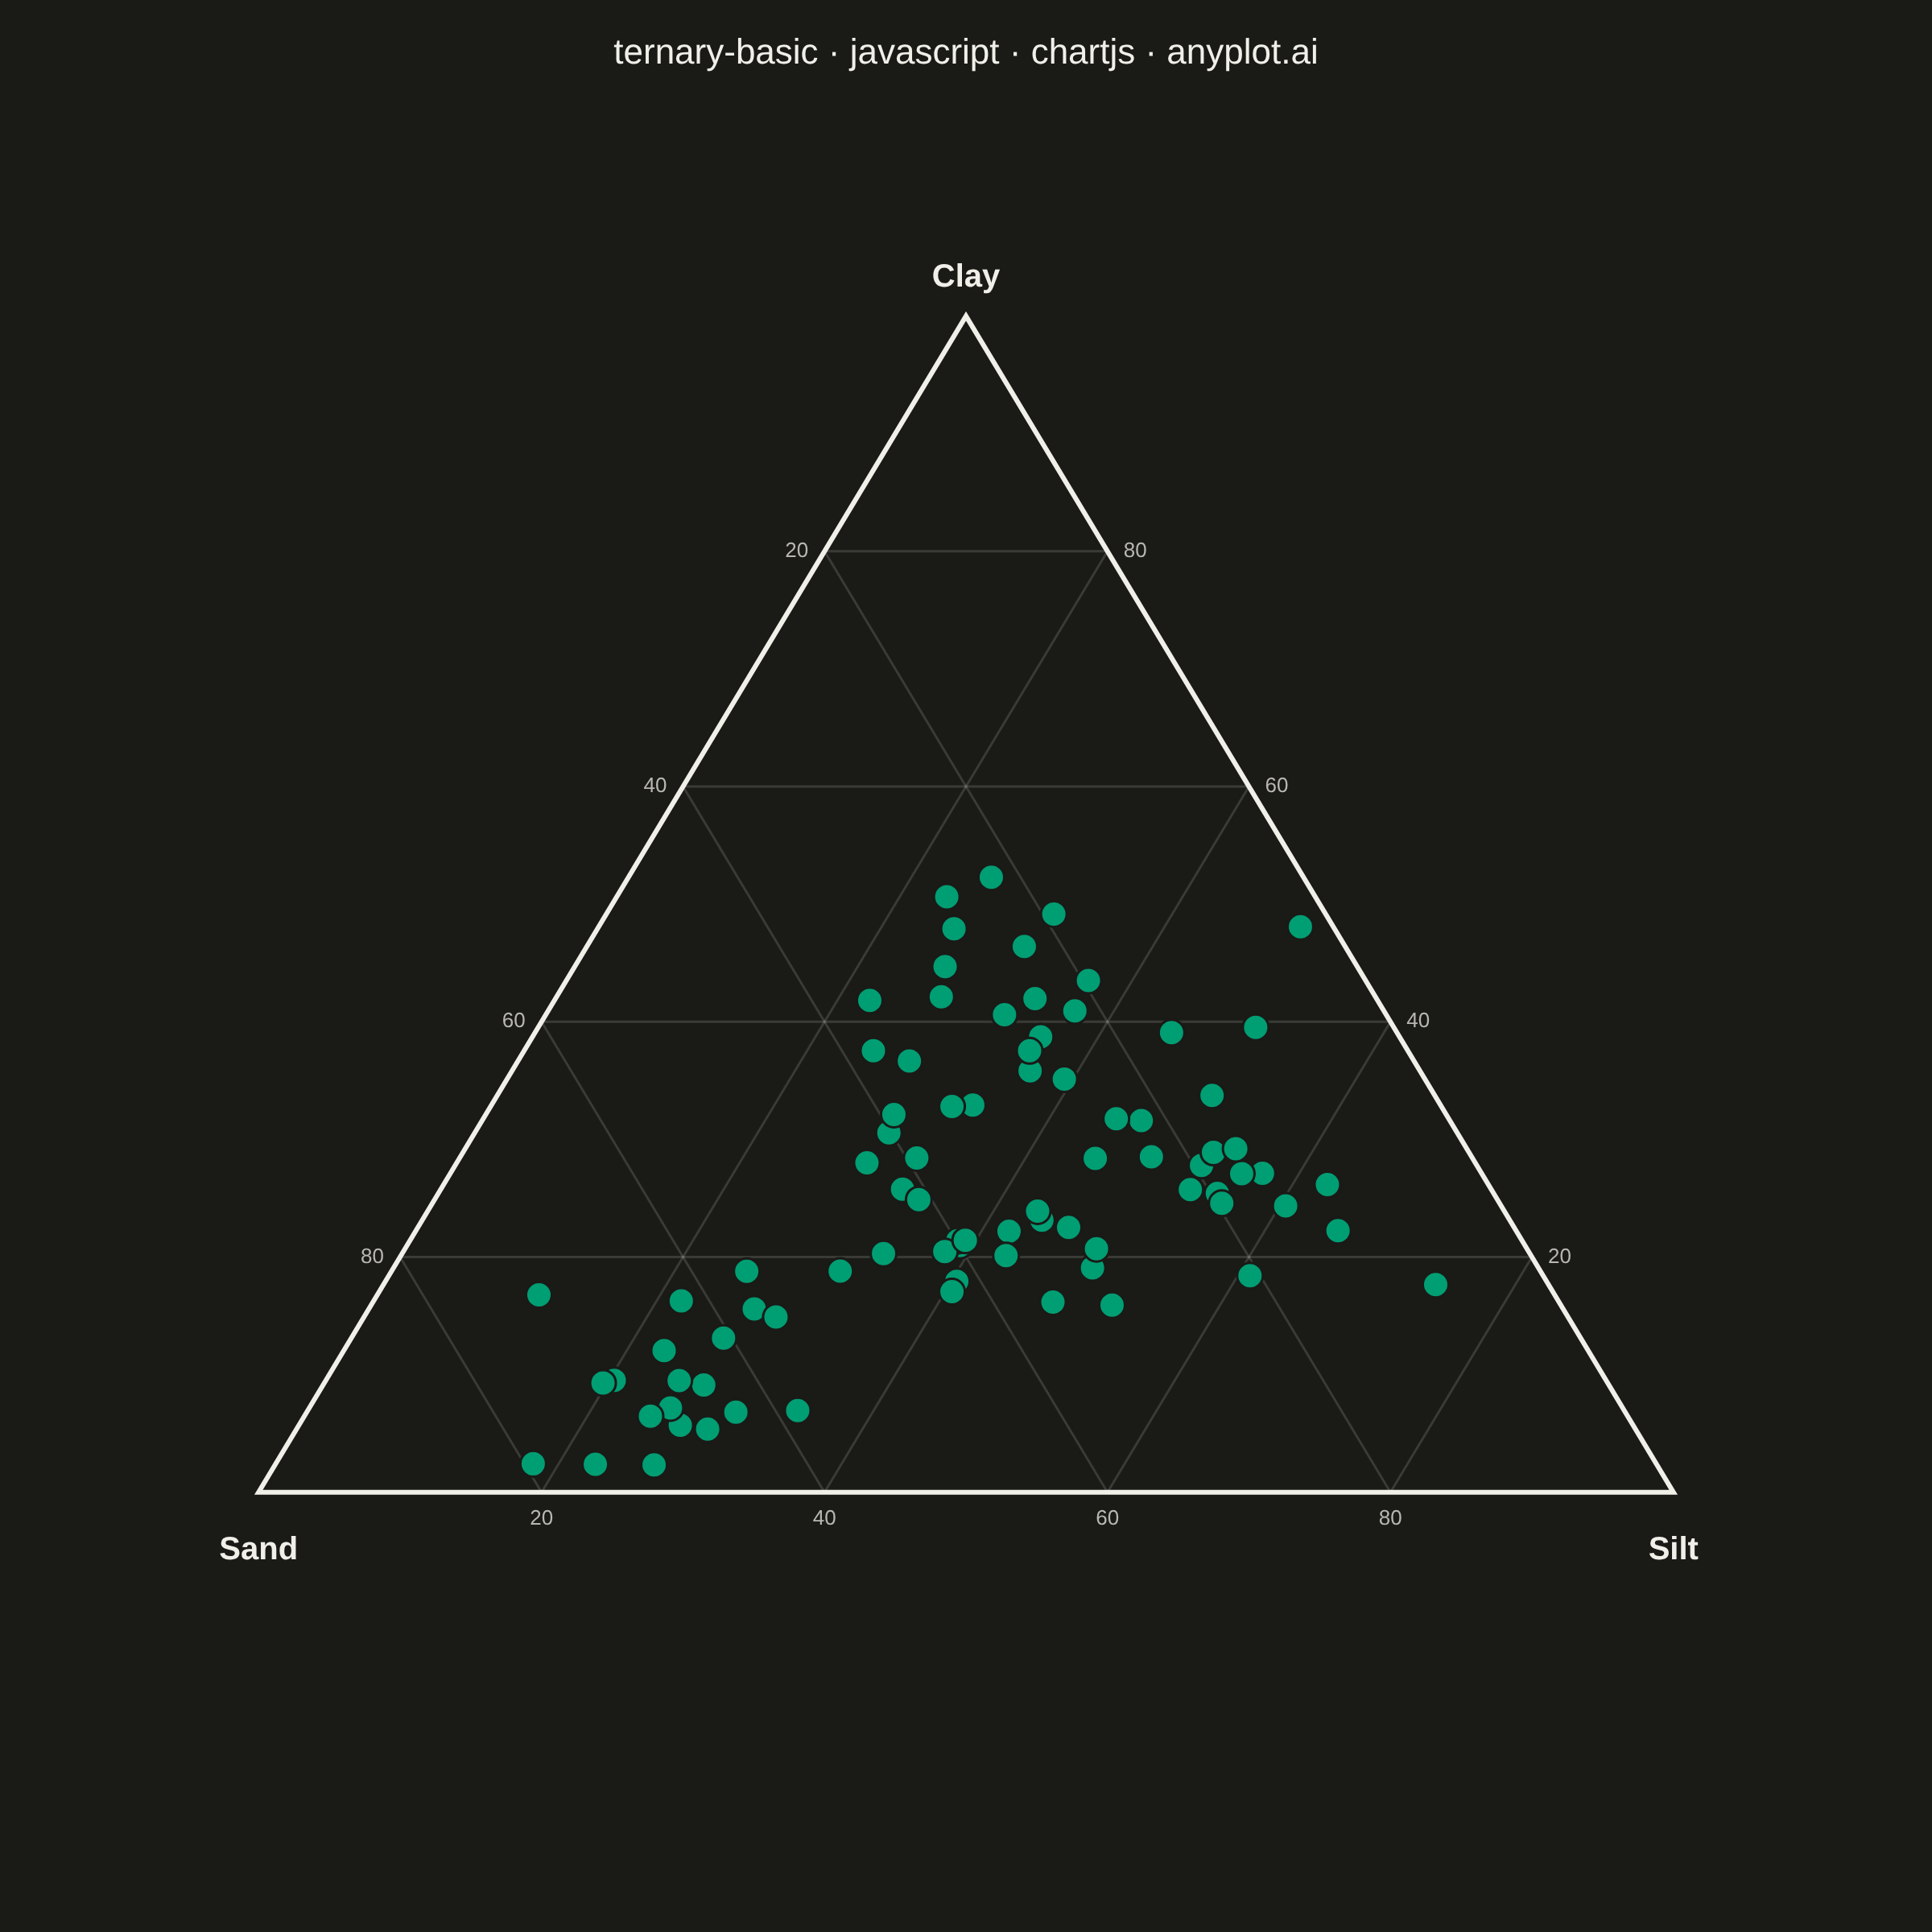
A ternary plot displays three-component compositional data on an equilateral triangle where each vertex represents 100% of one component. Points inside the triangle show compositions that sum to a constant total (usually 100%), with position indicating relative proportions. This visualization is essential for data where three variables are interdependent and constrained to sum to a fixed value.
// anyplot.ai
// ternary-basic: Basic Ternary Plot
// Library: chartjs 4.4.7 | JavaScript 22.23.1
// Quality: 92/100 | Created: 2026-08-04

//# anyplot-orientation: square
const t = window.ANYPLOT_TOKENS;

// --- Data (in-memory, deterministic) ----------------------------------------
// Soil texture samples (sand / silt / clay %, each triplet sums to 100) drawn
// from four notional field sites so the cloud shows realistic clustering
// rather than a uniform smear across the simplex.
let seed = 42;
function rand() {
  seed = (seed * 1664525 + 1013904223) % 4294967296;
  return seed / 4294967296;
}
function gaussian() {
  const u1 = Math.max(rand(), 1e-6);
  const u2 = rand();
  return Math.sqrt(-2 * Math.log(u1)) * Math.cos(2 * Math.PI * u2);
}

const SITES = [
  { sand: 65, silt: 25, clay: 10 },
  { sand: 40, silt: 40, clay: 20 },
  { sand: 15, silt: 55, clay: 30 },
  { sand: 30, silt: 30, clay: 40 },
];

const samples = [];
SITES.forEach((site) => {
  for (let i = 0; i < 21; i++) {
    const sand = Math.max(2, site.sand + gaussian() * 7);
    const silt = Math.max(2, site.silt + gaussian() * 7);
    const clay = Math.max(2, site.clay + gaussian() * 7);
    const total = sand + silt + clay;
    samples.push({
      sand: (sand / total) * 100,
      silt: (silt / total) * 100,
      clay: (clay / total) * 100,
    });
  }
});

// --- Ternary <-> Cartesian projection ---------------------------------------
// Equilateral triangle: sand at (0,0), silt at (1,0), clay at (0.5, sqrt(3)/2).
const SQRT3_2 = Math.sqrt(3) / 2;
function ternaryToXY(sandFrac, siltFrac, clayFrac) {
  return { x: siltFrac + 0.5 * clayFrac, y: clayFrac * SQRT3_2 };
}
const VERTEX_SAND = ternaryToXY(1, 0, 0);
const VERTEX_SILT = ternaryToXY(0, 1, 0);
const VERTEX_CLAY = ternaryToXY(0, 0, 1);
const GRID_STEPS = [0.2, 0.4, 0.6, 0.8];

function drawLine(ctx, toPx, toPy, p1, p2) {
  ctx.beginPath();
  ctx.moveTo(toPx(p1), toPy(p1));
  ctx.lineTo(toPx(p2), toPy(p2));
  ctx.stroke();
}

// --- Custom plugin: triangle frame, 20% grid, vertex + tick labels ---------
const ternaryFramePlugin = {
  id: "ternaryFrame",
  beforeDatasetsDraw(chart) {
    const { ctx, scales } = chart;
    const toPx = (p) => scales.x.getPixelForValue(p.x);
    const toPy = (p) => scales.y.getPixelForValue(p.y);

    ctx.save();
    ctx.strokeStyle = t.grid;
    ctx.lineWidth = 1.5;
    GRID_STEPS.forEach((v) => {
      drawLine(ctx, toPx, toPy, ternaryToXY(v, 1 - v, 0), ternaryToXY(v, 0, 1 - v));
      drawLine(ctx, toPx, toPy, ternaryToXY(1 - v, v, 0), ternaryToXY(0, v, 1 - v));
      drawLine(ctx, toPx, toPy, ternaryToXY(1 - v, 0, v), ternaryToXY(0, 1 - v, v));
    });

    ctx.strokeStyle = t.ink;
    ctx.lineWidth = 3;
    ctx.beginPath();
    ctx.moveTo(toPx(VERTEX_SAND), toPy(VERTEX_SAND));
    ctx.lineTo(toPx(VERTEX_SILT), toPy(VERTEX_SILT));
    ctx.lineTo(toPx(VERTEX_CLAY), toPy(VERTEX_CLAY));
    ctx.closePath();
    ctx.stroke();
    ctx.restore();
  },
  afterDraw(chart) {
    const { ctx, scales } = chart;
    const toPx = (p) => scales.x.getPixelForValue(p.x);
    const toPy = (p) => scales.y.getPixelForValue(p.y);

    ctx.save();
    ctx.font = "13px sans-serif";
    ctx.fillStyle = t.inkSoft;
    GRID_STEPS.forEach((v) => {
      const pct = String(Math.round(v * 100));

      ctx.textAlign = "right";
      ctx.textBaseline = "middle";
      const sandPt = ternaryToXY(v, 0, 1 - v);
      ctx.fillText(pct, toPx(sandPt) - 10, toPy(sandPt));

      ctx.textAlign = "center";
      ctx.textBaseline = "top";
      const siltPt = ternaryToXY(1 - v, v, 0);
      ctx.fillText(pct, toPx(siltPt), toPy(siltPt) + 10);

      ctx.textAlign = "left";
      ctx.textBaseline = "middle";
      const clayPt = ternaryToXY(0, 1 - v, v);
      ctx.fillText(pct, toPx(clayPt) + 10, toPy(clayPt));
    });

    ctx.font = "600 20px sans-serif";
    ctx.fillStyle = t.ink;
    ctx.textAlign = "center";
    ctx.textBaseline = "top";
    ctx.fillText("Sand", toPx(VERTEX_SAND), toPy(VERTEX_SAND) + 26);
    ctx.fillText("Silt", toPx(VERTEX_SILT), toPy(VERTEX_SILT) + 26);
    ctx.textBaseline = "bottom";
    ctx.fillText("Clay", toPx(VERTEX_CLAY), toPy(VERTEX_CLAY) - 14);
    ctx.restore();
  },
};

// --- Mount -------------------------------------------------------------------
const canvas = document.createElement("canvas");
document.getElementById("container").appendChild(canvas);

// --- Chart ---------------------------------------------------------------
new Chart(canvas, {
  type: "scatter",
  data: {
    datasets: [
      {
        label: "Soil sample",
        data: samples.map((s) => ternaryToXY(s.sand / 100, s.silt / 100, s.clay / 100)),
        backgroundColor: t.palette[0],
        borderColor: t.pageBg,
        borderWidth: 1.5,
        pointRadius: 8,
        pointHoverRadius: 8,
      },
    ],
  },
  options: {
    responsive: true,
    maintainAspectRatio: false,
    animation: false,
    layout: { padding: 20 },
    plugins: {
      title: {
        display: true,
        text: "ternary-basic · javascript · chartjs · anyplot.ai",
        color: t.ink,
        font: { size: 22, weight: "500" },
        padding: { bottom: 20 },
      },
      legend: { display: false },
      tooltip: {
        enabled: true,
        callbacks: {
          title: () => "",
          label: (ctx) => {
            const s = samples[ctx.dataIndex];
            return `Sand ${s.sand.toFixed(1)}% · Silt ${s.silt.toFixed(1)}% · Clay ${s.clay.toFixed(1)}%`;
          },
        },
      },
    },
    scales: {
      x: { type: "linear", min: -0.16, max: 1.16, display: false },
      y: { type: "linear", min: -0.3, max: 1.02, display: false },
    },
  },
  plugins: [ternaryFramePlugin],
});
Runnable source as JSON, for any HTTP client: https://api.anyplot.ai/specs/ternary-basic/chartjs/code. Any spec id and library id listed in llms-full.txt fit the same URL shape; every URL below is complete and callable.
{
  "spec_id": "ternary-basic",
  "language": "javascript",
  "library": "chartjs",
  "page": "https://anyplot.ai/ternary-basic/javascript/chartjs",
  "hub": "https://anyplot.ai/ternary-basic",
  "code_json": "https://api.anyplot.ai/specs/ternary-basic/chartjs/code",
  "spec_json": "https://api.anyplot.ai/specs/ternary-basic",
  "render_light_png": "https://storage.googleapis.com/anyplot-images/plots/ternary-basic/javascript/chartjs/plot-light.png",
  "render_dark_png": "https://storage.googleapis.com/anyplot-images/plots/ternary-basic/javascript/chartjs/plot-dark.png",
  "interactive_light_html": "https://storage.googleapis.com/anyplot-images/plots/ternary-basic/javascript/chartjs/plot-light.html",
  "interactive_dark_html": "https://storage.googleapis.com/anyplot-images/plots/ternary-basic/javascript/chartjs/plot-dark.html",
  "quality_score": 92.0,
  "license": "MIT",
  "guide": "https://anyplot.ai/llms.txt"
}
Part of Basic Ternary Plot on anyplot.ai.