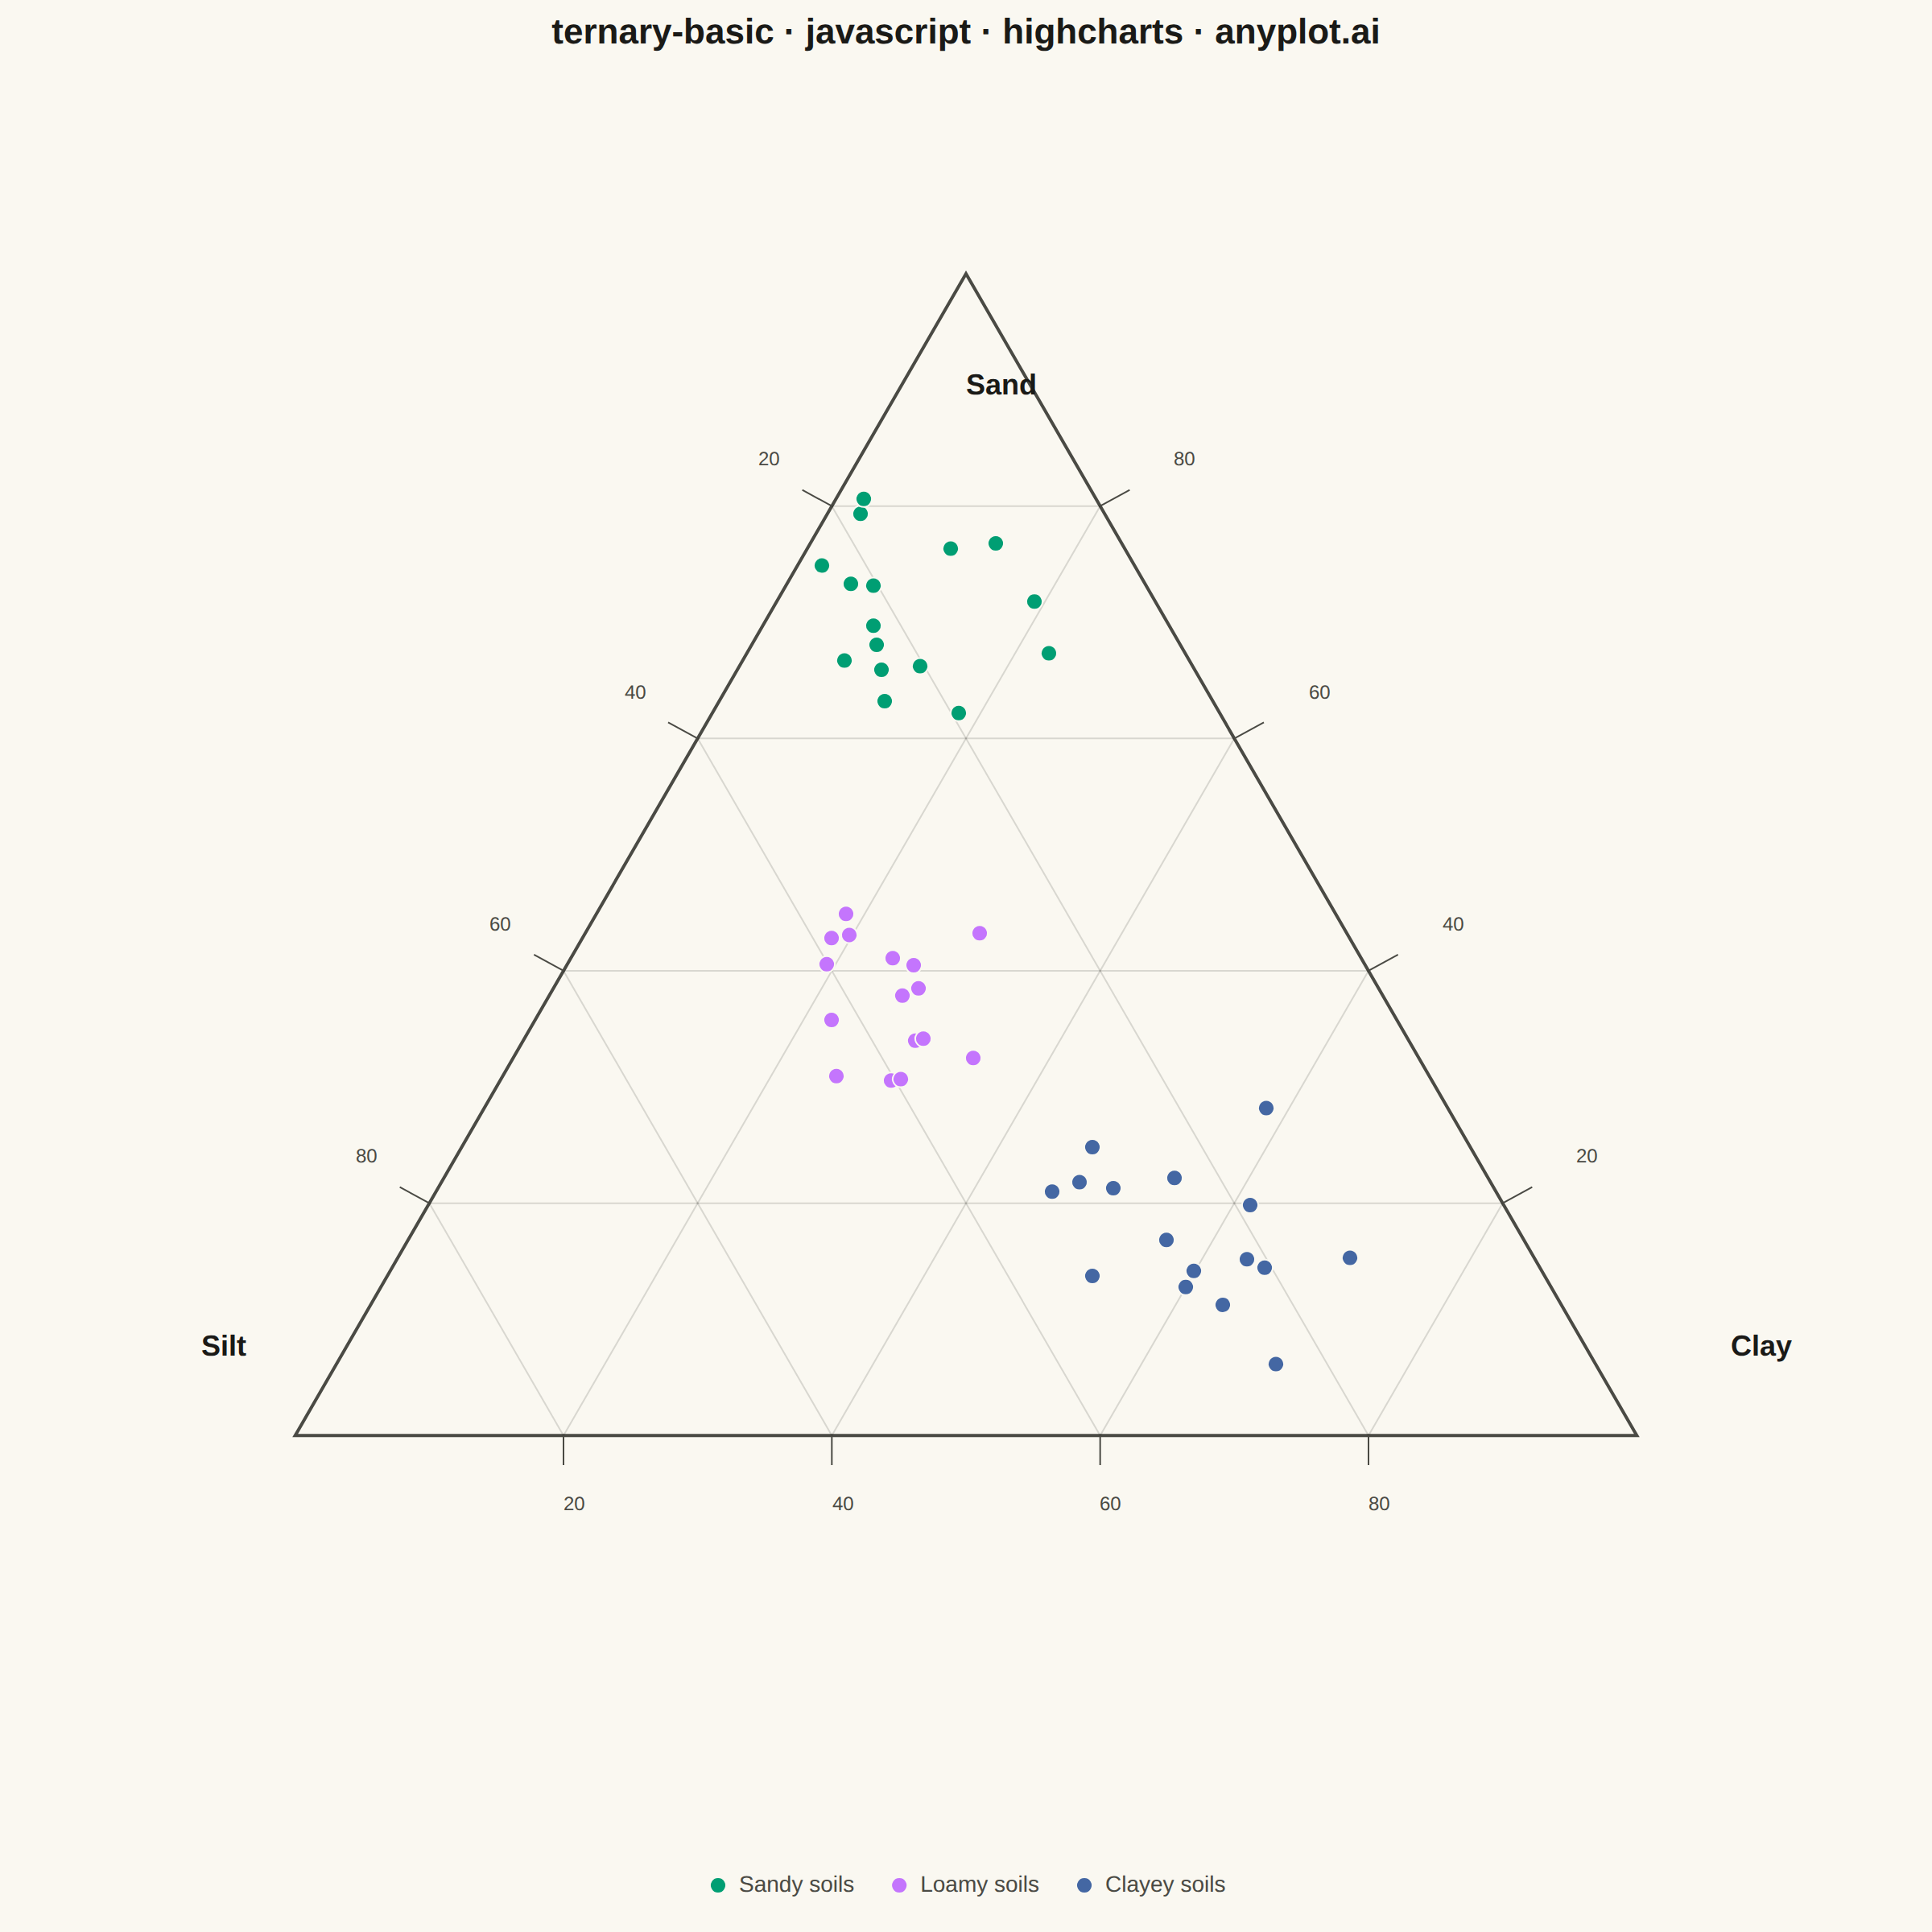
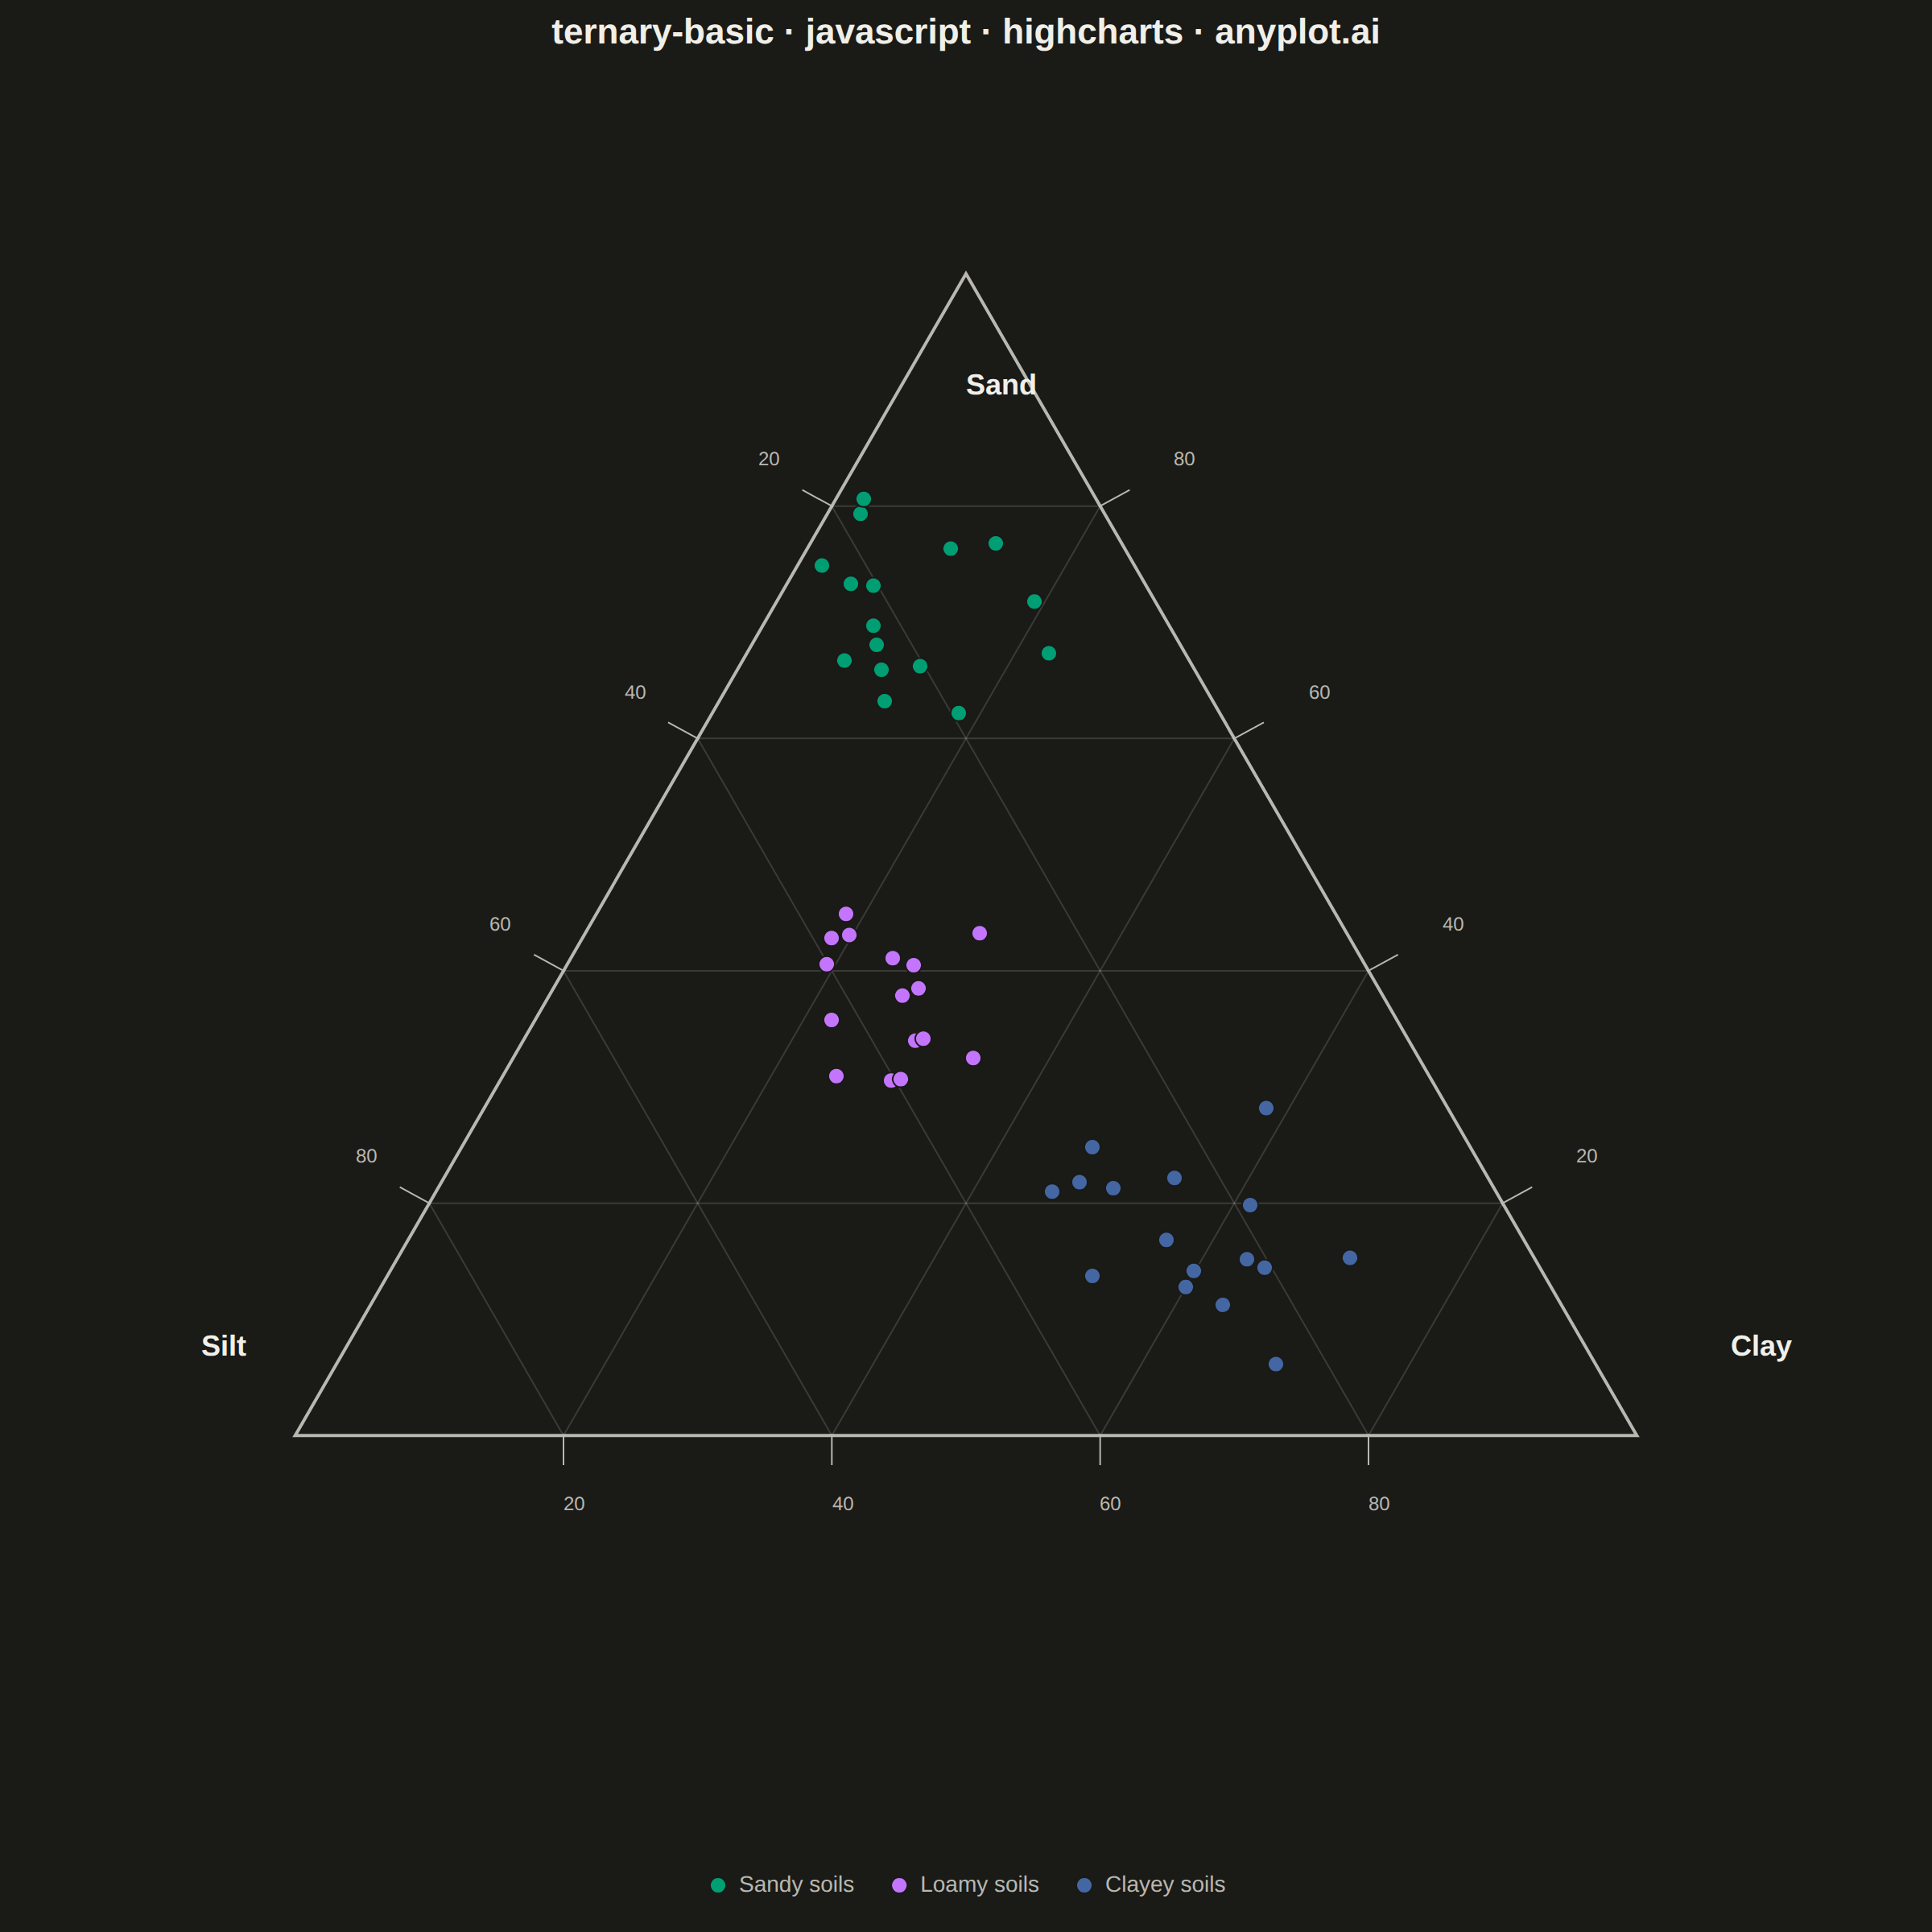
A ternary plot displays three-component compositional data on an equilateral triangle where each vertex represents 100% of one component. Points inside the triangle show compositions that sum to a constant total (usually 100%), with position indicating relative proportions. This visualization is essential for data where three variables are interdependent and constrained to sum to a fixed value.
// anyplot.ai
// ternary-basic: Basic Ternary Plot
// Library: highcharts 12.6.0 | JavaScript 22.23.1
// Quality: 90/100 | Created: 2026-08-04

//# anyplot-orientation: square
const t = window.ANYPLOT_TOKENS;

// --- Data (in-memory, deterministic) ----------------------------------------
// Soil texture samples (USDA-style sand / silt / clay proportions, in %).
// Tiny LCG so the jittered clusters are reproducible without a network RNG.
function makeLcg(seed) {
  let state = seed;
  return () => {
    state = (state * 1664525 + 1013904223) % 4294967296;
    return state / 4294967296;
  };
}
const random = makeLcg(42);

function soilCluster(meanSand, meanSilt, meanClay, count, spread) {
  const samples = [];
  for (let i = 0; i < count; i++) {
    const sand = Math.max(2, meanSand + (random() - 0.5) * spread);
    const silt = Math.max(2, meanSilt + (random() - 0.5) * spread);
    const clay = Math.max(2, meanClay + (random() - 0.5) * spread);
    const total = sand + silt + clay;
    samples.push({ sand: (sand / total) * 100, silt: (silt / total) * 100, clay: (clay / total) * 100 });
  }
  return samples;
}

const sandySoils = soilCluster(72, 18, 10, 16, 24);
const loamySoils = soilCluster(38, 38, 24, 16, 20);
const clayeySoils = soilCluster(16, 24, 60, 16, 24);

// --- Barycentric -> Cartesian transform --------------------------------------
// Equilateral triangle: Sand at the apex, Silt at bottom-left, Clay at bottom-right.
// x = 0.5 * sand_frac + clay_frac, y = sand_frac * TRI_H  (weighted average of the vertices)
const TRI_H = Math.sqrt(3) / 2;

// --- Chart -------------------------------------------------------------------
const PLOT_MARGIN_LR = 100;
const PLOT_MARGIN_TOP = 100;
const PLOT_MARGIN_BOTTOM = 100; // marginTop + marginBottom == 2 * marginLR -> square plot area

Highcharts.chart("container", {
  chart: {
    type: "scatter",
    backgroundColor: "transparent",
    animation: false,
    marginLeft: PLOT_MARGIN_LR,
    marginRight: PLOT_MARGIN_LR,
    marginTop: PLOT_MARGIN_TOP,
    marginBottom: PLOT_MARGIN_BOTTOM,
    style: { fontFamily: "inherit" },
    events: {
      render: function () {
        const chart = this;
        if (chart.ternaryFrame) chart.ternaryFrame.destroy();
        const group = chart.renderer.g("ternary-frame").add();
        chart.ternaryFrame = group;

        const xAxis = chart.xAxis[0];
        const yAxis = chart.yAxis[0];
        const toPx = (x, y) => [xAxis.toPixels(x), yAxis.toPixels(y)];

        const apex = toPx(0.5, TRI_H); // Sand
        const bottomLeft = toPx(0, 0); // Silt
        const bottomRight = toPx(1, 0); // Clay

        // Outer triangle
        chart.renderer
          .path(["M", apex[0], apex[1], "L", bottomRight[0], bottomRight[1], "L", bottomLeft[0], bottomLeft[1], "Z"])
          .attr({ stroke: t.inkSoft, "stroke-width": 2, fill: "none" })
          .add(group);

        // Internal gridlines at 20% composition steps
        [0.2, 0.4, 0.6, 0.8].forEach((k) => {
          const sandLine = [toPx(0.5 * k, k * TRI_H), toPx(1 - 0.5 * k, k * TRI_H)];
          const siltLine = [toPx(1 - k, 0), toPx(0.5 * (1 - k), (1 - k) * TRI_H)];
          const clayLine = [toPx(k, 0), toPx(0.5 + 0.5 * k, (1 - k) * TRI_H)];
          [sandLine, siltLine, clayLine].forEach(([from, to]) => {
            chart.renderer
              .path(["M", from[0], from[1], "L", to[0], to[1]])
              .attr({ stroke: t.grid, "stroke-width": 1 })
              .add(group);
          });
        });

        // Vertex labels
        [
          { text: "Sand", x: 0.5, y: TRI_H, nx: 0, ny: -0.09, anchor: "middle" },
          { text: "Silt", x: 0, y: 0, nx: -0.07, ny: 0.06, anchor: "end" },
          { text: "Clay", x: 1, y: 0, nx: 0.07, ny: 0.06, anchor: "start" },
        ].forEach((v) => {
          const [px, py] = toPx(v.x + v.nx, v.y + v.ny);
          chart.renderer
            .text(v.text, px, py)
            .attr({ align: v.anchor })
            .css({ color: t.ink, fontSize: "18px", fontWeight: "600" })
            .add(group);
        });

        // Edge tick labels (% composition, every 20%) with short outward tick marks
        const edgeTicks = [];
        [0.2, 0.4, 0.6, 0.8].forEach((k) => {
          edgeTicks.push({ x: k, y: 0, nx: 0, ny: -0.055, anchor: "middle", label: Math.round(100 * k) }); // Clay, bottom edge
          edgeTicks.push({
            x: 0.5 * (1 - k),
            y: (1 - k) * TRI_H,
            nx: -0.055,
            ny: 0.03,
            anchor: "end",
            label: Math.round(100 * k),
          }); // Silt, left edge
          edgeTicks.push({
            x: 1 - 0.5 * k,
            y: k * TRI_H,
            nx: 0.055,
            ny: 0.03,
            anchor: "start",
            label: Math.round(100 * k),
          }); // Sand, right edge
        });
        edgeTicks.forEach((tick) => {
          const [tx1, ty1] = toPx(tick.x, tick.y);
          const [tx2, ty2] = toPx(tick.x + tick.nx * 0.4, tick.y + tick.ny * 0.4);
          chart.renderer
            .path(["M", tx1, ty1, "L", tx2, ty2])
            .attr({ stroke: t.inkSoft, "stroke-width": 1 })
            .add(group);
          const [lx, ly] = toPx(tick.x + tick.nx, tick.y + tick.ny);
          chart.renderer
            .text(String(tick.label), lx, ly)
            .attr({ align: tick.anchor })
            .css({ color: t.inkSoft, fontSize: "12px" })
            .add(group);
        });
      },
    },
  },
  credits: { enabled: false },
  colors: t.palette,
  title: {
    text: "ternary-basic · javascript · highcharts · anyplot.ai",
    style: { color: t.ink, fontSize: "22px", fontWeight: "600" },
    margin: 30,
  },
  xAxis: {
    min: -0.1,
    max: 1.1,
    startOnTick: false,
    endOnTick: false,
    gridLineWidth: 0,
    lineWidth: 0,
    tickLength: 0,
    labels: { enabled: false },
    title: { text: null },
  },
  yAxis: {
    // Same 1.2 total span as xAxis (keeps the triangle undistorted), but shifted
    // down so the apex sits close to the top instead of leaving a blank band.
    min: -0.25,
    max: 0.95,
    startOnTick: false,
    endOnTick: false,
    gridLineWidth: 0,
    lineWidth: 0,
    tickLength: 0,
    labels: { enabled: false },
    title: { text: null },
  },
  legend: {
    align: "center",
    verticalAlign: "bottom",
    layout: "horizontal",
    itemStyle: { color: t.inkSoft, fontSize: "14px" },
    itemHoverStyle: { color: t.ink },
  },
  tooltip: {
    backgroundColor: t.elevatedBg,
    borderColor: t.grid,
    style: { color: t.ink, fontSize: "13px" },
    formatter: function () {
      return (
        `<b>${this.series.name}</b><br/>` +
        `Sand: ${this.point.sand.toFixed(1)}%<br/>` +
        `Silt: ${this.point.silt.toFixed(1)}%<br/>` +
        `Clay: ${this.point.clay.toFixed(1)}%`
      );
    },
  },
  plotOptions: {
    series: { animation: false },
    scatter: {
      marker: { radius: 5, lineWidth: 1, lineColor: t.pageBg, symbol: "circle" },
      states: { hover: { enabled: true } },
    },
  },
  // x = 0.5 * sand_frac + clay_frac, y = sand_frac * TRI_H (barycentric -> Cartesian)
  series: [
    {
      name: "Sandy soils",
      color: t.palette[0],
      data: sandySoils.map((s) => ({ x: 0.5 * (s.sand / 100) + s.clay / 100, y: (s.sand / 100) * TRI_H, ...s })),
    },
    {
      name: "Loamy soils",
      color: t.palette[1],
      data: loamySoils.map((s) => ({ x: 0.5 * (s.sand / 100) + s.clay / 100, y: (s.sand / 100) * TRI_H, ...s })),
    },
    {
      name: "Clayey soils",
      color: t.palette[2],
      data: clayeySoils.map((s) => ({ x: 0.5 * (s.sand / 100) + s.clay / 100, y: (s.sand / 100) * TRI_H, ...s })),
    },
  ],
});
Runnable source as JSON, for any HTTP client: https://api.anyplot.ai/specs/ternary-basic/highcharts/code. Any spec id and library id listed in llms-full.txt fit the same URL shape; every URL below is complete and callable.
{
  "spec_id": "ternary-basic",
  "language": "javascript",
  "library": "highcharts",
  "page": "https://anyplot.ai/ternary-basic/javascript/highcharts",
  "hub": "https://anyplot.ai/ternary-basic",
  "code_json": "https://api.anyplot.ai/specs/ternary-basic/highcharts/code",
  "spec_json": "https://api.anyplot.ai/specs/ternary-basic",
  "render_light_png": "https://storage.googleapis.com/anyplot-images/plots/ternary-basic/javascript/highcharts/plot-light.png",
  "render_dark_png": "https://storage.googleapis.com/anyplot-images/plots/ternary-basic/javascript/highcharts/plot-dark.png",
  "interactive_light_html": "https://storage.googleapis.com/anyplot-images/plots/ternary-basic/javascript/highcharts/plot-light.html",
  "interactive_dark_html": "https://storage.googleapis.com/anyplot-images/plots/ternary-basic/javascript/highcharts/plot-dark.html",
  "quality_score": 90.0,
  "license": "MIT",
  "guide": "https://anyplot.ai/llms.txt"
}
Part of Basic Ternary Plot on anyplot.ai.