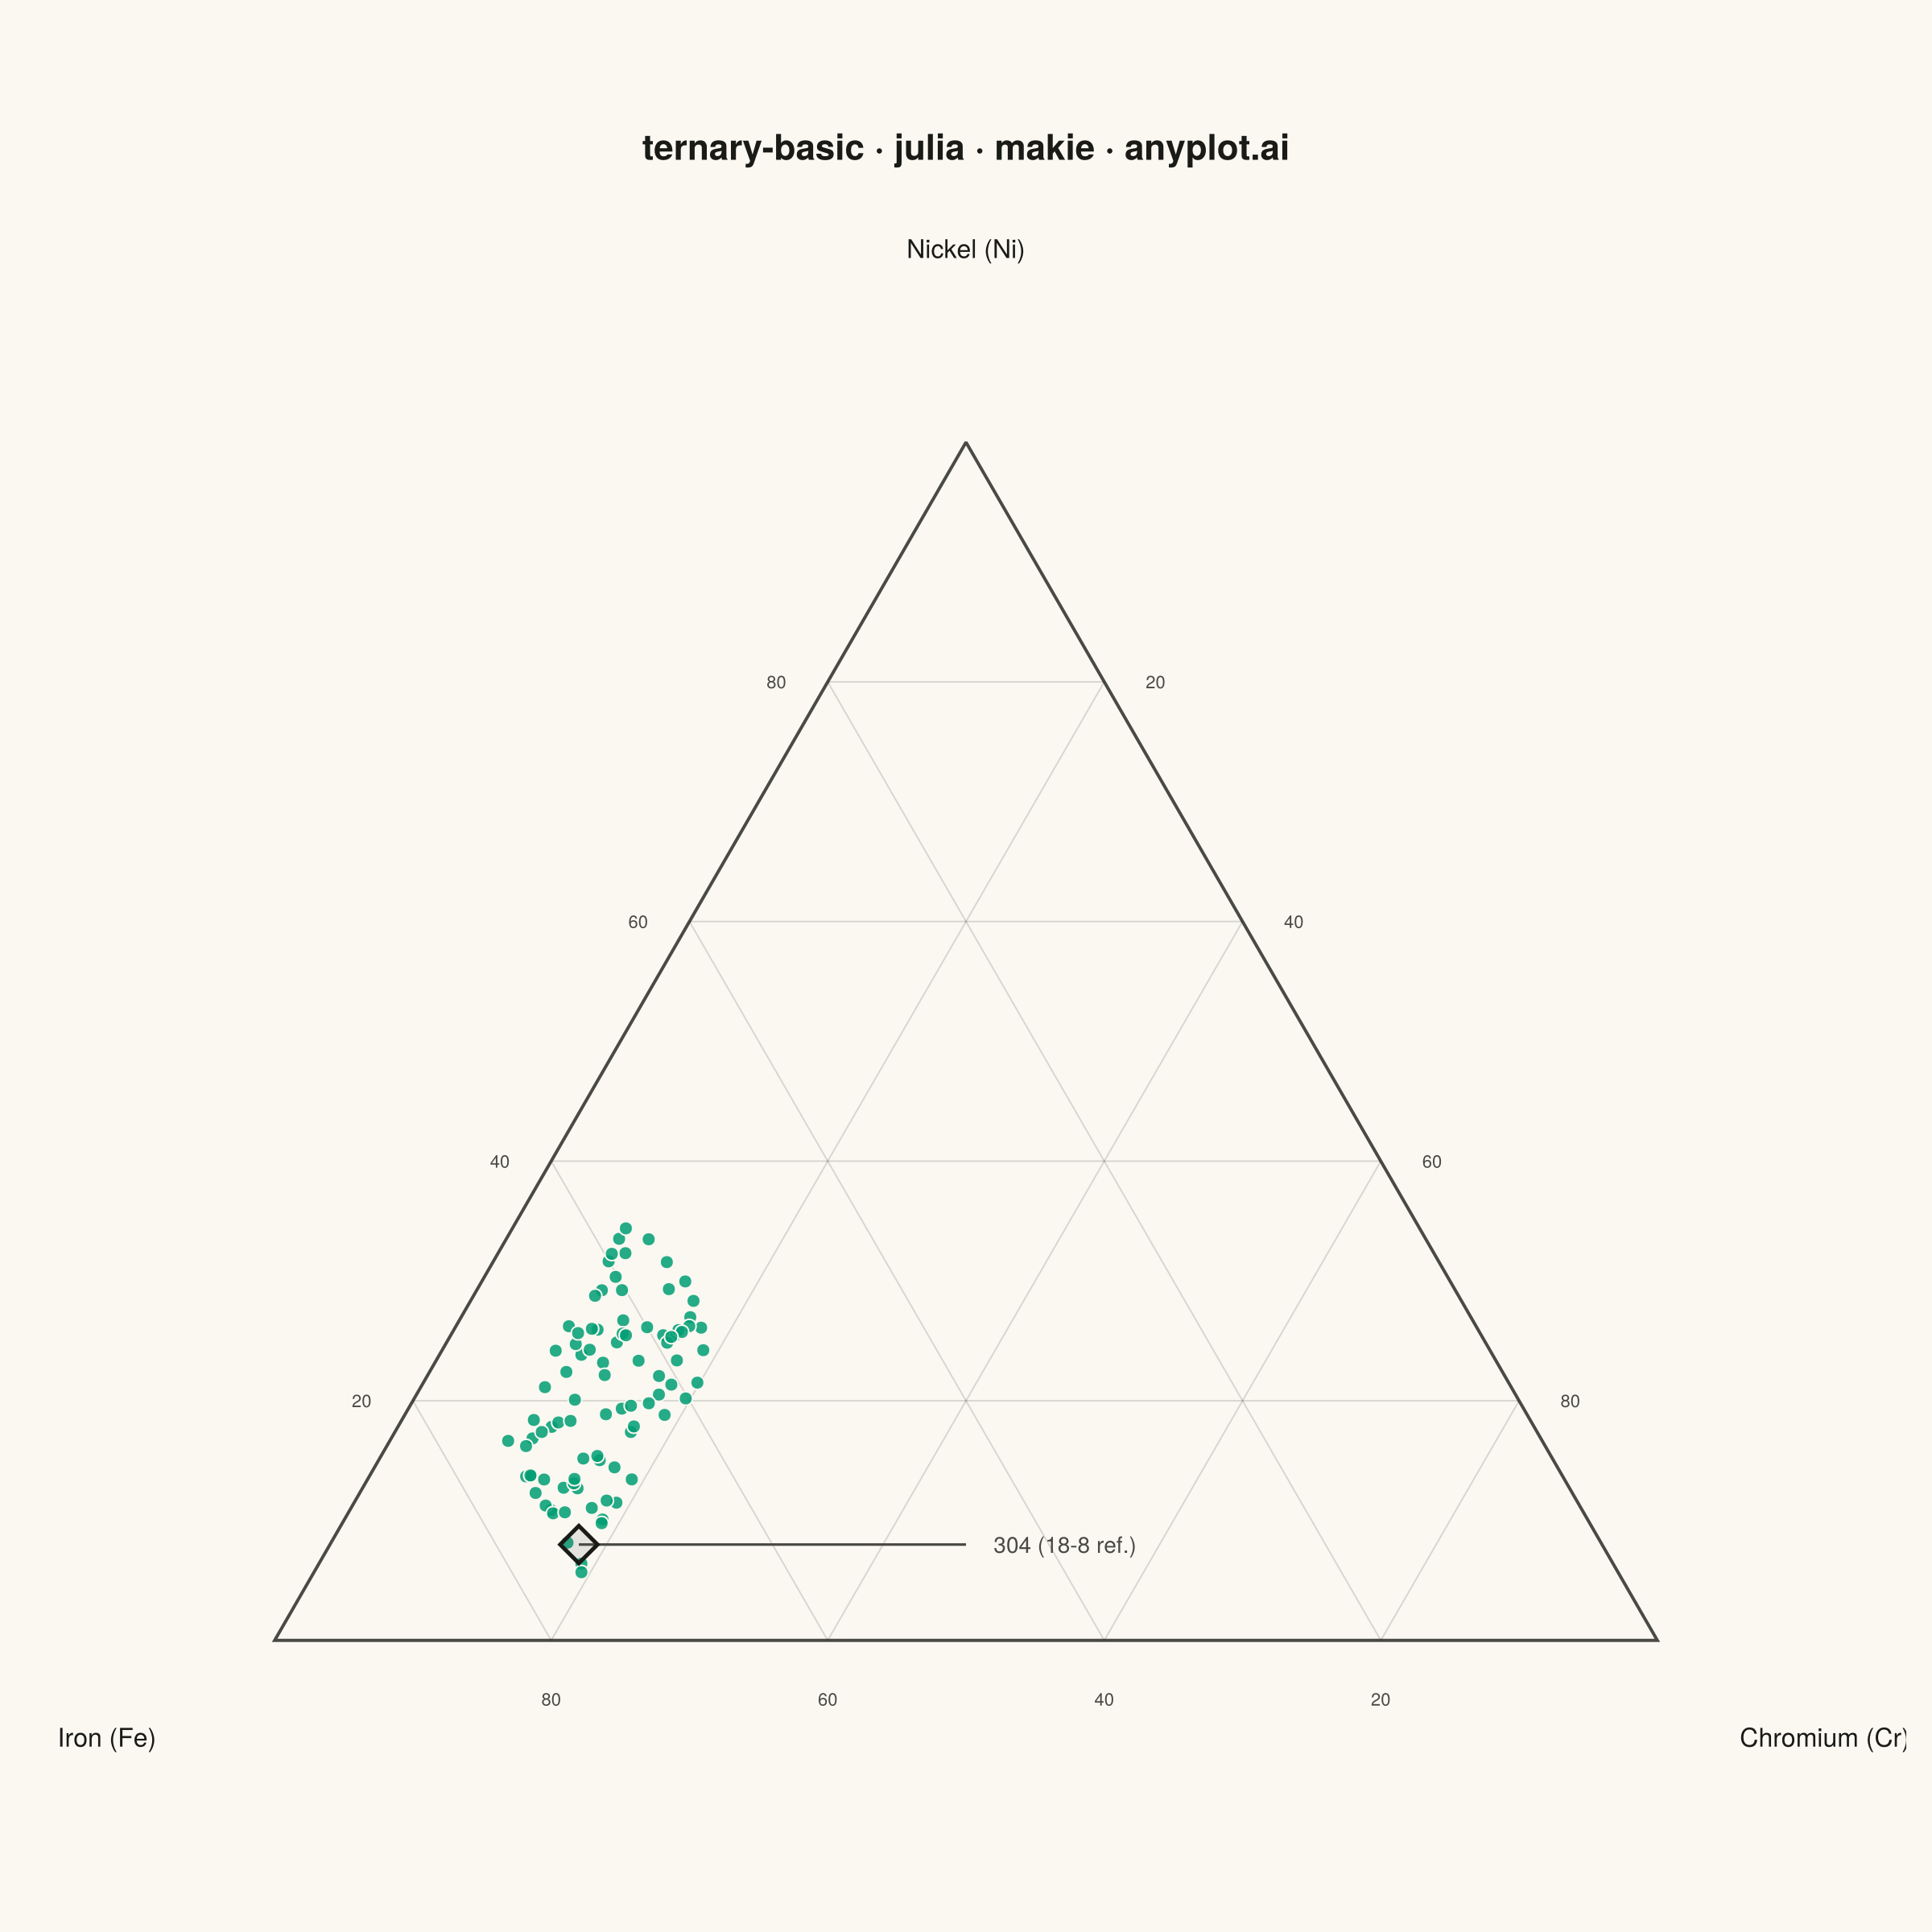
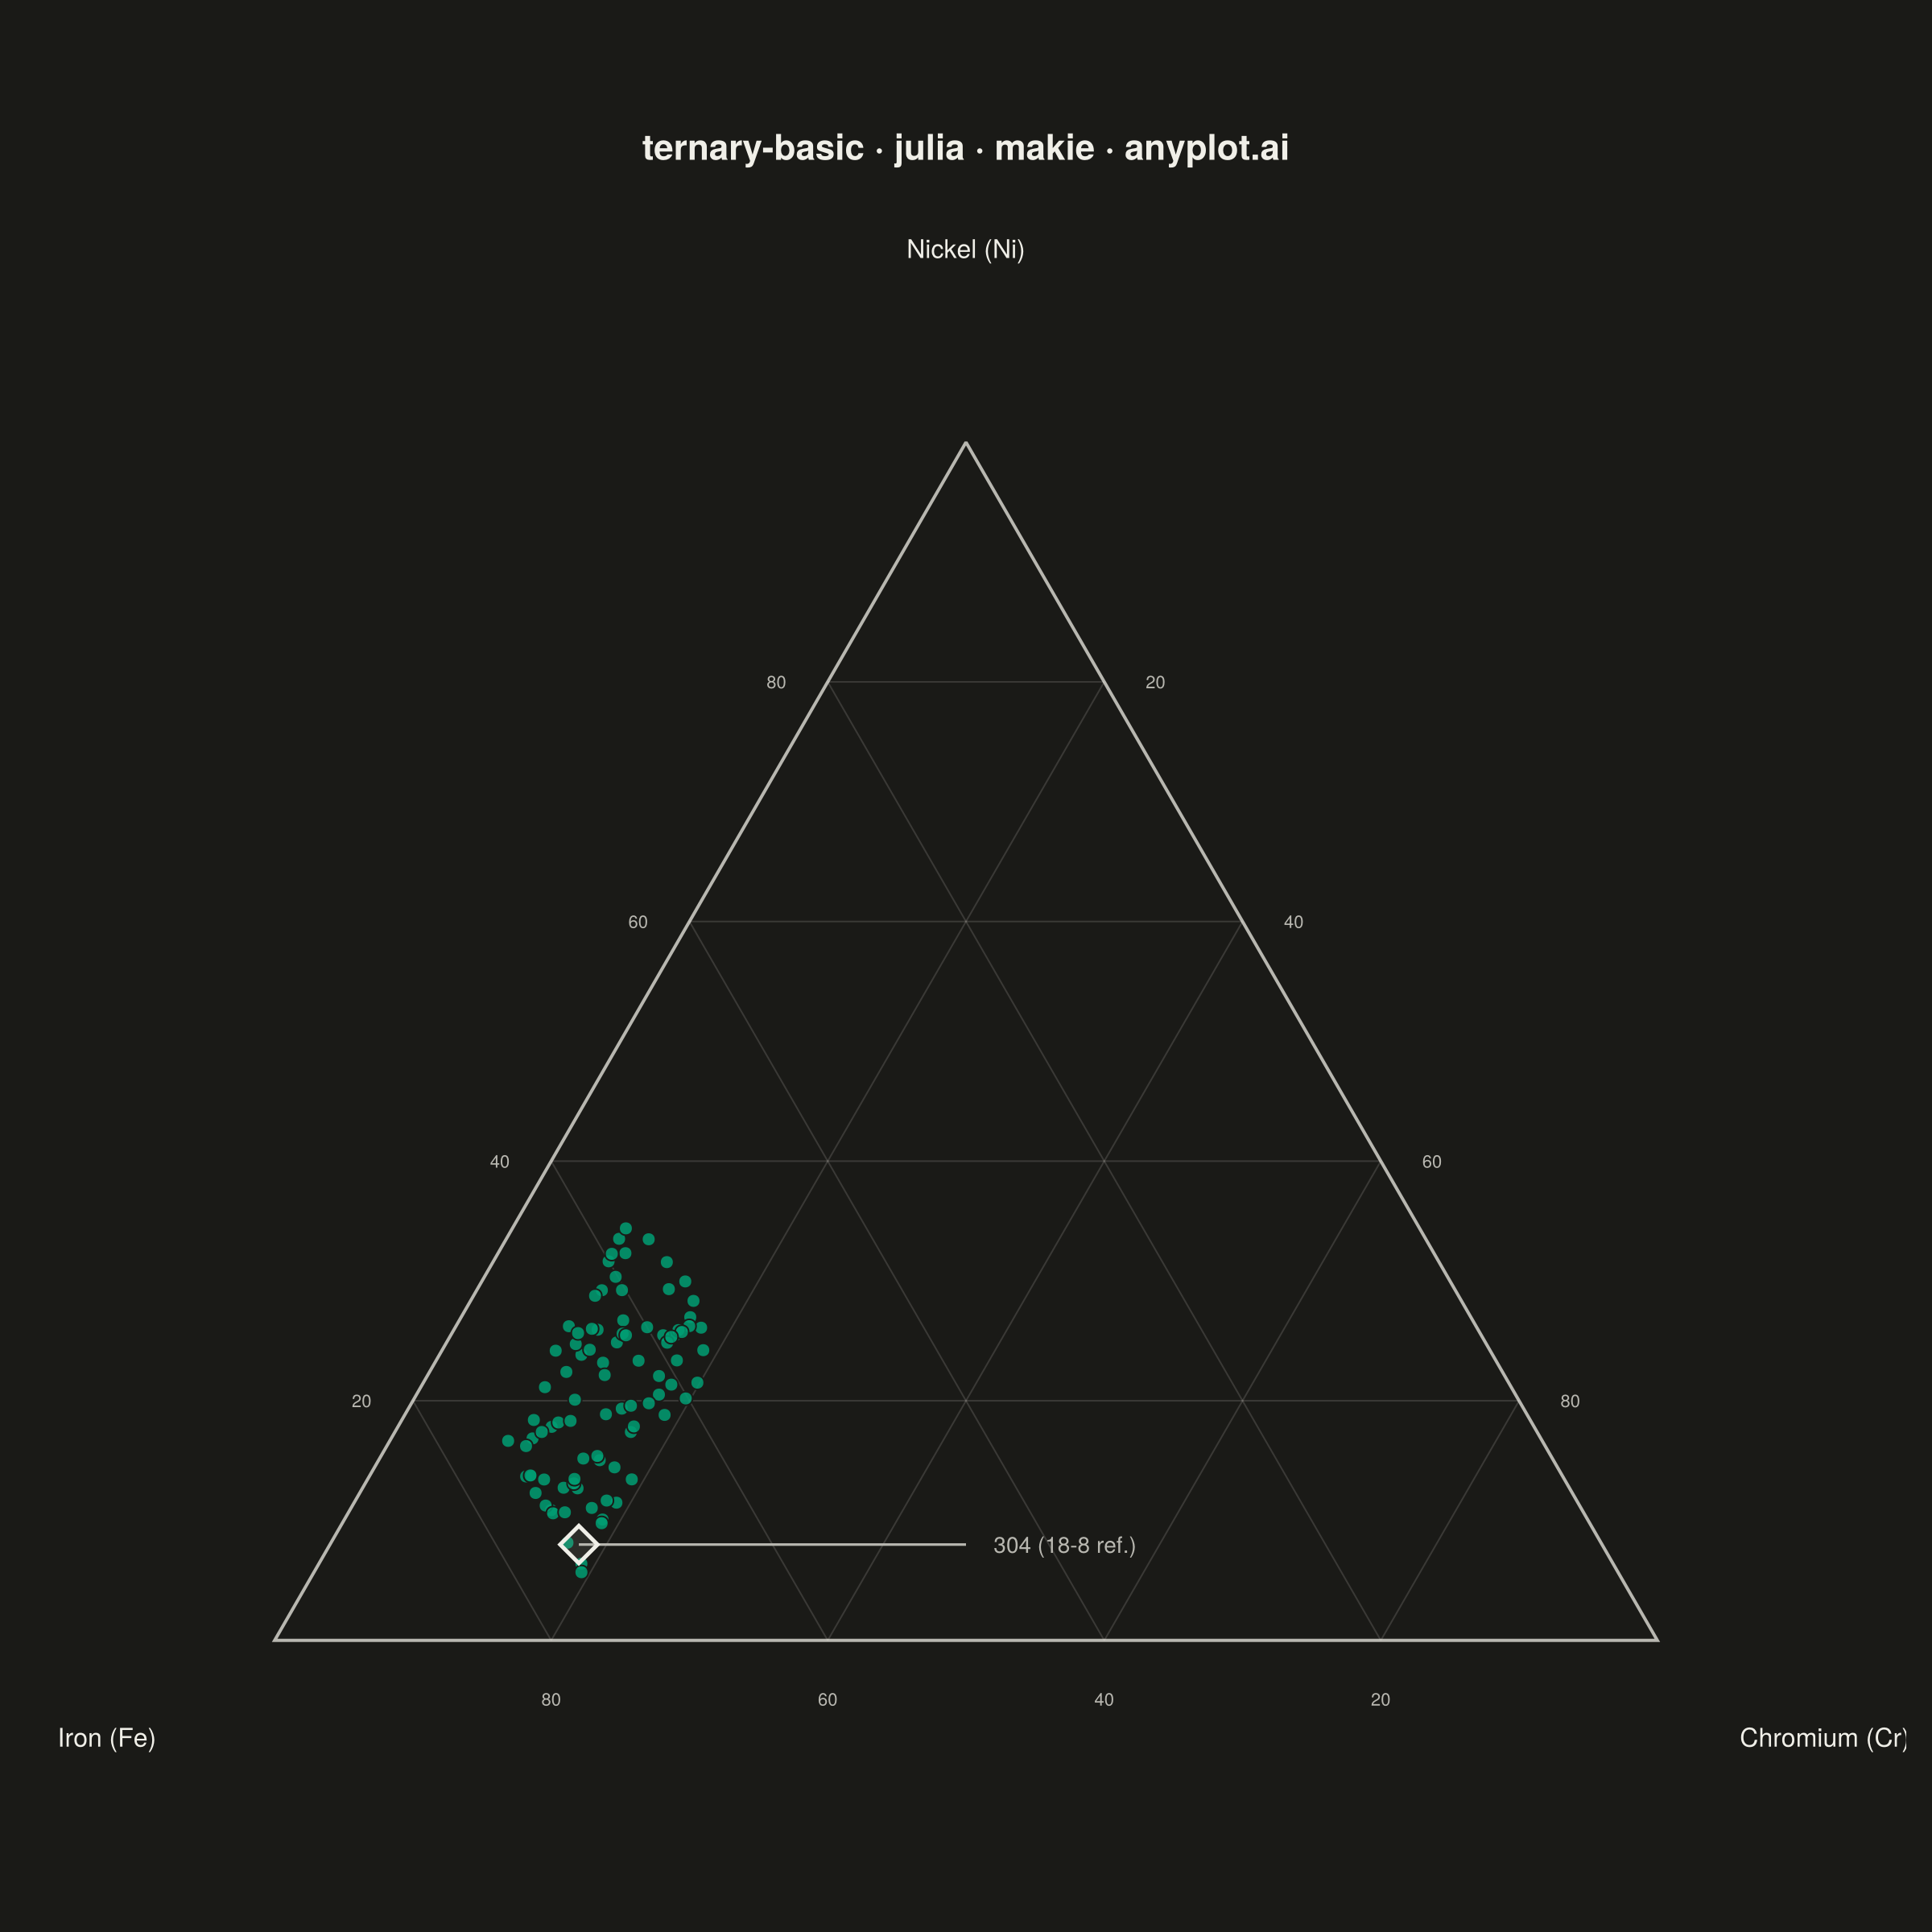
A ternary plot displays three-component compositional data on an equilateral triangle where each vertex represents 100% of one component. Points inside the triangle show compositions that sum to a constant total (usually 100%), with position indicating relative proportions. This visualization is essential for data where three variables are interdependent and constrained to sum to a fixed value.
# anyplot.ai
# ternary-basic: Basic Ternary Plot
# Library: makie 0.21.9 | Julia 1.11.9
# Quality: 91/100 | Created: 2026-08-04

using CairoMakie
using Colors
using Random

Random.seed!(42)

# --- Theme tokens -----------------------------------------------------------
const THEME    = get(ENV, "ANYPLOT_THEME", "light")
const PAGE_BG  = THEME == "light" ? colorant"#FAF8F1" : colorant"#1A1A17"
const INK      = THEME == "light" ? colorant"#1A1A17" : colorant"#F0EFE8"
const INK_SOFT = THEME == "light" ? colorant"#4A4A44" : colorant"#B8B7B0"
const GRID     = RGBA(INK.r, INK.g, INK.b, 0.15)
const BRAND    = colorant"#009E73"  # Imprint palette position 1

# --- Data: simulated stainless-steel alloy compositions (wt%, sum to 100) --
n_alloys     = 90
iron_pct     = 55.0 .+ 20.0 .* rand(n_alloys)
chromium_pct = 8.0 .+ 12.0 .* rand(n_alloys)
nickel_pct   = 100.0 .- iron_pct .- chromium_pct

# --- Barycentric -> Cartesian (equilateral triangle, unit side) -------------
# Vertices: Iron=(0,0), Chromium=(1,0), Nickel=(0.5, sqrt(3)/2)
bary_to_xy(b, c) = Point2f(b / 100 + 0.5 * c / 100, (sqrt(3) / 2) * c / 100)
pts = bary_to_xy.(chromium_pct, nickel_pct)

# Reference alloy: 18-8 (grade 304) stainless steel — Fe 74 / Cr 18 / Ni 8,
# the textbook composition most readers will recognize as an anchor.
ref_pt = bary_to_xy(18.0, 8.0)

# --- Plot ---------------------------------------------------------------
fig = Figure(
    resolution      = (1200, 1200),
    fontsize        = 14,
    backgroundcolor = PAGE_BG,
)

ax = Axis(
    fig[1, 1];
    title            = "ternary-basic · julia · makie · anyplot.ai",
    titlesize        = 22,
    titlecolor       = INK,
    backgroundcolor  = PAGE_BG,
    aspect           = DataAspect(),
)
hidedecorations!(ax)
hidespines!(ax)

# Triangle outline
lines!(ax, Point2f[(0.0, 0.0), (1.0, 0.0), (0.5, sqrt(3) / 2), (0.0, 0.0)];
       color = INK_SOFT, linewidth = 2.0)

# Grid lines at 20% intervals — three families, each parallel to one edge,
# batched into a single linesegments! call (Makie draws disjoint segment
# pairs in one primitive instead of many individual lines! calls).
grid_pts = Point2f[]
for t in 0.2:0.2:0.8
    # constant iron (parallel to the chromium-nickel edge)
    push!(grid_pts, Point2f(1 - t, 0.0), Point2f(0.5 * (1 - t), (sqrt(3) / 2) * (1 - t)))
    # constant chromium (parallel to the iron-nickel edge)
    push!(grid_pts, Point2f(t, 0.0), Point2f(t + 0.5 * (1 - t), (sqrt(3) / 2) * (1 - t)))
    # constant nickel (parallel to the iron-chromium edge)
    push!(grid_pts, Point2f(0.5 * t, (sqrt(3) / 2) * t), Point2f(1 - 0.5 * t, (sqrt(3) / 2) * t))
end
linesegments!(ax, grid_pts; color = GRID, linewidth = 1.0)

# Vertex labels, offset outward from the centroid
centroid = (0.5, sqrt(3) / 6)
for (vx, vy, label) in [
    (0.0, 0.0, "Iron (Fe)"),
    (1.0, 0.0, "Chromium (Cr)"),
    (0.5, sqrt(3) / 2, "Nickel (Ni)"),
]
    dx, dy = vx - centroid[1], vy - centroid[2]
    d = sqrt(dx^2 + dy^2)
    text!(ax, vx + 0.14 * dx / d, vy + 0.14 * dy / d;
          text = label, color = INK, fontsize = 16, align = (:center, :center))
end

# Edge tick labels — each edge scales the component of its own vertex
for t in 0.2:0.2:0.8
    text!(ax, t, -0.035; text = string(round(Int, (1 - t) * 100)),
          color = INK_SOFT, fontsize = 11, align = (:center, :top))
    text!(ax, 0.5 * t - 0.03, (sqrt(3) / 2) * t; text = string(round(Int, t * 100)),
          color = INK_SOFT, fontsize = 11, align = (:right, :center))
    text!(ax, 1 - 0.5 * t + 0.03, (sqrt(3) / 2) * t; text = string(round(Int, (1 - t) * 100)),
          color = INK_SOFT, fontsize = 11, align = (:left, :center))
end

# Data points — single series, Imprint brand green; fill alpha < 1 keeps
# overlapping points distinguishable in the densest part of the cluster.
scatter!(ax, pts; color = (BRAND, 0.85), markersize = 12, strokewidth = 1.0, strokecolor = PAGE_BG)

# Reference composition anchor — open diamond in the neutral ink tone marks
# 18-8 (304) stainless, giving the reader a recognizable focal point to
# compare the alloy cloud against. Leader runs into the empty mid-triangle
# gap (chromium/nickel can't jointly reach x≈0.5 within the sampled ranges)
# so the label never collides with the cluster. Drawn last (on top of the
# grid/data) with a heavier linewidth and a tinted (not pure-background)
# fill so the anchor never blends into surrounding elements.
lines!(ax, [ref_pt, ref_pt + Point2f(0.28, 0.0)]; color = INK_SOFT, linewidth = 1.6)
scatter!(ax, [ref_pt]; marker = :diamond, markersize = 26, color = (INK_SOFT, 0.12),
         strokewidth = 2.5, strokecolor = INK)
text!(ax, ref_pt + Point2f(0.30, 0.0); text = "304 (18-8 ref.)",
      color = INK_SOFT, fontsize = 14, align = (:left, :center))

xlims!(ax, -0.18, 1.18)
ylims!(ax, -0.12, 1.06)

# --- Save --------------------------------------------------------------
save("plot-$(THEME).png", fig; px_per_unit = 2)
Runnable source as JSON, for any HTTP client: https://api.anyplot.ai/specs/ternary-basic/makie/code. Any spec id and library id listed in llms-full.txt fit the same URL shape; every URL below is complete and callable.
{
  "spec_id": "ternary-basic",
  "language": "julia",
  "library": "makie",
  "page": "https://anyplot.ai/ternary-basic/julia/makie",
  "hub": "https://anyplot.ai/ternary-basic",
  "code_json": "https://api.anyplot.ai/specs/ternary-basic/makie/code",
  "spec_json": "https://api.anyplot.ai/specs/ternary-basic",
  "render_light_png": "https://storage.googleapis.com/anyplot-images/plots/ternary-basic/julia/makie/plot-light.png",
  "render_dark_png": "https://storage.googleapis.com/anyplot-images/plots/ternary-basic/julia/makie/plot-dark.png",
  "quality_score": 91.0,
  "license": "MIT",
  "guide": "https://anyplot.ai/llms.txt"
}
Part of Basic Ternary Plot on anyplot.ai.