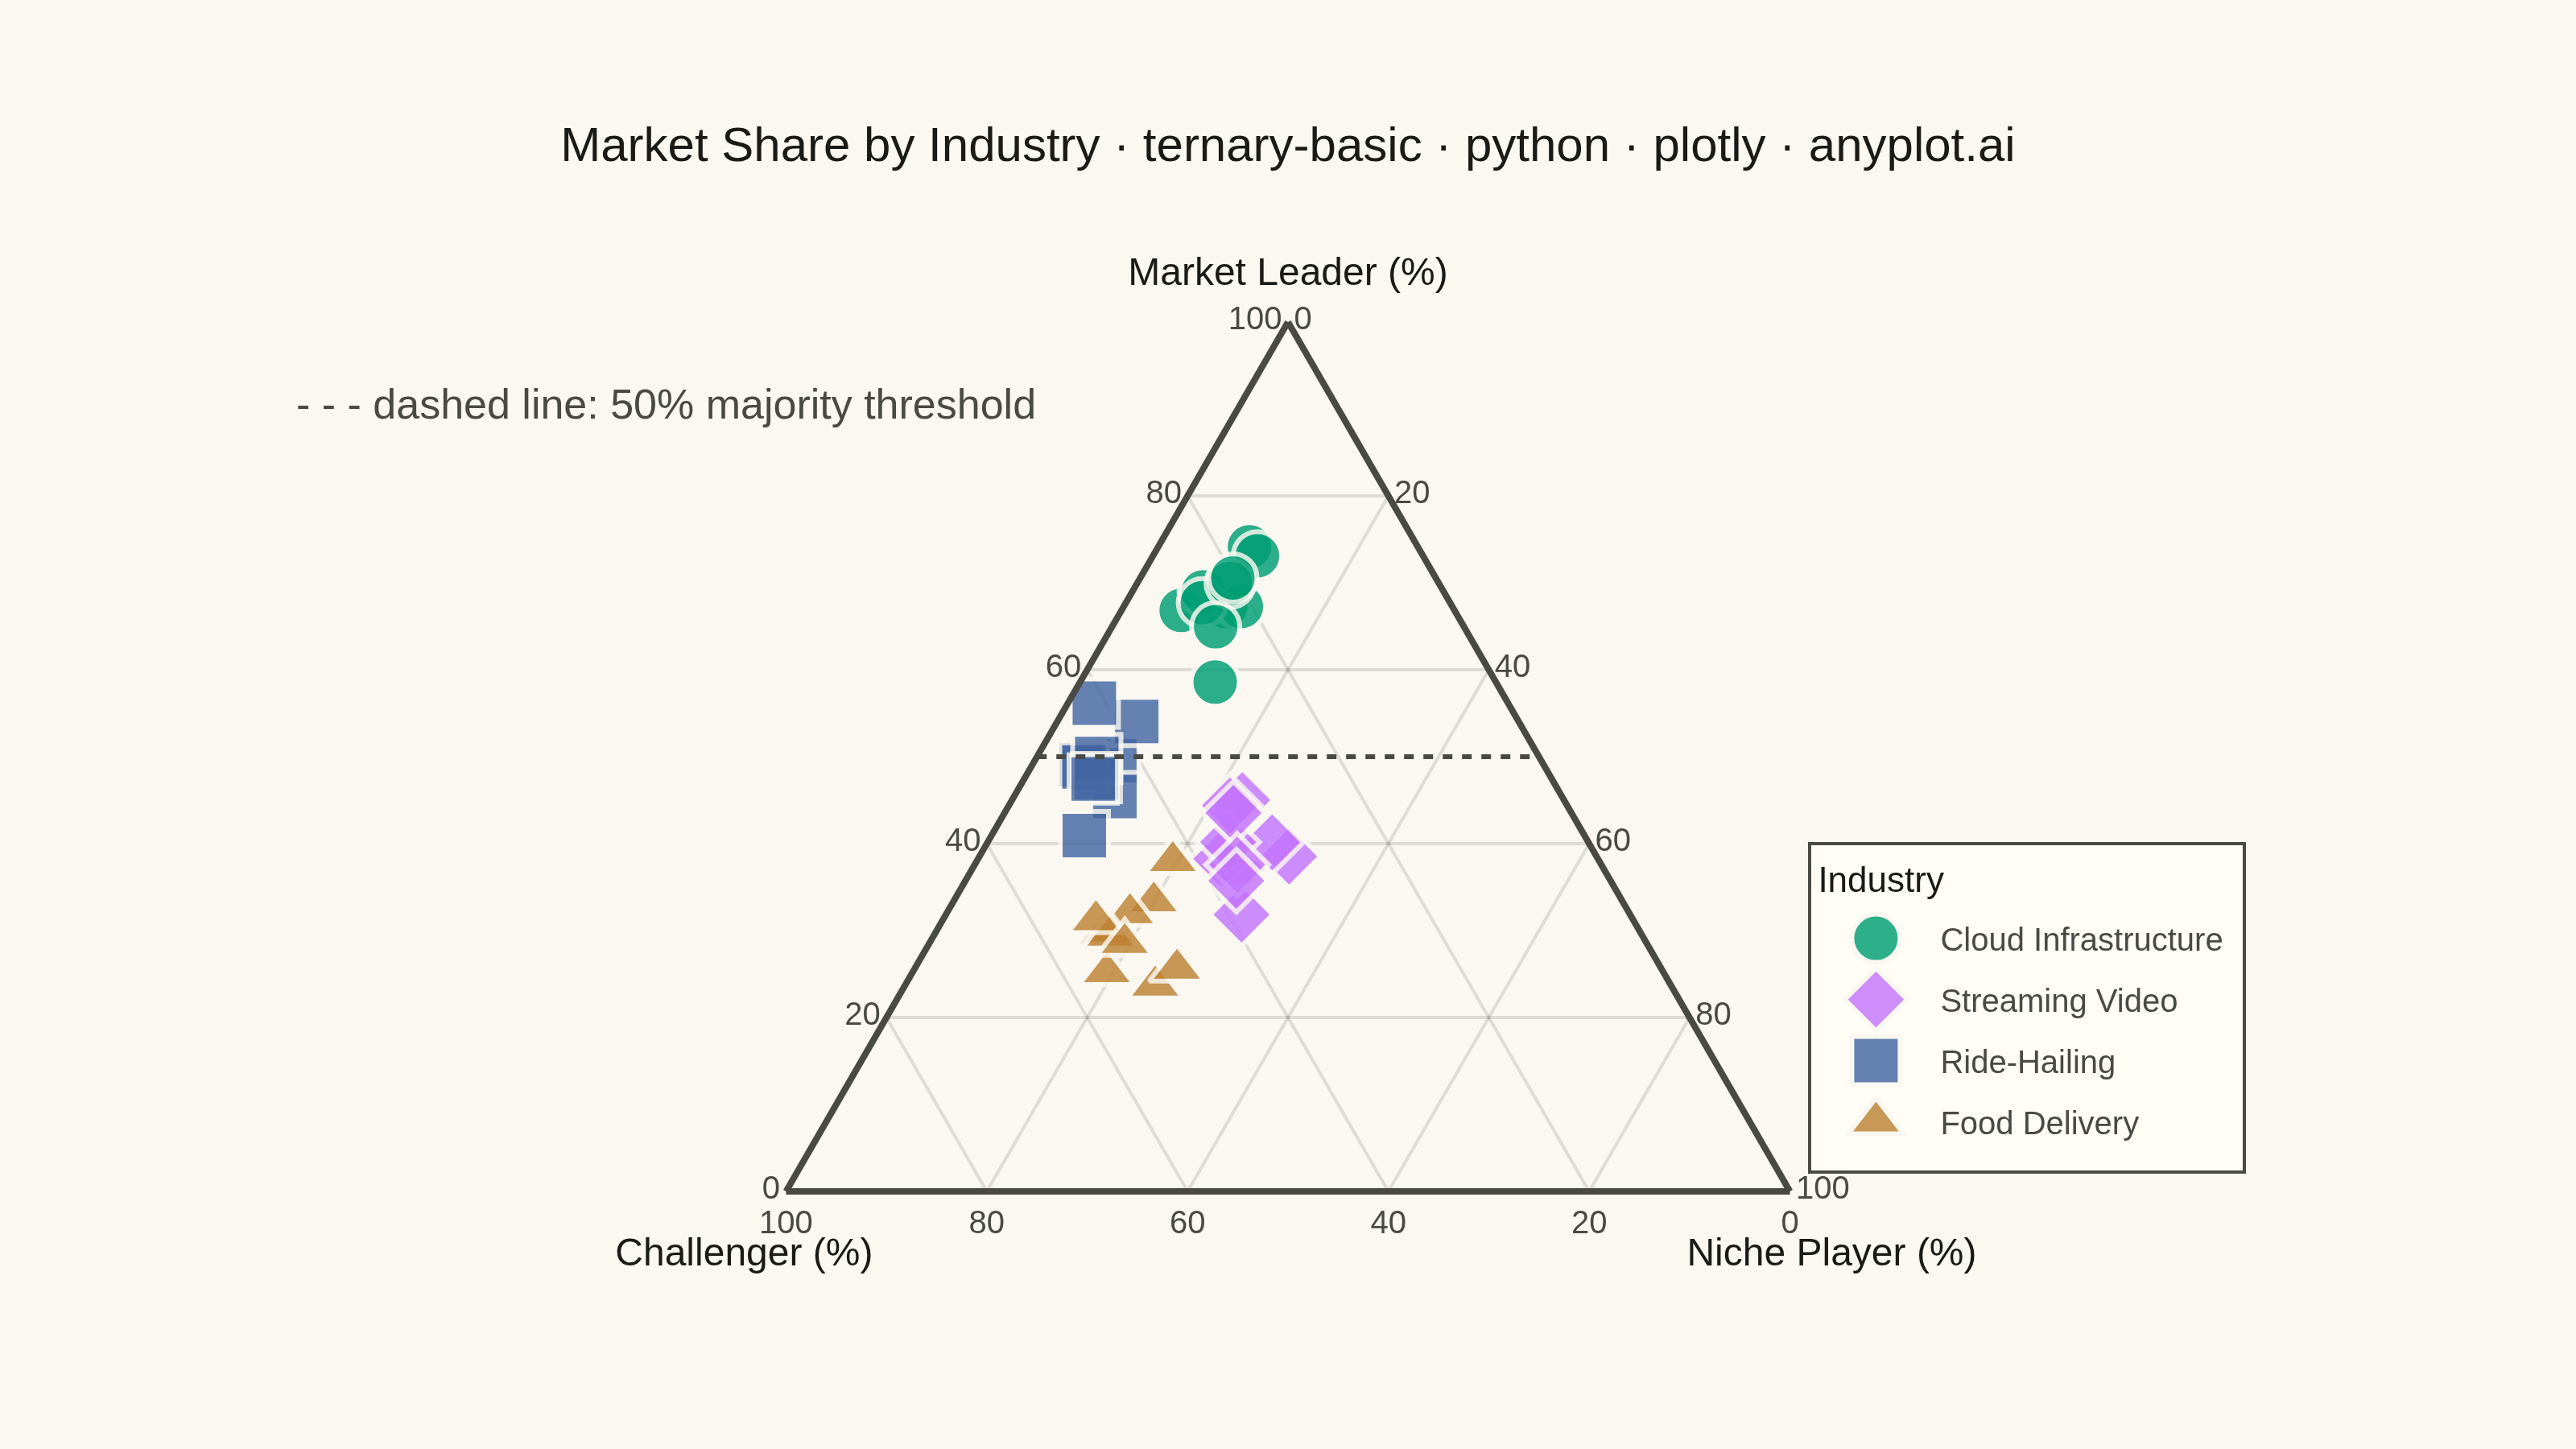
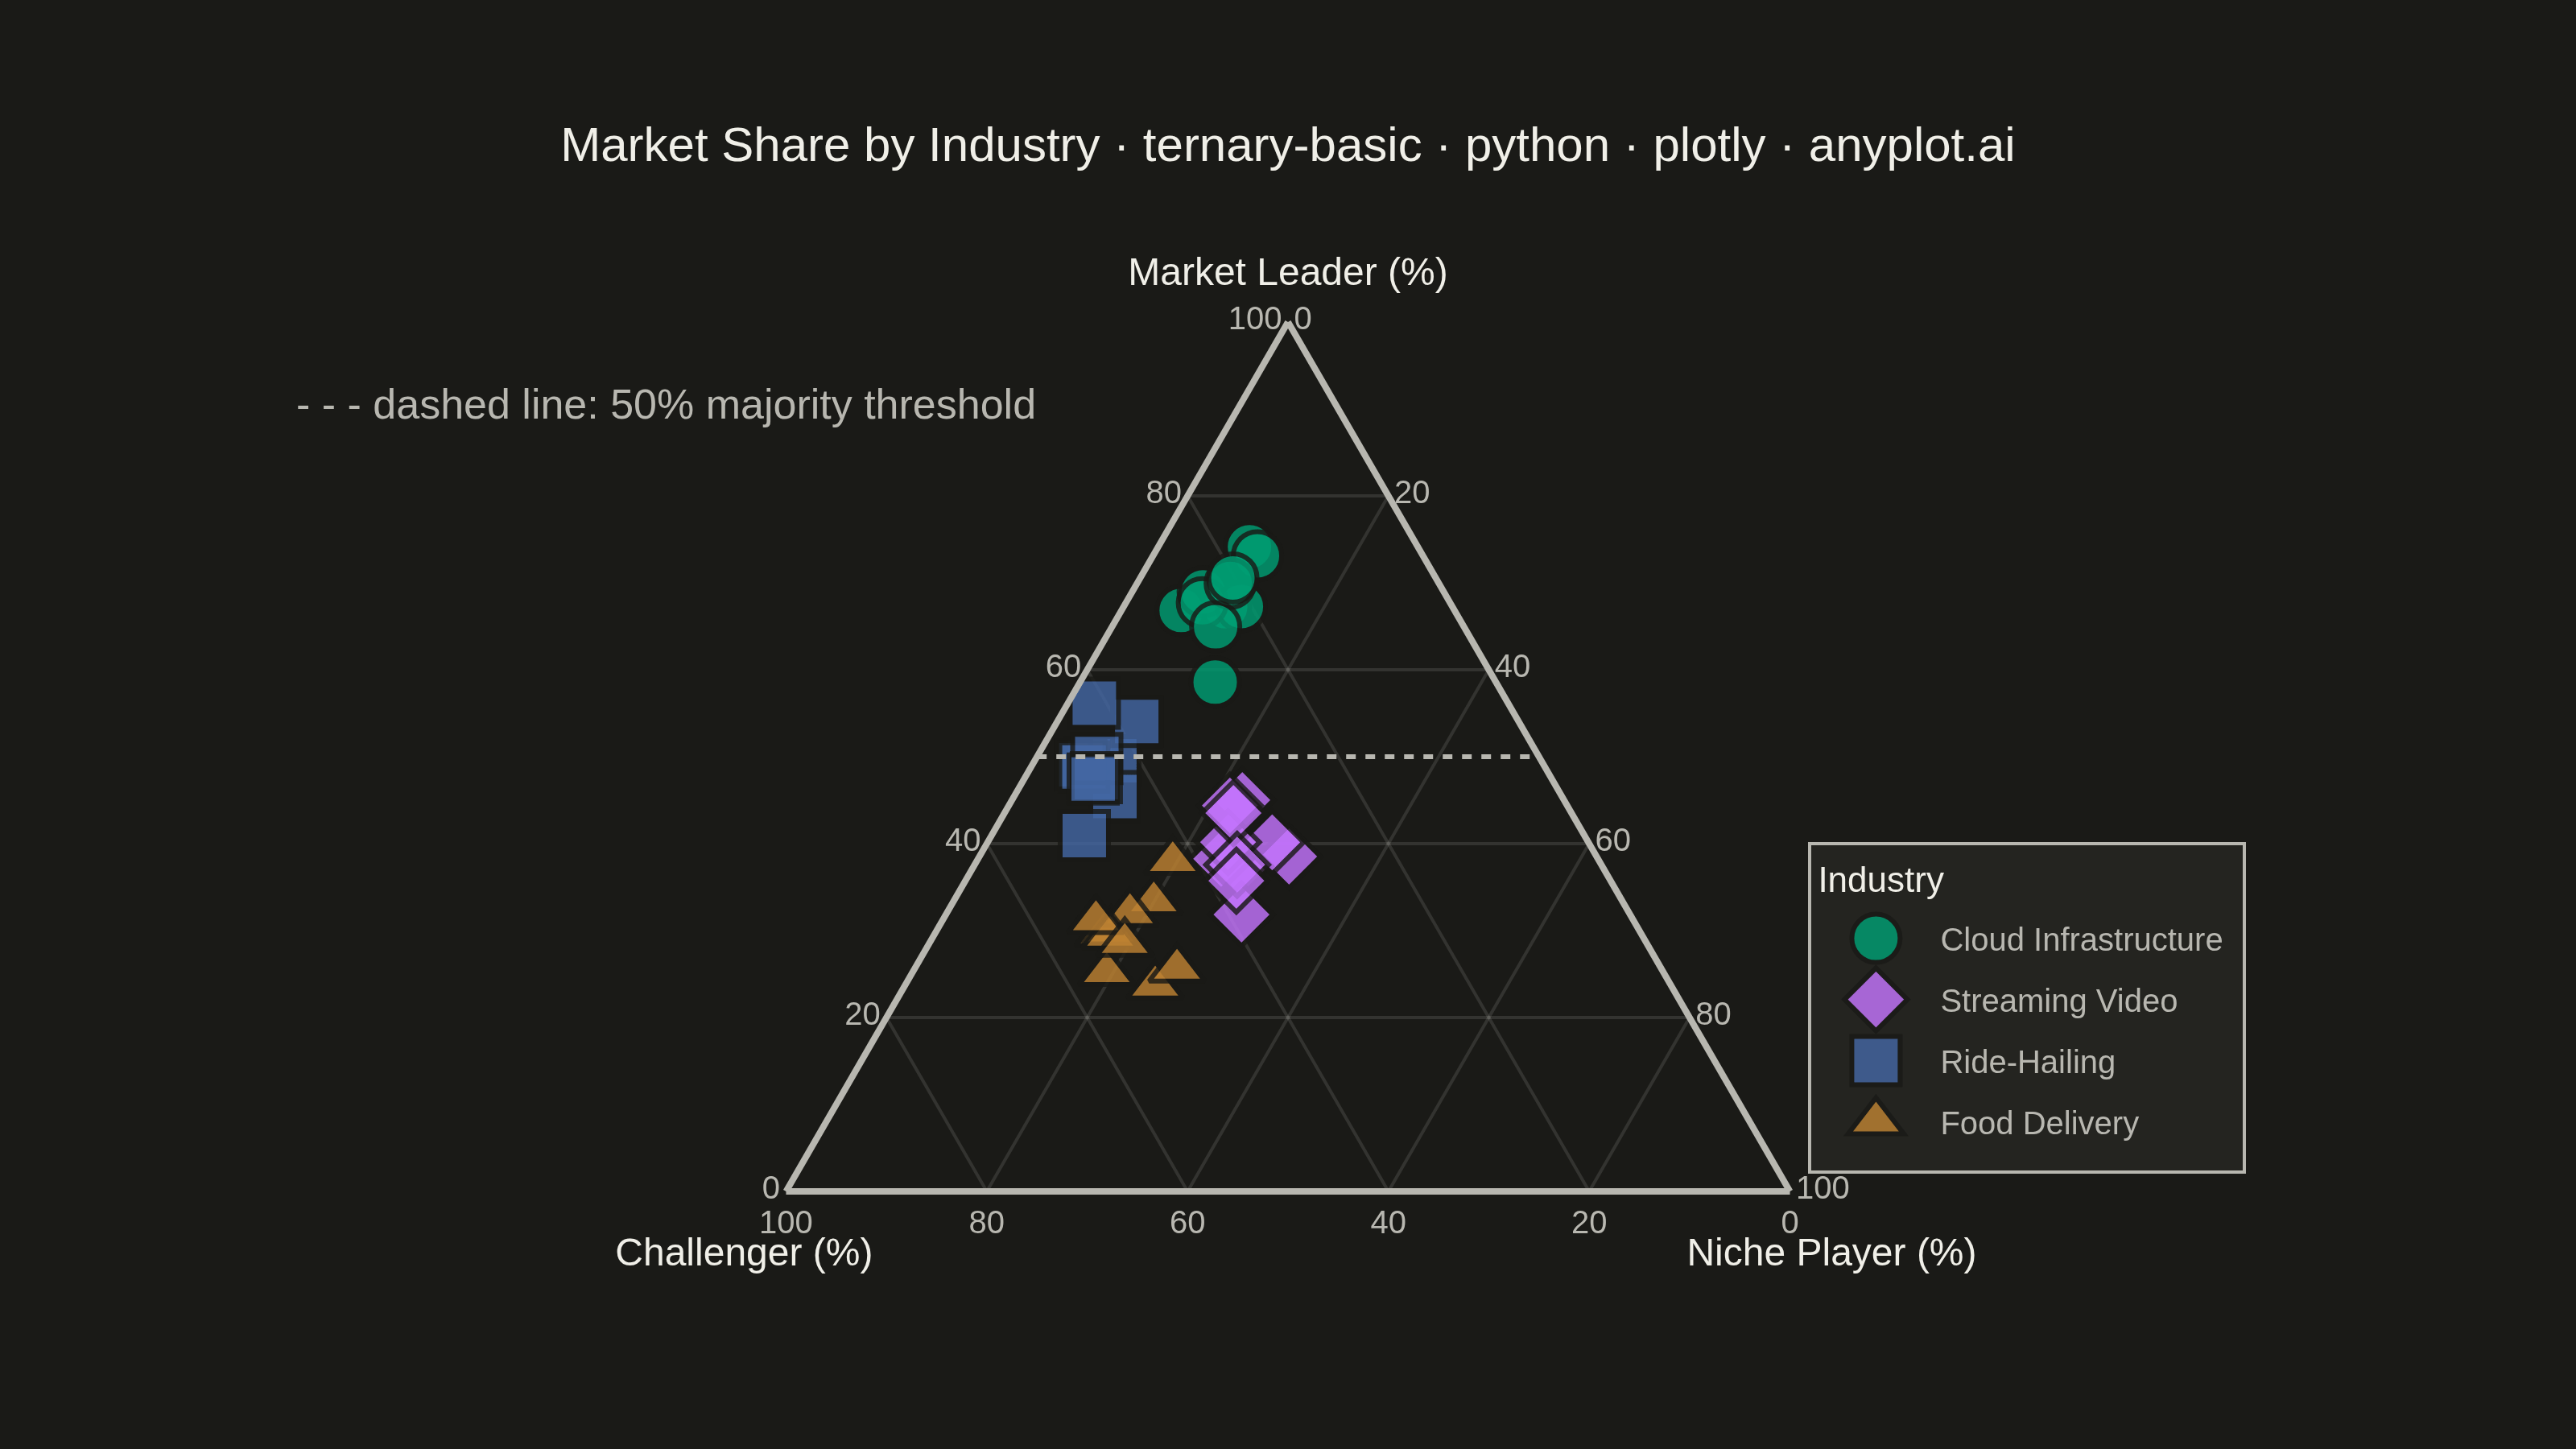
A ternary plot displays three-component compositional data on an equilateral triangle where each vertex represents 100% of one component. Points inside the triangle show compositions that sum to a constant total (usually 100%), with position indicating relative proportions. This visualization is essential for data where three variables are interdependent and constrained to sum to a fixed value.
""" anyplot.ai
ternary-basic: Basic Ternary Plot
Library: plotly 6.9.0 | Python 3.13.14
Quality: 91/100 | Updated: 2026-08-04
"""

import os

import numpy as np
import plotly.graph_objects as go


# Theme tokens (see prompts/default-style-guide.md "Theme-adaptive Chrome")
THEME = os.getenv("ANYPLOT_THEME", "light")
PAGE_BG = "#FAF8F1" if THEME == "light" else "#1A1A17"
ELEVATED_BG = "#FFFDF6" if THEME == "light" else "#242420"
INK = "#1A1A17" if THEME == "light" else "#F0EFE8"
INK_SOFT = "#4A4A44" if THEME == "light" else "#B8B7B0"
GRID = "rgba(26,26,23,0.12)" if THEME == "light" else "rgba(240,239,232,0.12)"

# Imprint palette (first series is always #009E73)
IMPRINT = [
    "#009E73",  # bluish green (brand — primary)
    "#C475FD",  # vermillion (secondary)
    "#4467A3",  # blue (tertiary)
    "#BD8233",  # reddish purple (quaternary)
]

# Data: three-way market share (leader / challenger / niche player) across
# four industries, each with a distinct competitive structure. This spreads
# points across the full simplex — concentrated markets sit near the "Leader"
# vertex, three-way races sit near the centroid, and duopolies sit near the
# leader-challenger edge — rather than clustering in one corner. Per-point
# noise is renormalized so the three shares always sum to exactly 100%.
np.random.seed(42)

industries = [
    ("Cloud Infrastructure", 65.0, 25.0, 10.0, "circle"),
    ("Streaming Video", 40.0, 35.0, 25.0, "diamond"),
    ("Ride-Hailing", 48.0, 45.0, 7.0, "square"),
    ("Food Delivery", 30.0, 50.0, 20.0, "triangle-up"),
]

n_per_industry = 11
leader_all, challenger_all, niche_all, industry_idx = [], [], [], []
for idx, (_name, lead0, chal0, niche0, _symbol) in enumerate(industries):
    lead = np.clip(lead0 + np.random.normal(0, 5.0, n_per_industry), 1, None)
    chal = np.clip(chal0 + np.random.normal(0, 5.0, n_per_industry), 1, None)
    niche = np.clip(niche0 + np.random.normal(0, 3.0, n_per_industry), 1, None)
    total = lead + chal + niche
    leader_all.append(lead / total * 100)
    challenger_all.append(chal / total * 100)
    niche_all.append(niche / total * 100)
    industry_idx.extend([idx] * n_per_industry)

leader_all = np.concatenate(leader_all)
challenger_all = np.concatenate(challenger_all)
niche_all = np.concatenate(niche_all)
industry_idx = np.array(industry_idx)

title_text = "Market Share by Industry · ternary-basic · python · plotly · anyplot.ai"
title_fontsize = round(16 * min(1.0, 67 / len(title_text)))

fig = go.Figure()

# One trace per industry: color AND marker symbol both encode the group, so
# the grouping reads even for viewers who can't distinguish the hues.
for idx, (name, _lead0, _chal0, _niche0, symbol) in enumerate(industries):
    mask = industry_idx == idx
    fig.add_trace(
        go.Scatterternary(
            a=leader_all[mask],
            b=challenger_all[mask],
            c=niche_all[mask],
            mode="markers",
            name=name,
            marker={
                "symbol": symbol,
                "size": 15,
                "color": IMPRINT[idx],
                "opacity": 0.82,
                "line": {"width": 1.5, "color": PAGE_BG},
            },
            hovertemplate=(
                "<b>%{customdata}</b><br>Leader: %{a:.1f}%<br>Challenger: %{b:.1f}%<br>Niche: %{c:.1f}%<extra></extra>"
            ),
            customdata=[name] * int(mask.sum()),
        )
    )

# Reference line: the 50% "majority" threshold — above it the leader alone
# controls the market, below it no single player commands a majority. A
# domain-specific annotation, not just decoration.
fig.add_trace(
    go.Scatterternary(
        a=[50, 50],
        b=[50, 0],
        c=[0, 50],
        mode="lines",
        line={"width": 1.5, "color": INK_SOFT, "dash": "dot"},
        showlegend=False,
        hoverinfo="skip",
    )
)
fig.add_annotation(
    text="- - - dashed line: 50% majority threshold",
    xref="paper",
    yref="paper",
    x=0.0,
    y=0.87,
    xanchor="left",
    yanchor="bottom",
    showarrow=False,
    font={"size": 13, "color": INK_SOFT},
)

fig.update_layout(
    autosize=False,
    title={"text": title_text, "font": {"size": title_fontsize, "color": INK}, "x": 0.5, "xanchor": "center"},
    ternary={
        "sum": 100,
        "aaxis": {
            "title": {"text": "Market Leader (%)", "font": {"size": 12, "color": INK}},
            "tickmode": "linear",
            "tick0": 0,
            "dtick": 20,
            "tickfont": {"size": 10, "color": INK_SOFT},
            "linewidth": 2,
            "linecolor": INK_SOFT,
            "gridwidth": 1,
            "gridcolor": GRID,
        },
        "baxis": {
            "title": {"text": "Challenger (%)", "font": {"size": 12, "color": INK}},
            "tickmode": "linear",
            "tick0": 0,
            "dtick": 20,
            "tickfont": {"size": 10, "color": INK_SOFT},
            "linewidth": 2,
            "linecolor": INK_SOFT,
            "gridwidth": 1,
            "gridcolor": GRID,
        },
        "caxis": {
            "title": {"text": "Niche Player (%)", "font": {"size": 12, "color": INK}},
            "tickmode": "linear",
            "tick0": 0,
            "dtick": 20,
            "tickfont": {"size": 10, "color": INK_SOFT},
            "linewidth": 2,
            "linecolor": INK_SOFT,
            "gridwidth": 1,
            "gridcolor": GRID,
        },
        "bgcolor": PAGE_BG,
    },
    paper_bgcolor=PAGE_BG,
    plot_bgcolor=PAGE_BG,
    margin={"l": 90, "r": 90, "t": 100, "b": 80},
    legend={
        "title": {"text": "Industry", "font": {"size": 11, "color": INK}},
        "x": 0.98,
        "y": 0.02,
        "xanchor": "right",
        "yanchor": "bottom",
        "bgcolor": ELEVATED_BG,
        "bordercolor": INK_SOFT,
        "borderwidth": 1,
        "font": {"color": INK_SOFT, "size": 10},
    },
)

# Save outputs — hard target 3200x1800, see prompts/library/plotly.md "Canvas"
fig.write_image(f"plot-{THEME}.png", width=800, height=450, scale=4)
fig.write_html(f"plot-{THEME}.html", include_plotlyjs="cdn")
Runnable source as JSON, for any HTTP client: https://api.anyplot.ai/specs/ternary-basic/plotly/code. Any spec id and library id listed in llms-full.txt fit the same URL shape; every URL below is complete and callable.
{
  "spec_id": "ternary-basic",
  "language": "python",
  "library": "plotly",
  "page": "https://anyplot.ai/ternary-basic/python/plotly",
  "hub": "https://anyplot.ai/ternary-basic",
  "code_json": "https://api.anyplot.ai/specs/ternary-basic/plotly/code",
  "spec_json": "https://api.anyplot.ai/specs/ternary-basic",
  "render_light_png": "https://storage.googleapis.com/anyplot-images/plots/ternary-basic/python/plotly/plot-light.png",
  "render_dark_png": "https://storage.googleapis.com/anyplot-images/plots/ternary-basic/python/plotly/plot-dark.png",
  "interactive_light_html": "https://storage.googleapis.com/anyplot-images/plots/ternary-basic/python/plotly/plot-light.html",
  "interactive_dark_html": "https://storage.googleapis.com/anyplot-images/plots/ternary-basic/python/plotly/plot-dark.html",
  "quality_score": 91.0,
  "license": "MIT",
  "guide": "https://anyplot.ai/llms.txt"
}
Part of Basic Ternary Plot on anyplot.ai.