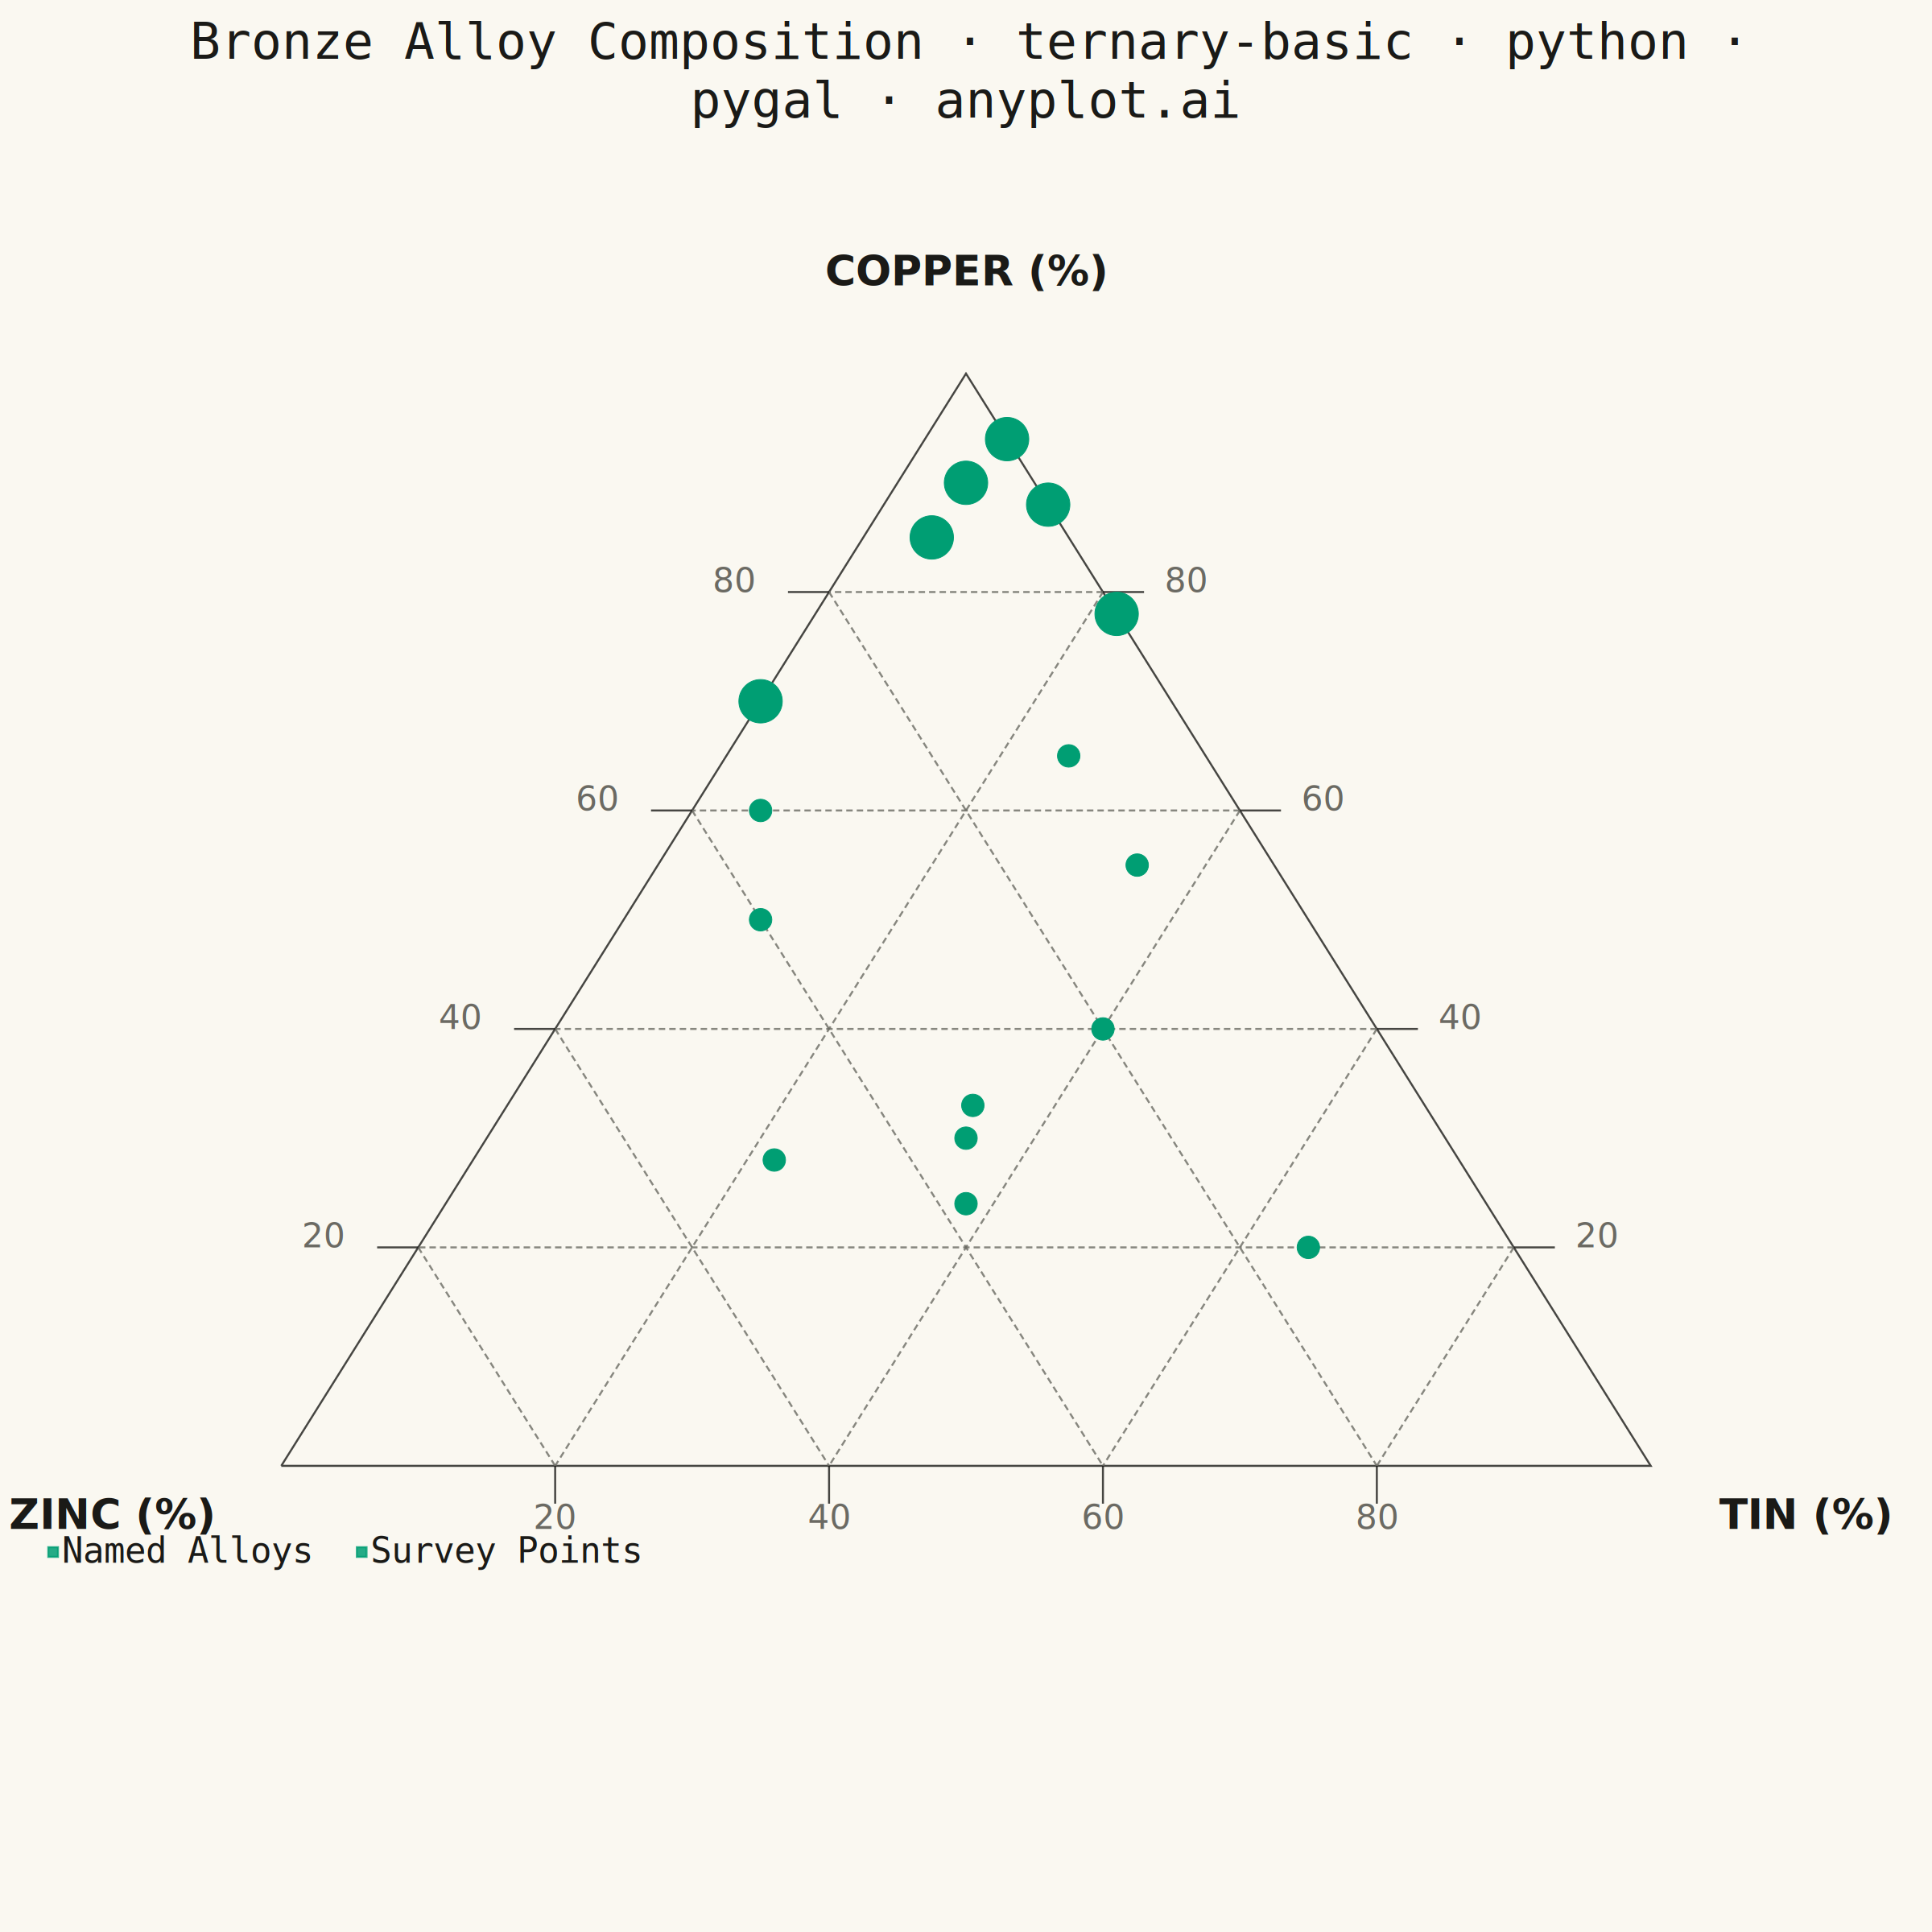
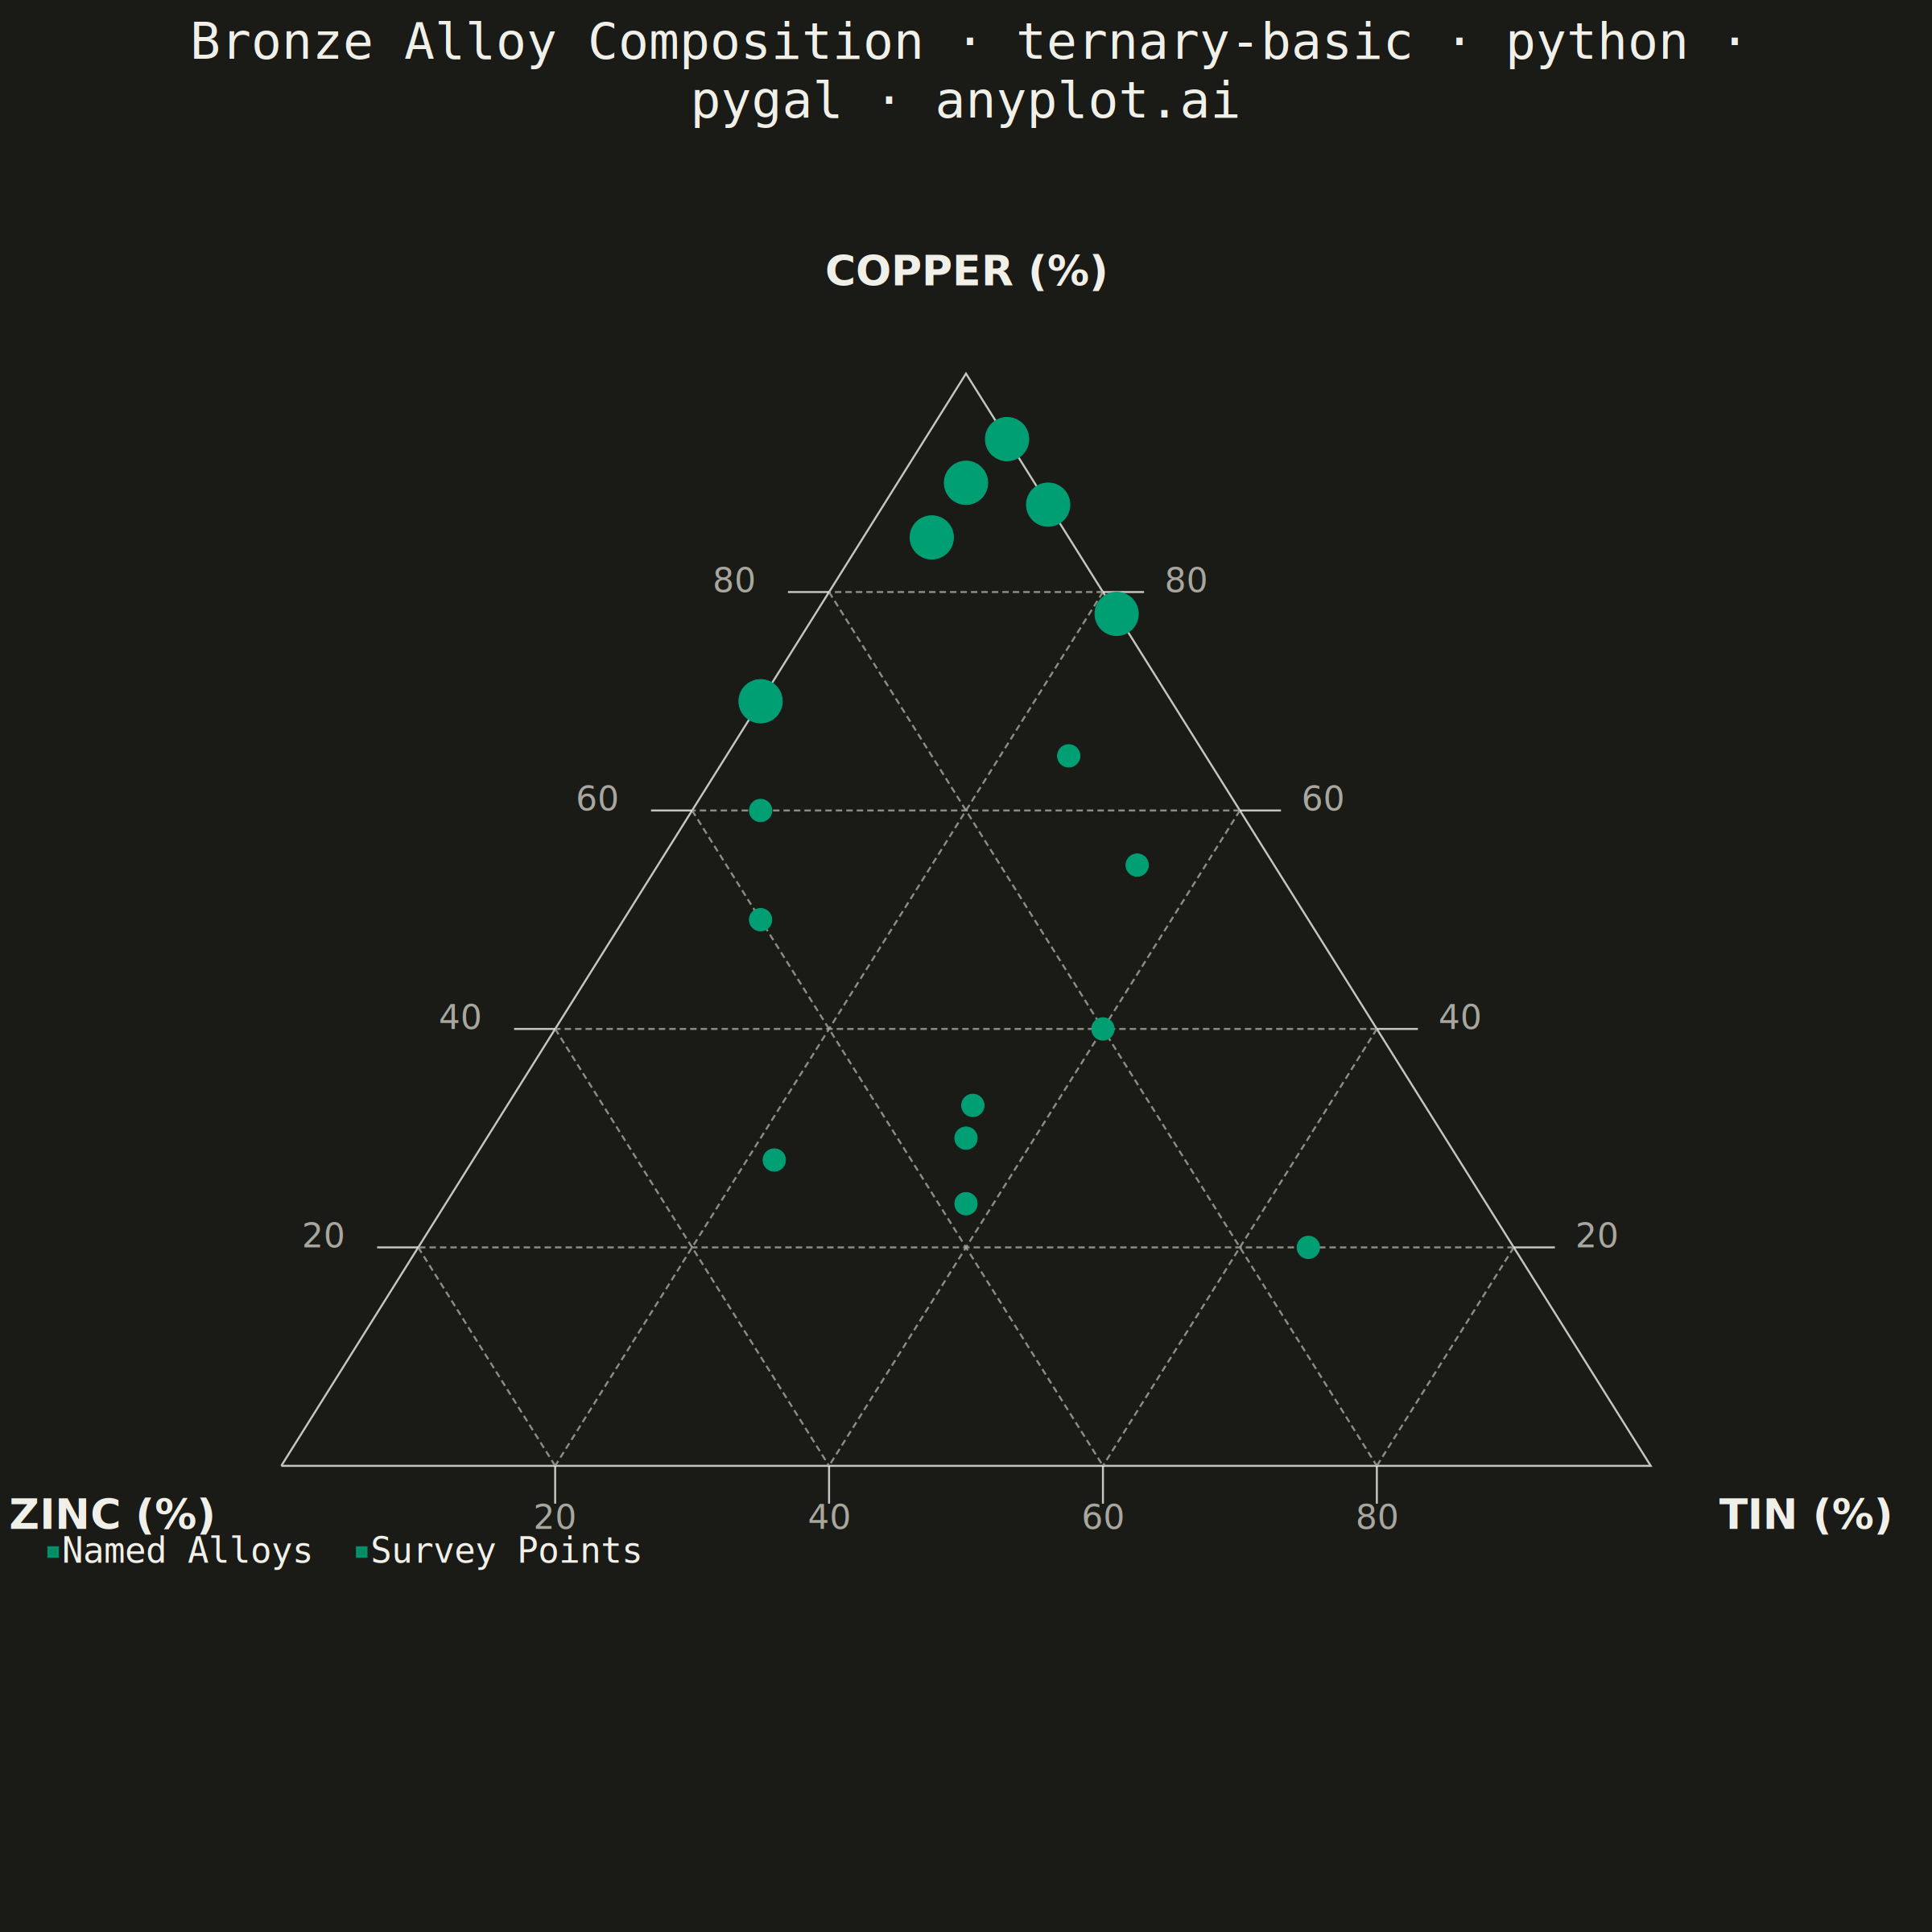
A ternary plot displays three-component compositional data on an equilateral triangle where each vertex represents 100% of one component. Points inside the triangle show compositions that sum to a constant total (usually 100%), with position indicating relative proportions. This visualization is essential for data where three variables are interdependent and constrained to sum to a fixed value.
""" anyplot.ai
ternary-basic: Basic Ternary Plot
Library: pygal 3.1.3 | Python 3.13.14
Quality: 92/100 | Updated: 2026-08-04
"""

import math
import os
import re

import cairosvg
import pygal
from pygal.style import Style


THEME = os.getenv("ANYPLOT_THEME", "light")
PAGE_BG = "#FAF8F1" if THEME == "light" else "#1A1A17"
INK = "#1A1A17" if THEME == "light" else "#F0EFE8"
INK_MUTED = "#6B6A63" if THEME == "light" else "#A8A79F"

IMPRINT_PALETTE = ("#009E73", "#C475FD", "#4467A3", "#BD8233", "#AE3030", "#2ABCCD", "#954477", "#99B314")
BRAND = IMPRINT_PALETTE[0]

H = math.sqrt(3) / 2

# (copper, tin, zinc) proportions, % — two groups so the plot can show a visual
# hierarchy: established named alloy families vs. exploratory interior points
# that survey the rest of the compositional space (a common ternary-diagram
# practice, distinct from a real commercial alloy).
named_compositions = [
    (88, 12, 0),  # traditional bronze
    (94, 6, 0),  # statuary bronze
    (78, 22, 0),  # bell bronze (bell metal)
    (90, 5, 5),  # gunmetal
    (85, 5, 10),  # admiralty gunmetal
    (70, 0, 30),  # cartridge brass
]
exploratory_compositions = [
    (60, 5, 35),
    (65, 25, 10),
    (55, 35, 10),
    (50, 10, 40),
    (33, 34, 33),
    (30, 35, 35),
    (24, 38, 38),
    (40, 40, 20),
    (20, 65, 15),
    (28, 22, 50),
]

# Barycentric (copper, tin, zinc) -> cartesian (x, y) on the unit equilateral triangle.
named_points = [(0.5 * (2 * s[1] + s[0]) / 100, H * s[0] / 100) for s in named_compositions]
exploratory_points = [(0.5 * (2 * s[1] + s[0]) / 100, H * s[0] / 100) for s in exploratory_compositions]

vertex_copper = (0.5, H)
vertex_tin = (1.0, 0.0)
vertex_zinc = (0.0, 0.0)

# Each entry is its own line segment — pygal's XY chart has no gap marker for a
# single series (a bare (None, None) point is silently dropped, not treated as a
# break, which would wrongly connect consecutive segments into one zig-zag path).
grid_segments = []
for pct in [0.2, 0.4, 0.6, 0.8]:
    grid_segments.append([(0.5 * (2 * (1 - pct) + pct), H * pct), (0.5 * pct, H * pct)])
    grid_segments.append([(0.5 * (2 * pct + (1 - pct)), H * (1 - pct)), (pct, 0.0)])
    grid_segments.append([(0.5 * (1 - pct), H * (1 - pct)), (0.5 * (2 * (1 - pct)), 0.0)])

tick_len = 0.03
tick_segments = []
for pct in [0.2, 0.4, 0.6, 0.8]:
    x_left, y_left = 0.5 * pct, H * pct
    tick_segments.append([(x_left, y_left), (x_left - tick_len, y_left)])

    x_right, y_right = 0.5 * (2 - pct), H * pct
    tick_segments.append([(x_right, y_right), (x_right + tick_len, y_right)])

    x_base = pct
    tick_segments.append([(x_base, 0.0), (x_base, -tick_len)])

title = "Bronze Alloy Composition · ternary-basic · python · pygal · anyplot.ai"
title_font_size = max(44, round(66 * min(1.0, 67 / len(title))))

# One chart.add() call per series (boundary, each grid segment, the two data
# groups, each tick segment) — Style.colors is indexed by that same series order.
series_colors = [INK] + [INK_MUTED] * len(grid_segments) + [BRAND, BRAND] + [INK] * len(tick_segments)

custom_style = Style(
    background=PAGE_BG,
    plot_background=PAGE_BG,
    foreground=INK,
    foreground_strong=INK,
    foreground_subtle=INK_MUTED,
    colors=tuple(series_colors),
    title_font_size=title_font_size,
    label_font_size=56,
    major_label_font_size=44,
    legend_font_size=44,
    value_font_size=36,
    stroke_width=2.5,
    opacity=0.85,
)

chart = pygal.XY(
    width=2400,
    height=2400,
    style=custom_style,
    show_legend=True,
    legend_at_bottom=True,
    show_x_guides=False,
    show_y_guides=False,
    show_x_labels=False,
    show_y_labels=False,
    x_title="",
    y_title="",
    title=title,
    stroke=False,
    include_x_axis=False,
    xrange=(-0.15, 1.15),
    yrange=(-0.20, 1.05),
    explicit_size=True,
    margin_top=290,
    margin_right=50,
    margin_bottom=120,
    margin_left=50,
)

chart.add(
    None, [vertex_zinc, vertex_tin, vertex_copper, vertex_zinc], stroke=True, show_dots=False, stroke_style={"width": 4}
)

for segment in grid_segments:
    chart.add(None, segment, stroke=True, show_dots=False, stroke_style={"width": 1.5, "dasharray": "8,5"})

# Larger dots for named alloy families, smaller for exploratory survey points —
# a size-based hierarchy (same brand color, so palette compliance is untouched
# and both groups stay theme-invariant) that makes the two-category story in
# the data visible in the image itself.
chart.add("Named Alloys", named_points, stroke=False, dots_size=27)
chart.add("Survey Points", exploratory_points, stroke=False, dots_size=14)

for segment in tick_segments:
    chart.add(None, segment, stroke=True, show_dots=False, stroke_style={"width": 2.5})

svg_content = chart.render().decode("utf-8")

# Derive the exact data-space -> pixel-space affine transform from the boundary
# triangle pygal already rendered (serie-0), instead of hand-calibrating offsets.
# The series live inside a translated <g> ("plot overlay"); its offset must be
# folded in since the labels below are inserted as untransformed top-level SVG.
overlay_dx, overlay_dy = (
    float(v) for v in re.search(r'translate\(([\d.\-]+), ?([\d.\-]+)\)"\s*class="plot overlay"', svg_content).groups()
)

boundary_segment = svg_content[
    svg_content.index('<g class="series serie-0') : svg_content.index('<g class="series serie-1')
]
path_d = re.search(r'<path d="([^"]+)"', boundary_segment).group(1)
zinc_px, tin_px, copper_px, _ = re.findall(r"(-?\d+\.\d+) (-?\d+\.\d+)", path_d)
zinc_px = tuple(float(v) for v in zinc_px)
tin_px = tuple(float(v) for v in tin_px)
copper_px = tuple(float(v) for v in copper_px)

origin_x, origin_y = zinc_px[0] + overlay_dx, zinc_px[1] + overlay_dy
scale_x = tin_px[0] - zinc_px[0]
scale_y = (zinc_px[1] - copper_px[1]) / H


def to_px(x, y):
    return origin_x + scale_x * x, origin_y - scale_y * y


vertex_labels = [
    ("COPPER (%)", (0.5, H + 0.07), "middle"),
    ("TIN (%)", (1.0 + 0.05, -0.05), "start"),
    ("ZINC (%)", (0.0 - 0.05, -0.05), "end"),
]

vertex_labels_svg = ""
for name, (x, y), anchor in vertex_labels:
    px, py = to_px(x, y)
    vertex_labels_svg += (
        f'  <text x="{px:.1f}" y="{py:.1f}" text-anchor="{anchor}" font-size="52" '
        f'font-weight="bold" fill="{INK}" font-family="sans-serif">{name}</text>\n'
    )

pct_labels_svg = ""
for pct in [20, 40, 60, 80]:
    frac = pct / 100.0

    px, py = to_px(0.5 * frac - 0.055, H * frac)
    pct_labels_svg += (
        f'  <text x="{px:.1f}" y="{py:.1f}" text-anchor="end" font-size="42" '
        f'fill="{INK_MUTED}" font-family="sans-serif">{pct}</text>\n'
    )

    px, py = to_px(0.5 * (2 - frac) + 0.045, H * frac)
    pct_labels_svg += (
        f'  <text x="{px:.1f}" y="{py:.1f}" text-anchor="start" font-size="42" '
        f'fill="{INK_MUTED}" font-family="sans-serif">{pct}</text>\n'
    )

    px, py = to_px(frac, -0.05)
    pct_labels_svg += (
        f'  <text x="{px:.1f}" y="{py:.1f}" text-anchor="middle" font-size="42" '
        f'fill="{INK_MUTED}" font-family="sans-serif">{pct}</text>\n'
    )

svg_content = svg_content.replace("</svg>", vertex_labels_svg + pct_labels_svg + "</svg>")

with open(f"plot-{THEME}.html", "w") as f:
    f.write(svg_content)

cairosvg.svg2png(bytestring=svg_content.encode("utf-8"), write_to=f"plot-{THEME}.png")
Runnable source as JSON, for any HTTP client: https://api.anyplot.ai/specs/ternary-basic/pygal/code. Any spec id and library id listed in llms-full.txt fit the same URL shape; every URL below is complete and callable.
{
  "spec_id": "ternary-basic",
  "language": "python",
  "library": "pygal",
  "page": "https://anyplot.ai/ternary-basic/python/pygal",
  "hub": "https://anyplot.ai/ternary-basic",
  "code_json": "https://api.anyplot.ai/specs/ternary-basic/pygal/code",
  "spec_json": "https://api.anyplot.ai/specs/ternary-basic",
  "render_light_png": "https://storage.googleapis.com/anyplot-images/plots/ternary-basic/python/pygal/plot-light.png",
  "render_dark_png": "https://storage.googleapis.com/anyplot-images/plots/ternary-basic/python/pygal/plot-dark.png",
  "interactive_light_html": "https://storage.googleapis.com/anyplot-images/plots/ternary-basic/python/pygal/plot-light.html",
  "interactive_dark_html": "https://storage.googleapis.com/anyplot-images/plots/ternary-basic/python/pygal/plot-dark.html",
  "quality_score": 92.0,
  "license": "MIT",
  "guide": "https://anyplot.ai/llms.txt"
}
Part of Basic Ternary Plot on anyplot.ai.