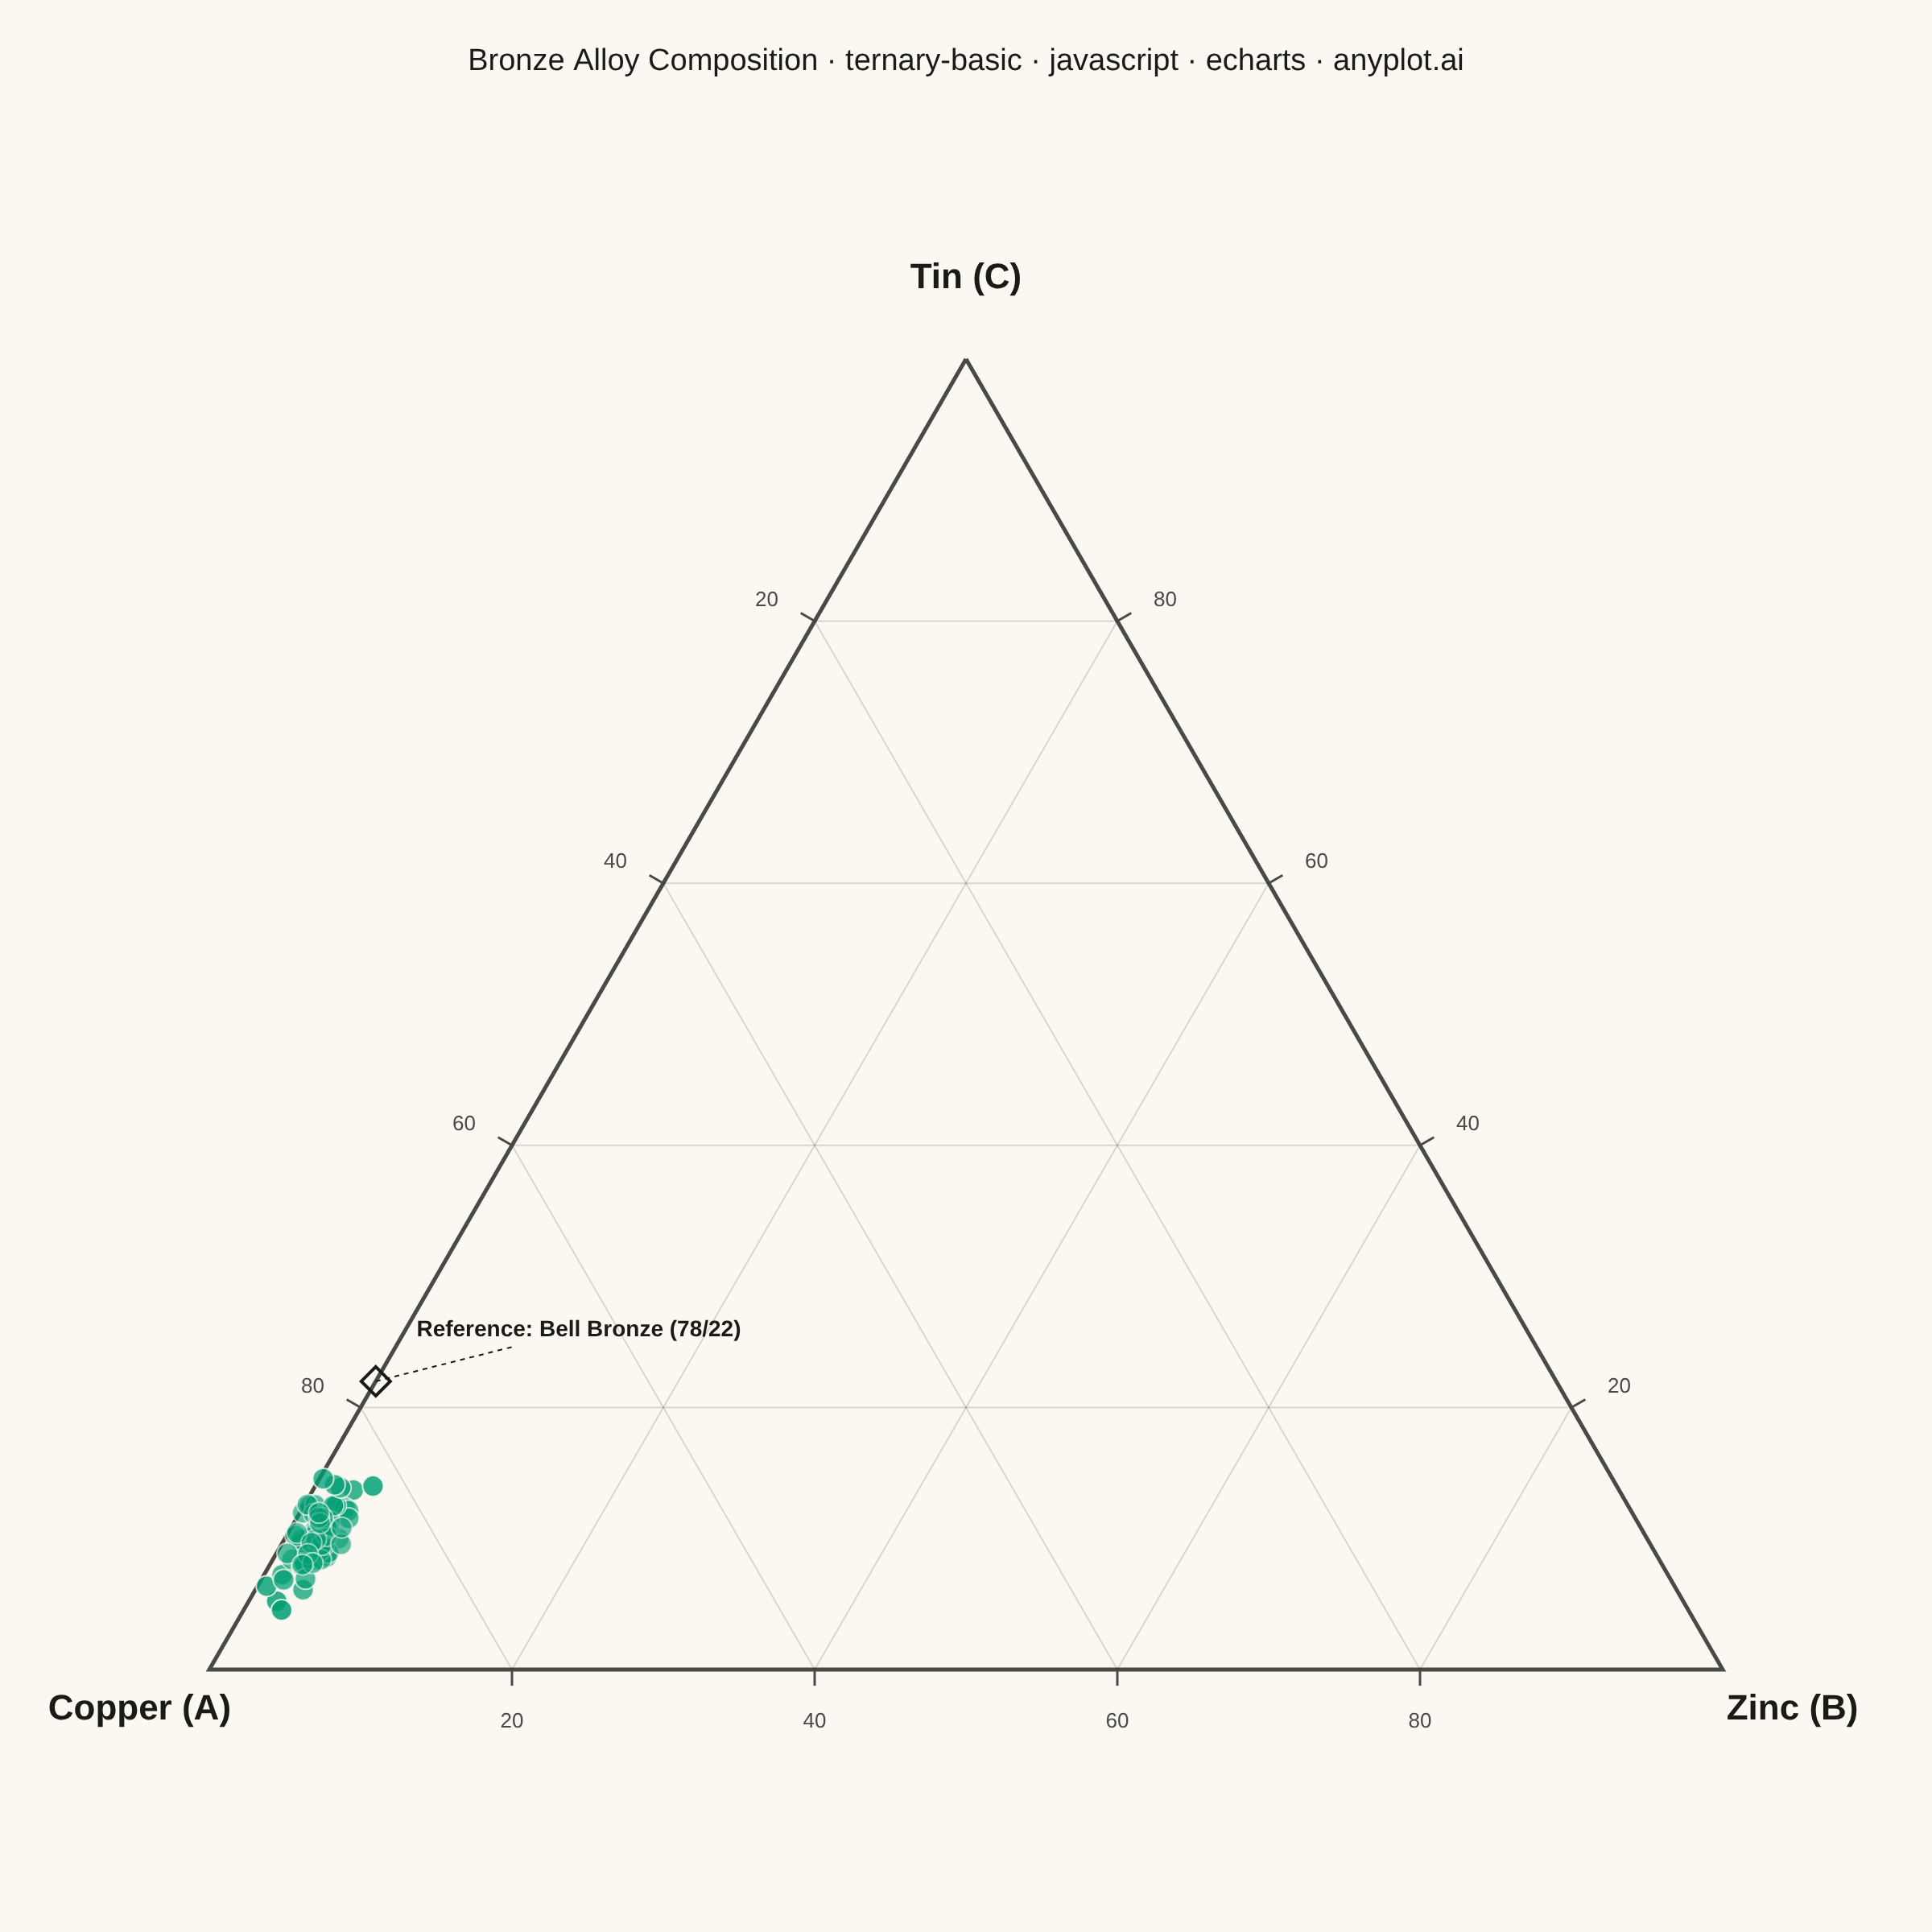
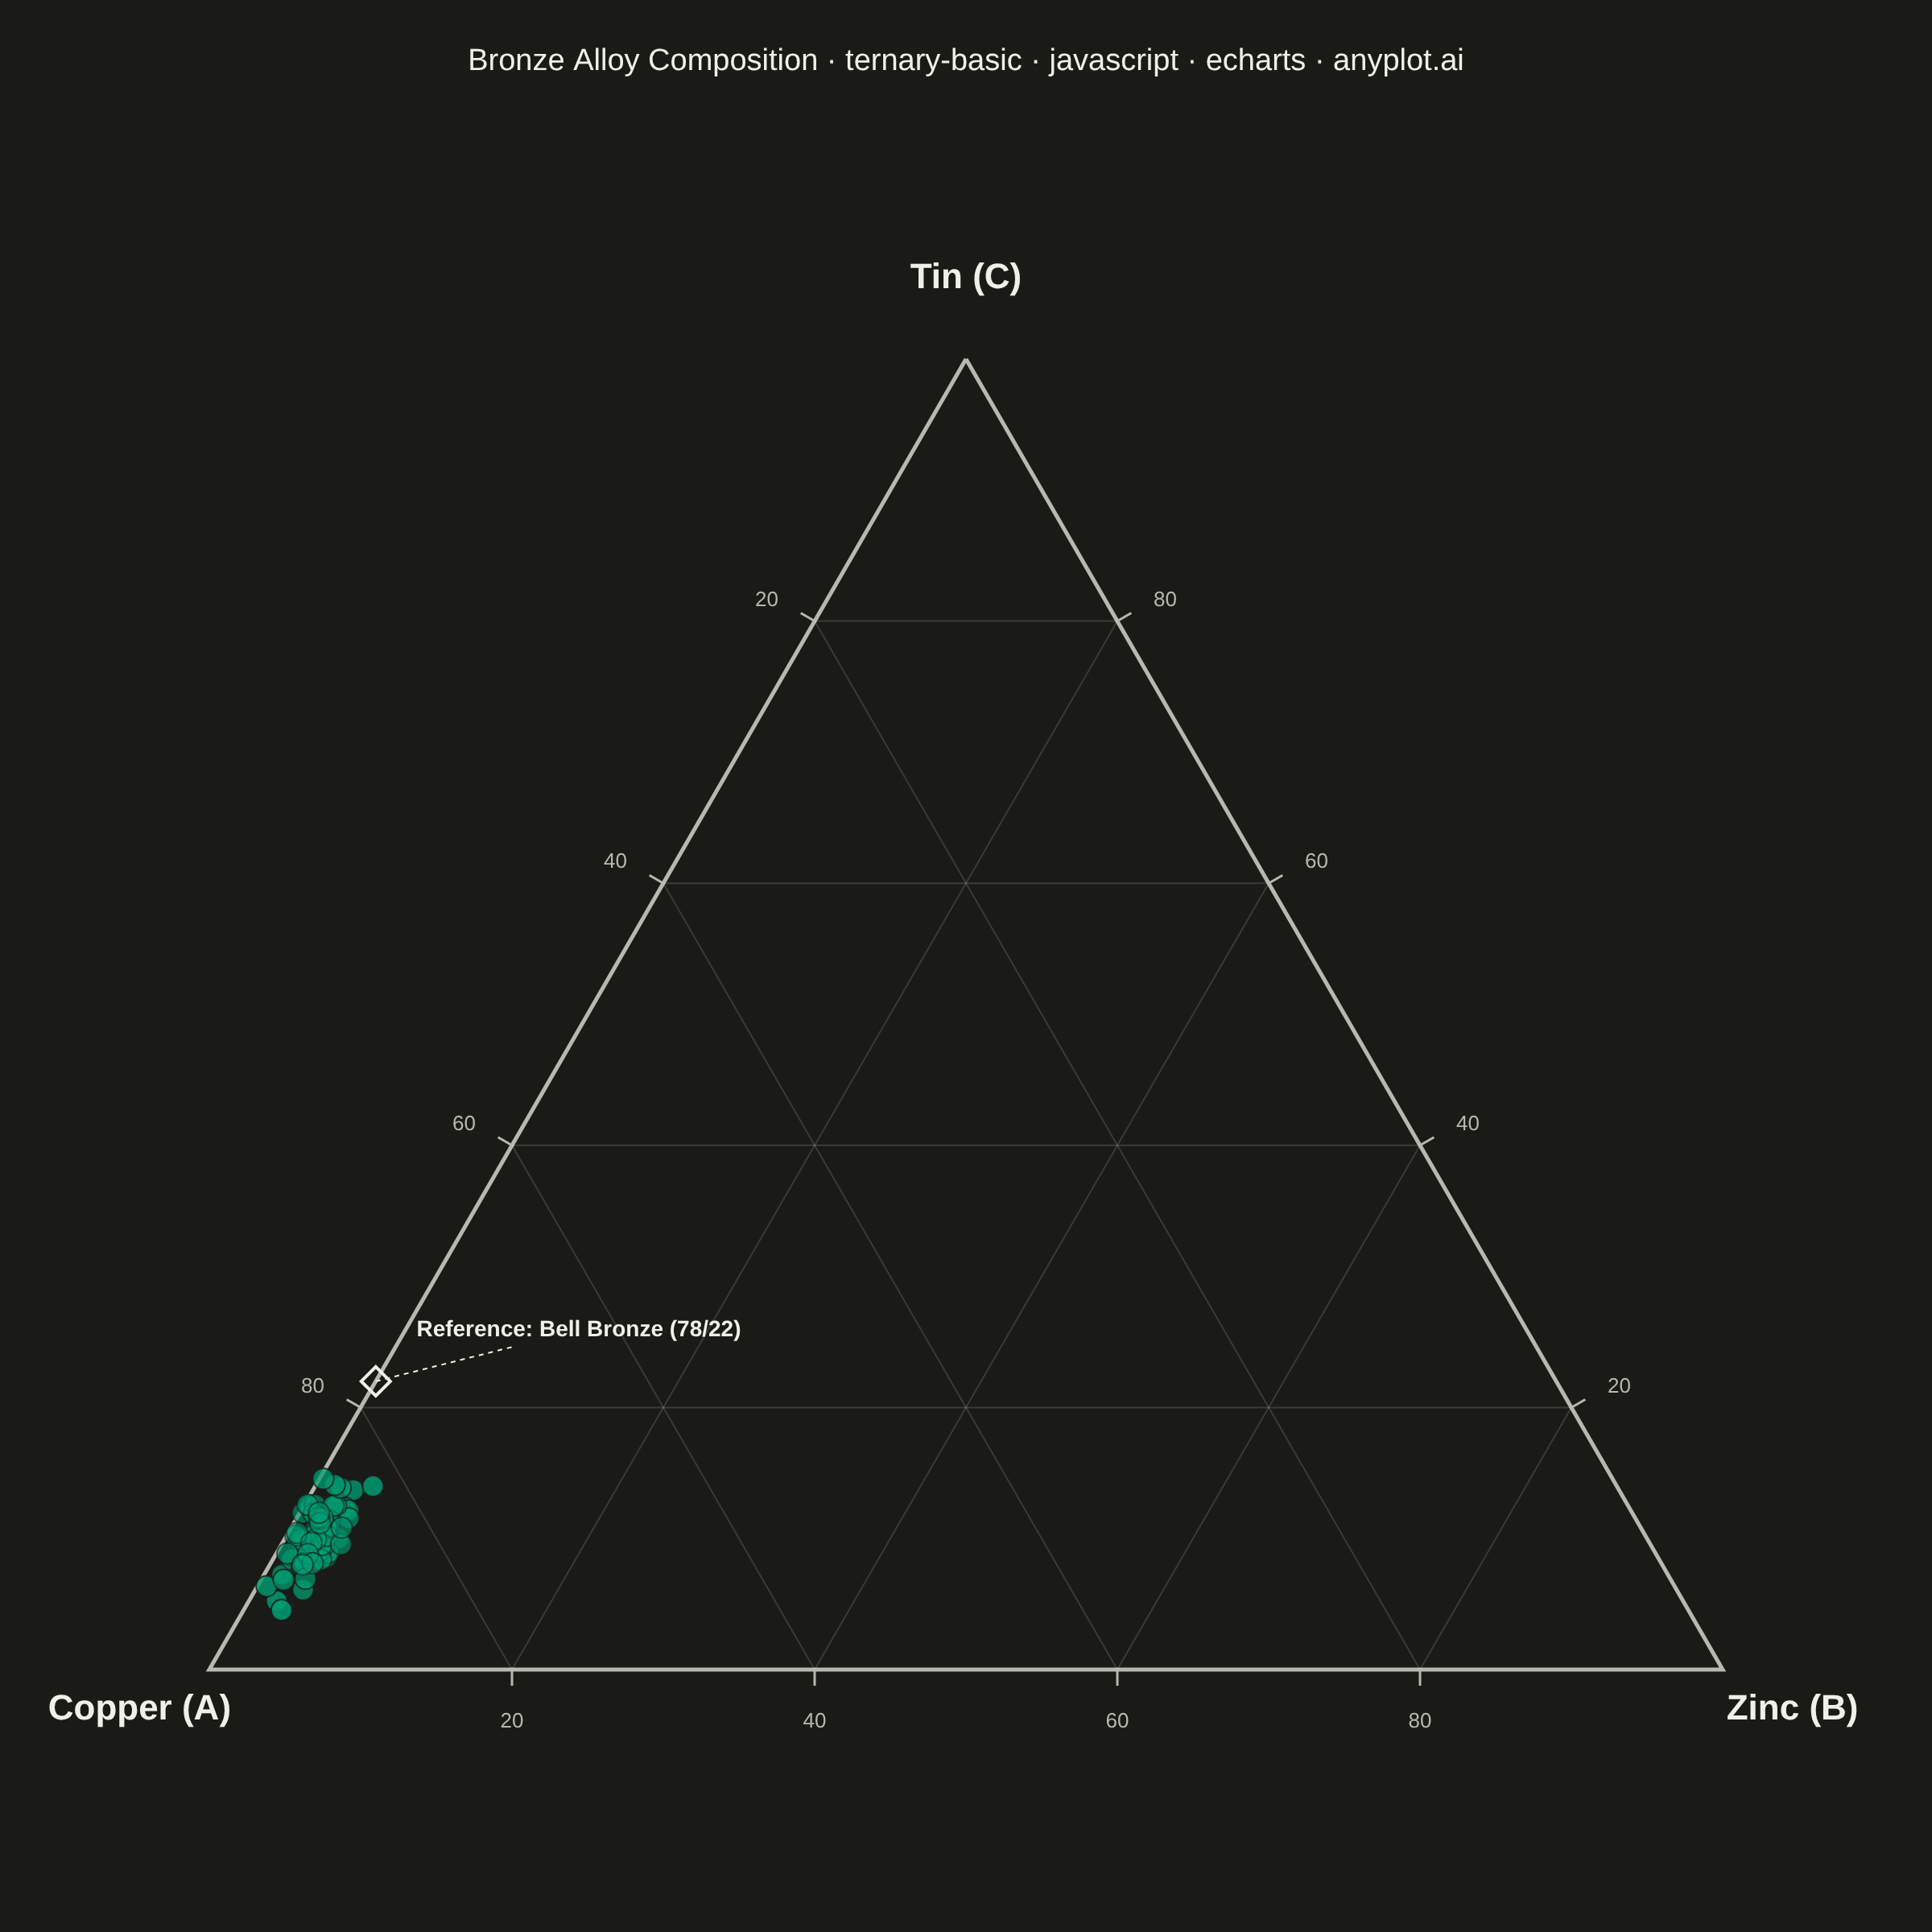
A ternary plot displays three-component compositional data on an equilateral triangle where each vertex represents 100% of one component. Points inside the triangle show compositions that sum to a constant total (usually 100%), with position indicating relative proportions. This visualization is essential for data where three variables are interdependent and constrained to sum to a fixed value.
// anyplot.ai
// ternary-basic: Basic Ternary Plot
// Library: echarts 6.1.0 | JavaScript 22.23.1
// Quality: 88/100 | Created: 2026-08-04

//# anyplot-orientation: square

// ECharts has no built-in ternary coordinate system, so the triangle, grid
// lines, and tick/vertex labels are laid out here as plain pixel geometry
// (barycentric -> Cartesian) and drawn with the `graphic` component. Data
// points still go through a real (coordinate-less) `custom` series so
// tooltip/hover stay genuinely interactive in the emitted HTML.

const t = window.ANYPLOT_TOKENS;
const size = window.ANYPLOT_SIZE;

// --- Data: bronze alloy samples (Copper / Zinc / Tin, % by mass) -----------
function makeRng(seed) {
  let s = seed >>> 0;
  return function () {
    s = (s * 1664525 + 1013904223) >>> 0;
    return s / 4294967296;
  };
}
const rng = makeRng(42);
function gaussian() {
  const u1 = Math.max(rng(), 1e-6);
  const u2 = rng();
  return Math.sqrt(-2 * Math.log(u1)) * Math.cos(2 * Math.PI * u2);
}

// Realistic 88/2/10 Cu-Zn-Sn bronze (copper-dominant, trace zinc, tin secondary)
const centerCopper = 88;
const centerZinc = 2;
const centerTin = 10;
const samples = [];
for (let i = 0; i < 70; i++) {
  let copper = Math.max(centerCopper + gaussian() * 3, 70);
  let zinc = Math.max(centerZinc + gaussian() * 1, 0.2);
  let tin = Math.max(centerTin + gaussian() * 2.5, 0.5);
  const total = copper + zinc + tin;
  samples.push([(copper / total) * 100, (zinc / total) * 100, (tin / total) * 100]);
}

// Density cue: points near the batch mean get lower opacity (reduces overlap
// in the dense core), points further out read more opaque (highlights outliers).
const meanA = samples.reduce((s, p) => s + p[0], 0) / samples.length;
const meanB = samples.reduce((s, p) => s + p[1], 0) / samples.length;
const meanC = samples.reduce((s, p) => s + p[2], 0) / samples.length;
const sampleDists = samples.map((p) => Math.hypot(p[0] - meanA, p[1] - meanB, p[2] - meanC));
const maxDist = Math.max(...sampleDists) || 1;

// --- Triangle geometry (pixel space, apex-up) -------------------------------
const marginTop = 170;
const marginBottom = 110;
const marginSide = 130;
const availW = size.width - 2 * marginSide;
const availH = size.height - marginTop - marginBottom;
const sideLen = Math.min(availW, availH / (Math.sqrt(3) / 2));
const triHeight = sideLen * (Math.sqrt(3) / 2);
const top = marginTop + (availH - triHeight) / 2;
const bottom = top + triHeight;
const cx = size.width / 2;
const left = cx - sideLen / 2;
const right = cx + sideLen / 2;

const APEX = { x: cx, y: top }; // component_c = 100
const BL = { x: left, y: bottom }; // component_a = 100
const BR = { x: right, y: bottom }; // component_b = 100
const centroid = { x: (APEX.x + BL.x + BR.x) / 3, y: (APEX.y + BL.y + BR.y) / 3 };

function ternaryToPixel(a, b, c) {
  return {
    x: (a * BL.x + b * BR.x + c * APEX.x) / 100,
    y: (a * BL.y + b * BR.y + c * APEX.y) / 100,
  };
}

function outward(point, edgeP1, edgeP2, dist) {
  let nx = -(edgeP2.y - edgeP1.y);
  let ny = edgeP2.x - edgeP1.x;
  const len = Math.hypot(nx, ny) || 1;
  nx /= len;
  ny /= len;
  if (nx * (centroid.x - point.x) + ny * (centroid.y - point.y) > 0) {
    nx = -nx;
    ny = -ny;
  }
  return { x: point.x + nx * dist, y: point.y + ny * dist };
}

// --- Grid lines at 20% intervals + edge tick marks/labels -------------------
const levels = [20, 40, 60, 80];
const gridLineShapes = [];
const tickElements = [];

levels.forEach((L) => {
  const constA = [ternaryToPixel(L, 100 - L, 0), ternaryToPixel(L, 0, 100 - L)];
  const constB = [ternaryToPixel(100 - L, L, 0), ternaryToPixel(0, L, 100 - L)];
  const constC = [ternaryToPixel(100 - L, 0, L), ternaryToPixel(0, 100 - L, L)];
  gridLineShapes.push(constA, constB, constC);

  // Left edge: component_a ticks
  const aPoint = ternaryToPixel(L, 0, 100 - L);
  const aLabelPos = outward(aPoint, APEX, BL, 26);
  tickElements.push(
    { type: "line", shape: { x1: aPoint.x, y1: aPoint.y, x2: outward(aPoint, APEX, BL, 10).x, y2: outward(aPoint, APEX, BL, 10).y }, style: { stroke: t.inkSoft, lineWidth: 1.5 } },
    { type: "text", style: { text: String(L), x: aLabelPos.x, y: aLabelPos.y, fill: t.inkSoft, fontSize: 13, align: "right", verticalAlign: "middle" } },
  );

  // Bottom edge: component_b ticks
  const bPoint = ternaryToPixel(100 - L, L, 0);
  const bLabelPos = outward(bPoint, BL, BR, 26);
  tickElements.push(
    { type: "line", shape: { x1: bPoint.x, y1: bPoint.y, x2: outward(bPoint, BL, BR, 10).x, y2: outward(bPoint, BL, BR, 10).y }, style: { stroke: t.inkSoft, lineWidth: 1.5 } },
    { type: "text", style: { text: String(L), x: bLabelPos.x, y: bLabelPos.y, fill: t.inkSoft, fontSize: 13, align: "center", verticalAlign: "top" } },
  );

  // Right edge: component_c ticks
  const cPoint = ternaryToPixel(0, 100 - L, L);
  const cLabelPos = outward(cPoint, BR, APEX, 26);
  tickElements.push(
    { type: "line", shape: { x1: cPoint.x, y1: cPoint.y, x2: outward(cPoint, BR, APEX, 10).x, y2: outward(cPoint, BR, APEX, 10).y }, style: { stroke: t.inkSoft, lineWidth: 1.5 } },
    { type: "text", style: { text: String(L), x: cLabelPos.x, y: cLabelPos.y, fill: t.inkSoft, fontSize: 13, align: "left", verticalAlign: "middle" } },
  );
});

// --- Vertex labels ------------------------------------------------------
const vertexLabels = [
  { point: APEX, edgeA: BR, edgeB: BL, text: "Tin (C)" },
  { point: BL, edgeA: APEX, edgeB: BR, text: "Copper (A)" },
  { point: BR, edgeA: BL, edgeB: APEX, text: "Zinc (B)" },
].map(({ point, text }) => {
  const dir = { x: point.x - centroid.x, y: point.y - centroid.y };
  const len = Math.hypot(dir.x, dir.y) || 1;
  const pos = { x: point.x + (dir.x / len) * 50, y: point.y + (dir.y / len) * 50 };
  return {
    type: "text",
    style: { text, x: pos.x, y: pos.y, fill: t.ink, fontSize: 22, fontWeight: 600, align: "center", verticalAlign: "middle" },
  };
});

// --- Reference marker: bell-bronze target composition (higher-tin family, -----
// well clear of the statuary-bronze sample cluster) for a real point of comparison
const target = { a: 78, b: 0, c: 22 }; // Cu 78% / Sn 22% — classic bell bronze
const targetPx = ternaryToPixel(target.a, target.b, target.c);
const towardCentroid = { x: centroid.x - targetPx.x, y: centroid.y - targetPx.y };
const towardLen = Math.hypot(towardCentroid.x, towardCentroid.y) || 1;
const targetLeaderEnd = {
  x: targetPx.x + (towardCentroid.x / towardLen) * 90,
  y: targetPx.y + (towardCentroid.y / towardLen) * 90,
};
const targetLabelPos = {
  x: targetPx.x + (towardCentroid.x / towardLen) * 130,
  y: targetPx.y + (towardCentroid.y / towardLen) * 130,
};
const referenceMarker = [
  {
    type: "polygon",
    shape: {
      points: [
        [targetPx.x, targetPx.y - 9],
        [targetPx.x + 9, targetPx.y],
        [targetPx.x, targetPx.y + 9],
        [targetPx.x - 9, targetPx.y],
      ],
    },
    style: { stroke: t.ink, lineWidth: 2, fill: "transparent" },
  },
  {
    type: "line",
    shape: { x1: targetPx.x, y1: targetPx.y, x2: targetLeaderEnd.x, y2: targetLeaderEnd.y },
    style: { stroke: t.ink, lineWidth: 1, lineDash: [3, 3] },
  },
  {
    type: "text",
    style: {
      text: "Reference: Bell Bronze (78/22)",
      x: targetLabelPos.x,
      y: targetLabelPos.y,
      fill: t.ink,
      fontSize: 14,
      fontWeight: 600,
      align: "center",
      verticalAlign: "middle",
    },
  },
];

// --- Title (fontsize scales down for titles longer than the 67-char baseline)
const title = "Bronze Alloy Composition · ternary-basic · javascript · echarts · anyplot.ai";
const titleFontSize = Math.round(22 * Math.min(1, 67 / title.length));

// --- Chart -------------------------------------------------------------
const chart = echarts.init(document.getElementById("container"));

chart.setOption({
  animation: false,
  backgroundColor: "transparent",
  title: {
    text: title,
    left: "center",
    top: 24,
    textStyle: { color: t.ink, fontSize: titleFontSize, fontWeight: 500 },
  },
  tooltip: {
    formatter: (params) => {
      const [copper, zinc, tin] = params.data;
      return `Copper ${copper.toFixed(1)}%<br/>Zinc ${zinc.toFixed(1)}%<br/>Tin ${tin.toFixed(1)}%`;
    },
  },
  graphic: {
    elements: [
      {
        type: "polyline",
        z: 1,
        shape: { points: [[APEX.x, APEX.y], [BL.x, BL.y], [BR.x, BR.y], [APEX.x, APEX.y]] },
        style: { stroke: t.inkSoft, lineWidth: 2.5, fill: "transparent" },
      },
      ...gridLineShapes.map(([p1, p2]) => ({
        type: "line",
        z: 1,
        shape: { x1: p1.x, y1: p1.y, x2: p2.x, y2: p2.y },
        style: { stroke: t.grid, lineWidth: 1 },
      })),
      ...tickElements.map((el) => ({ ...el, z: 1 })),
      ...vertexLabels.map((el) => ({ ...el, z: 1 })),
      ...referenceMarker.map((el) => ({ ...el, z: 3 })),
    ],
  },
  series: [
    {
      type: "custom",
      coordinateSystem: "none",
      z: 2,
      data: samples,
      renderItem: (params, api) => {
        const p = ternaryToPixel(api.value(0), api.value(1), api.value(2));
        const opacity = 0.5 + 0.35 * (sampleDists[params.dataIndex] / maxDist);
        return {
          type: "circle",
          shape: { cx: p.x, cy: p.y, r: 6.5 },
          style: { fill: t.palette[0], stroke: t.pageBg, lineWidth: 1, opacity },
        };
      },
    },
  ],
});
Runnable source as JSON, for any HTTP client: https://api.anyplot.ai/specs/ternary-basic/echarts/code. Any spec id and library id listed in llms-full.txt fit the same URL shape; every URL below is complete and callable.
{
  "spec_id": "ternary-basic",
  "language": "javascript",
  "library": "echarts",
  "page": "https://anyplot.ai/ternary-basic/javascript/echarts",
  "hub": "https://anyplot.ai/ternary-basic",
  "code_json": "https://api.anyplot.ai/specs/ternary-basic/echarts/code",
  "spec_json": "https://api.anyplot.ai/specs/ternary-basic",
  "render_light_png": "https://storage.googleapis.com/anyplot-images/plots/ternary-basic/javascript/echarts/plot-light.png",
  "render_dark_png": "https://storage.googleapis.com/anyplot-images/plots/ternary-basic/javascript/echarts/plot-dark.png",
  "interactive_light_html": "https://storage.googleapis.com/anyplot-images/plots/ternary-basic/javascript/echarts/plot-light.html",
  "interactive_dark_html": "https://storage.googleapis.com/anyplot-images/plots/ternary-basic/javascript/echarts/plot-dark.html",
  "quality_score": 88.0,
  "license": "MIT",
  "guide": "https://anyplot.ai/llms.txt"
}
Part of Basic Ternary Plot on anyplot.ai.