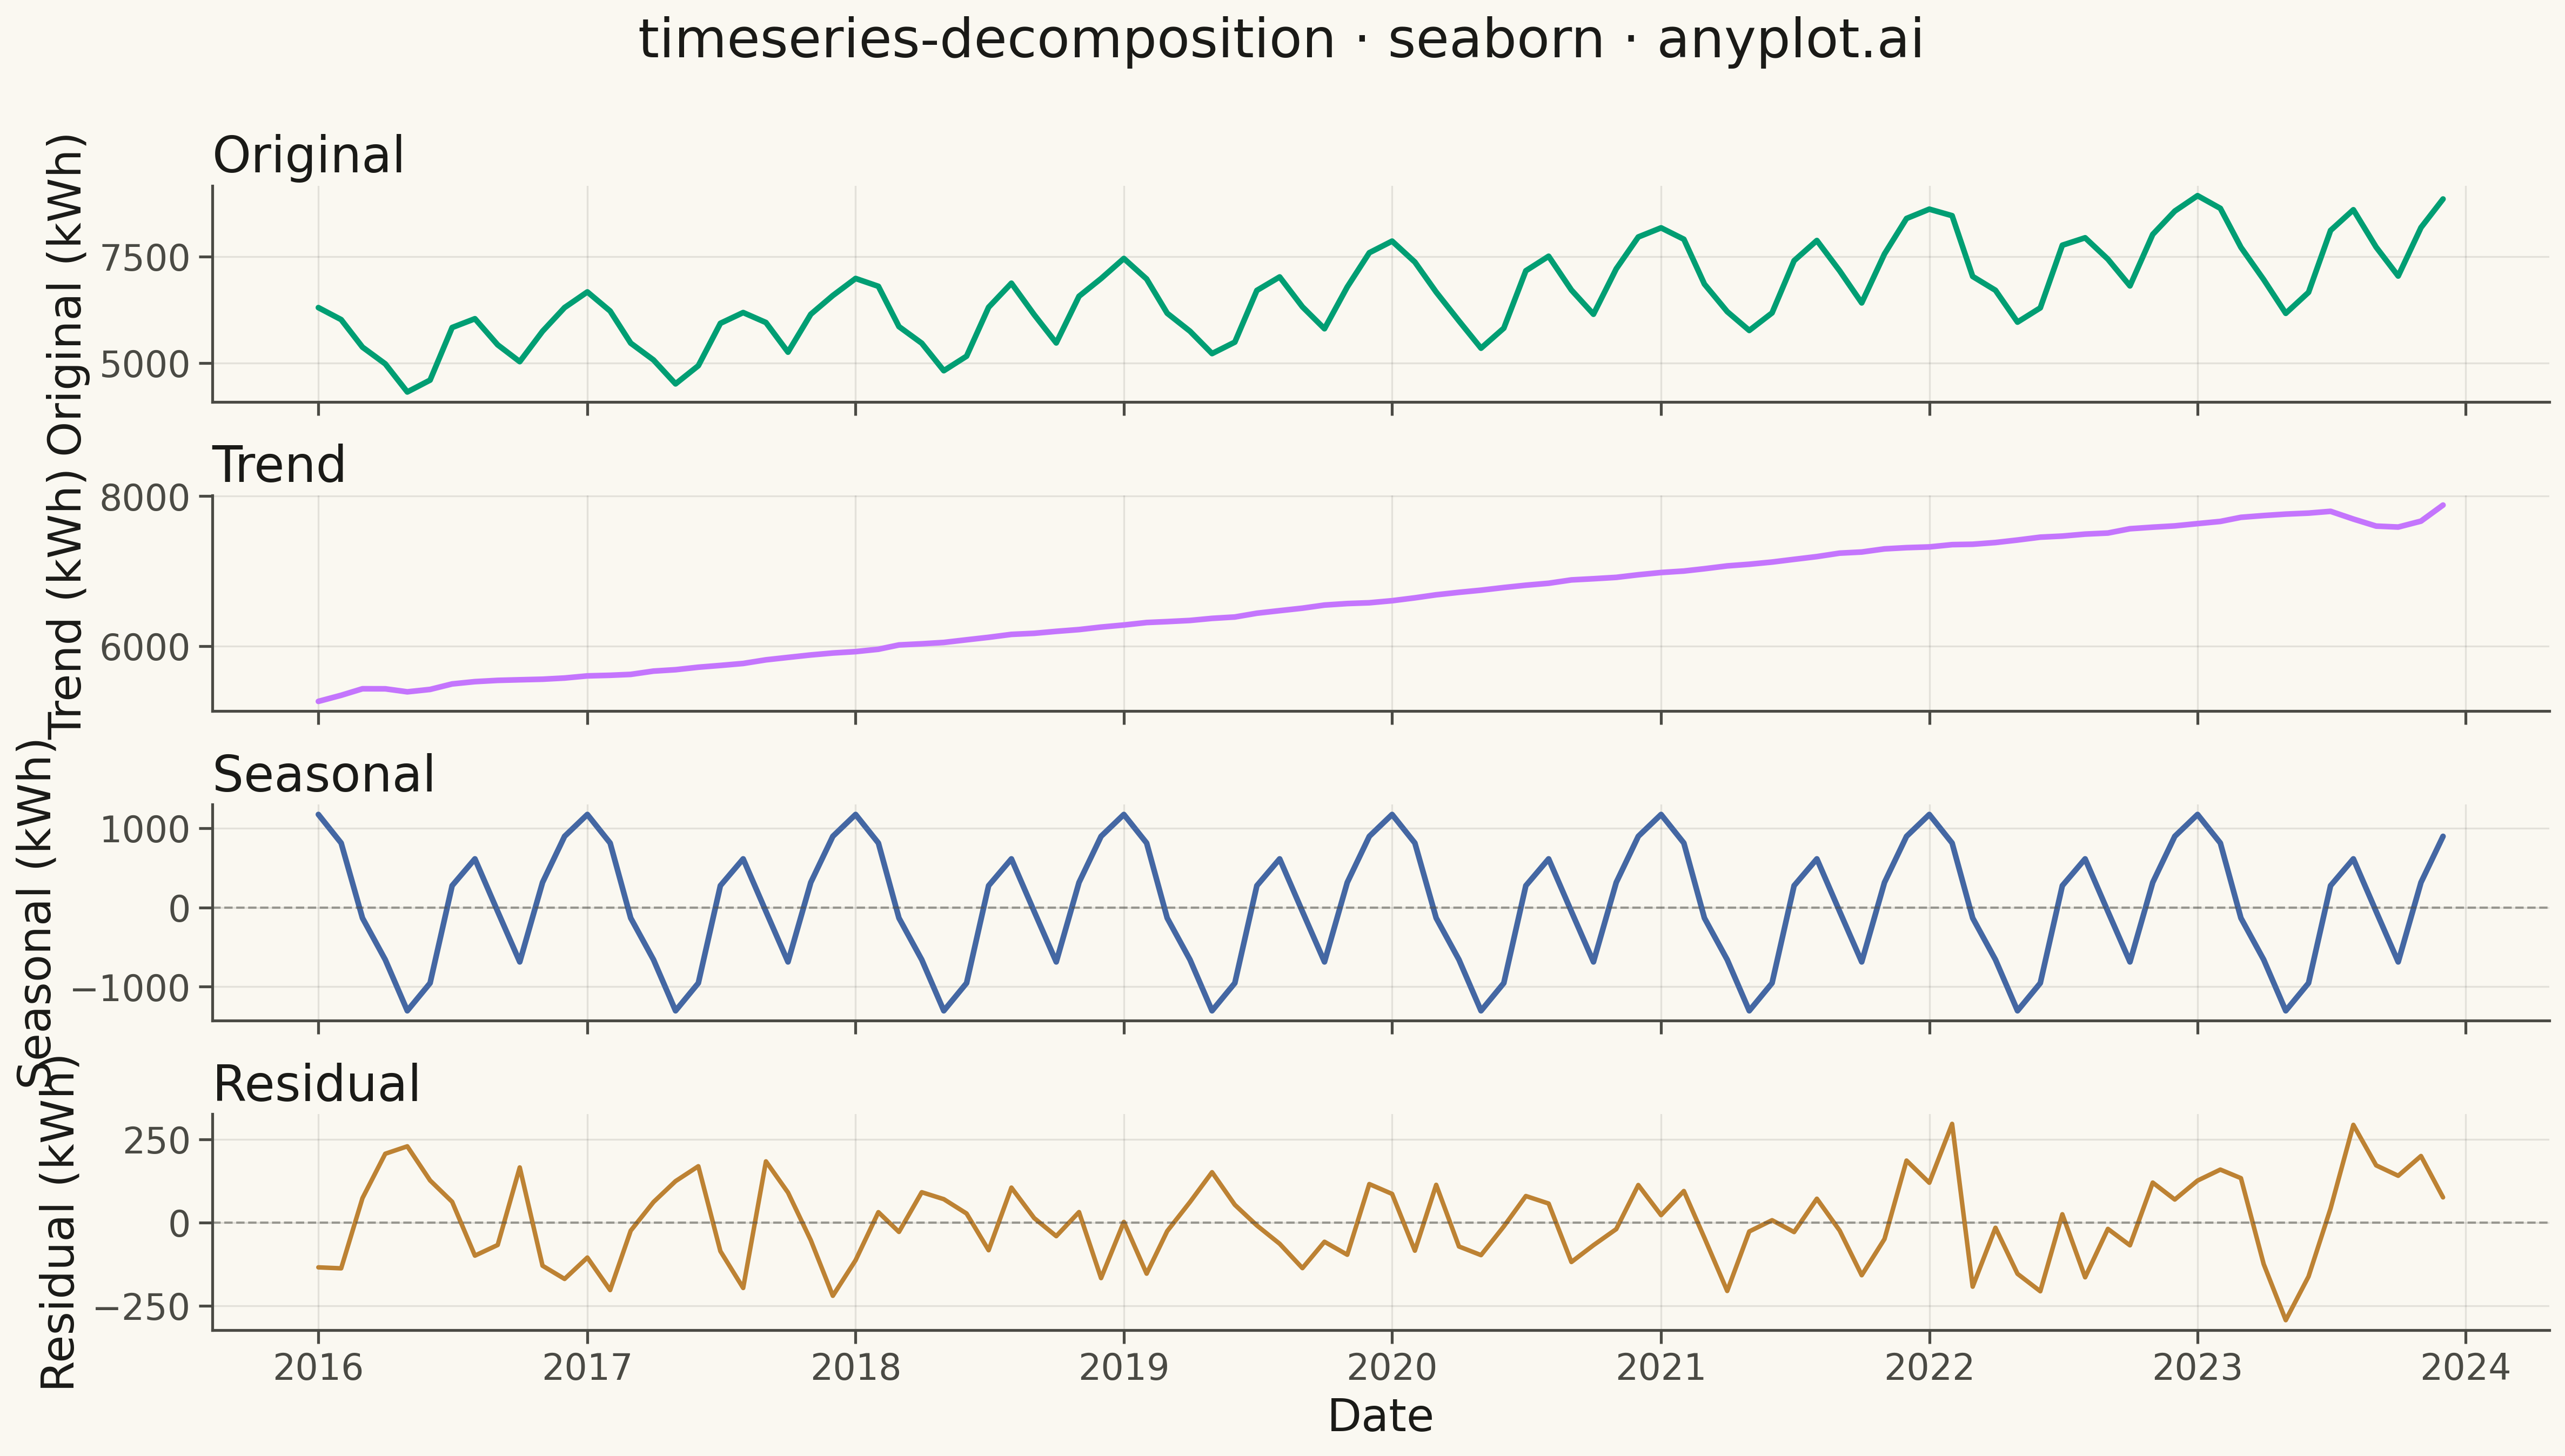
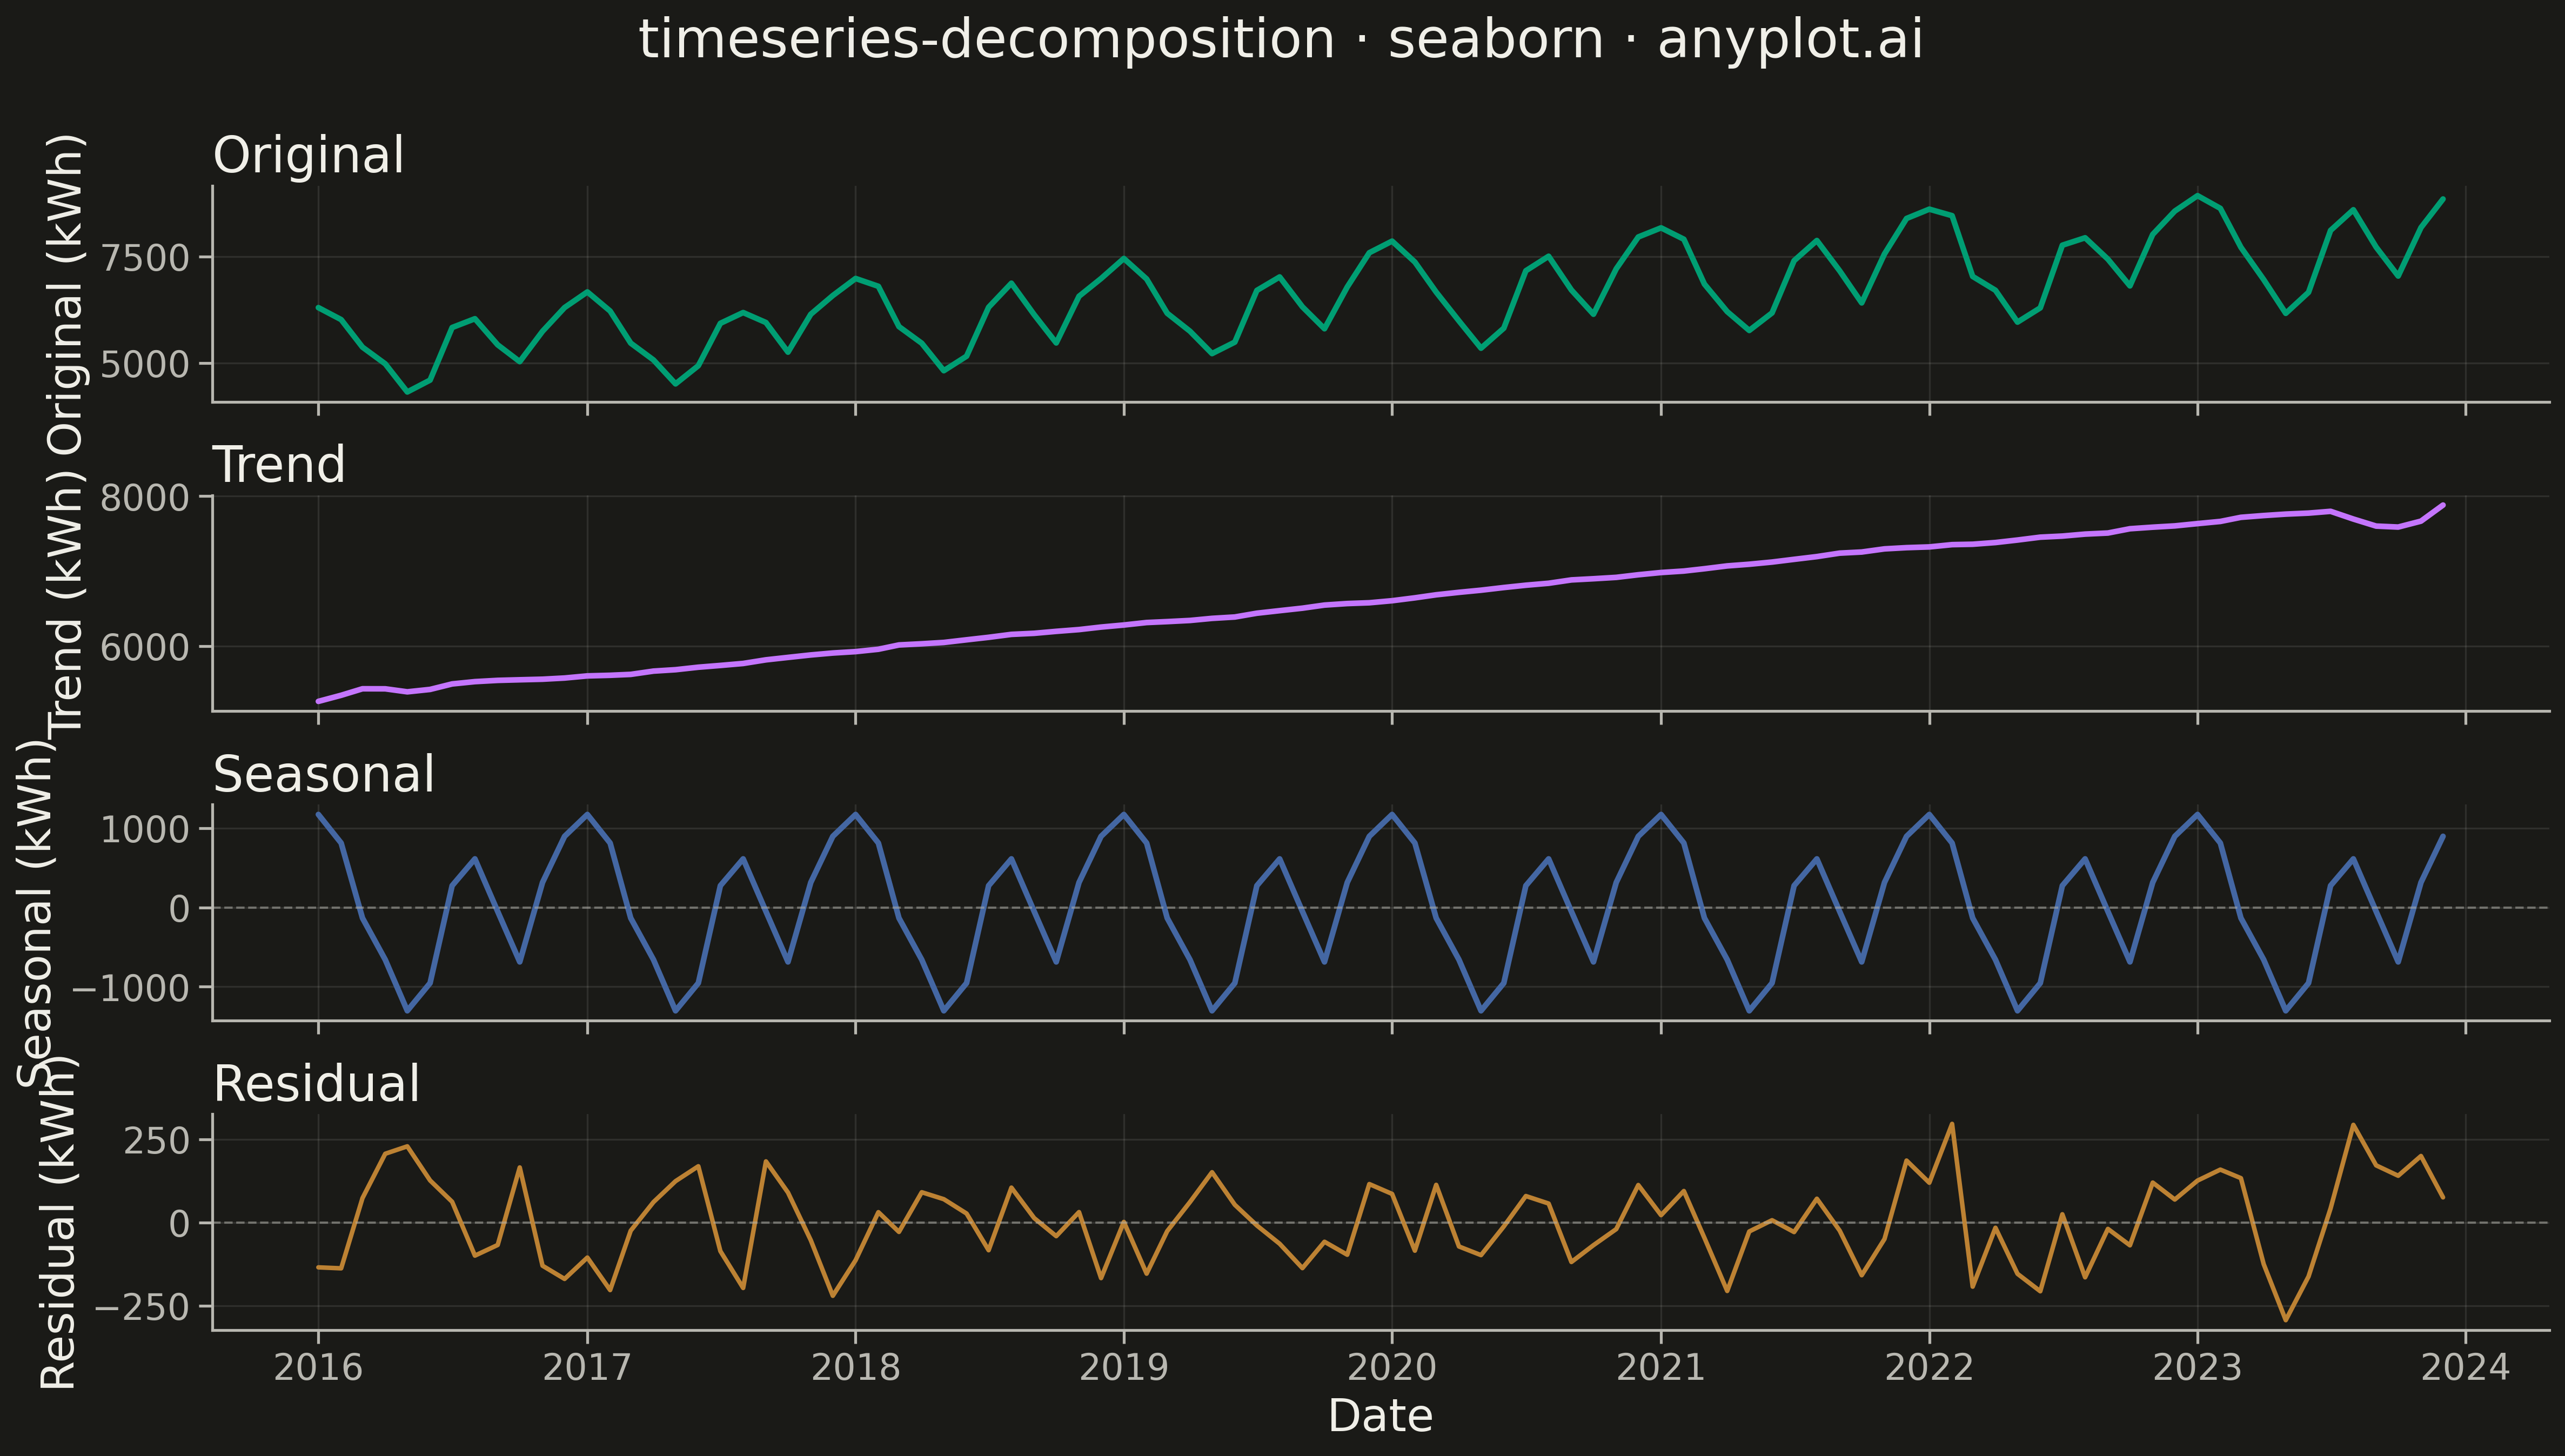
A time series decomposition plot displays a time series broken down into its constituent components: the original series, trend, seasonal pattern, and residual noise. Each component is shown as a separate subplot stacked vertically, sharing a common time axis. This visualization is essential for understanding the underlying structure of time series data and identifying patterns that may not be visible in the raw series.
Preview render from the Seaborn implementation.