The same plot in 14 other libraries — Python: Altair, Bokeh, lets-plot, Matplotlib, Plotly, plotnine, Pygal, Seaborn; R: ggplot2; JavaScript: Chart.js, D3.js, Apache ECharts, Highcharts, MUI X Charts. Compare all 15 side by side: Time Series Decomposition Plot in Python, R, Julia and JavaScript.
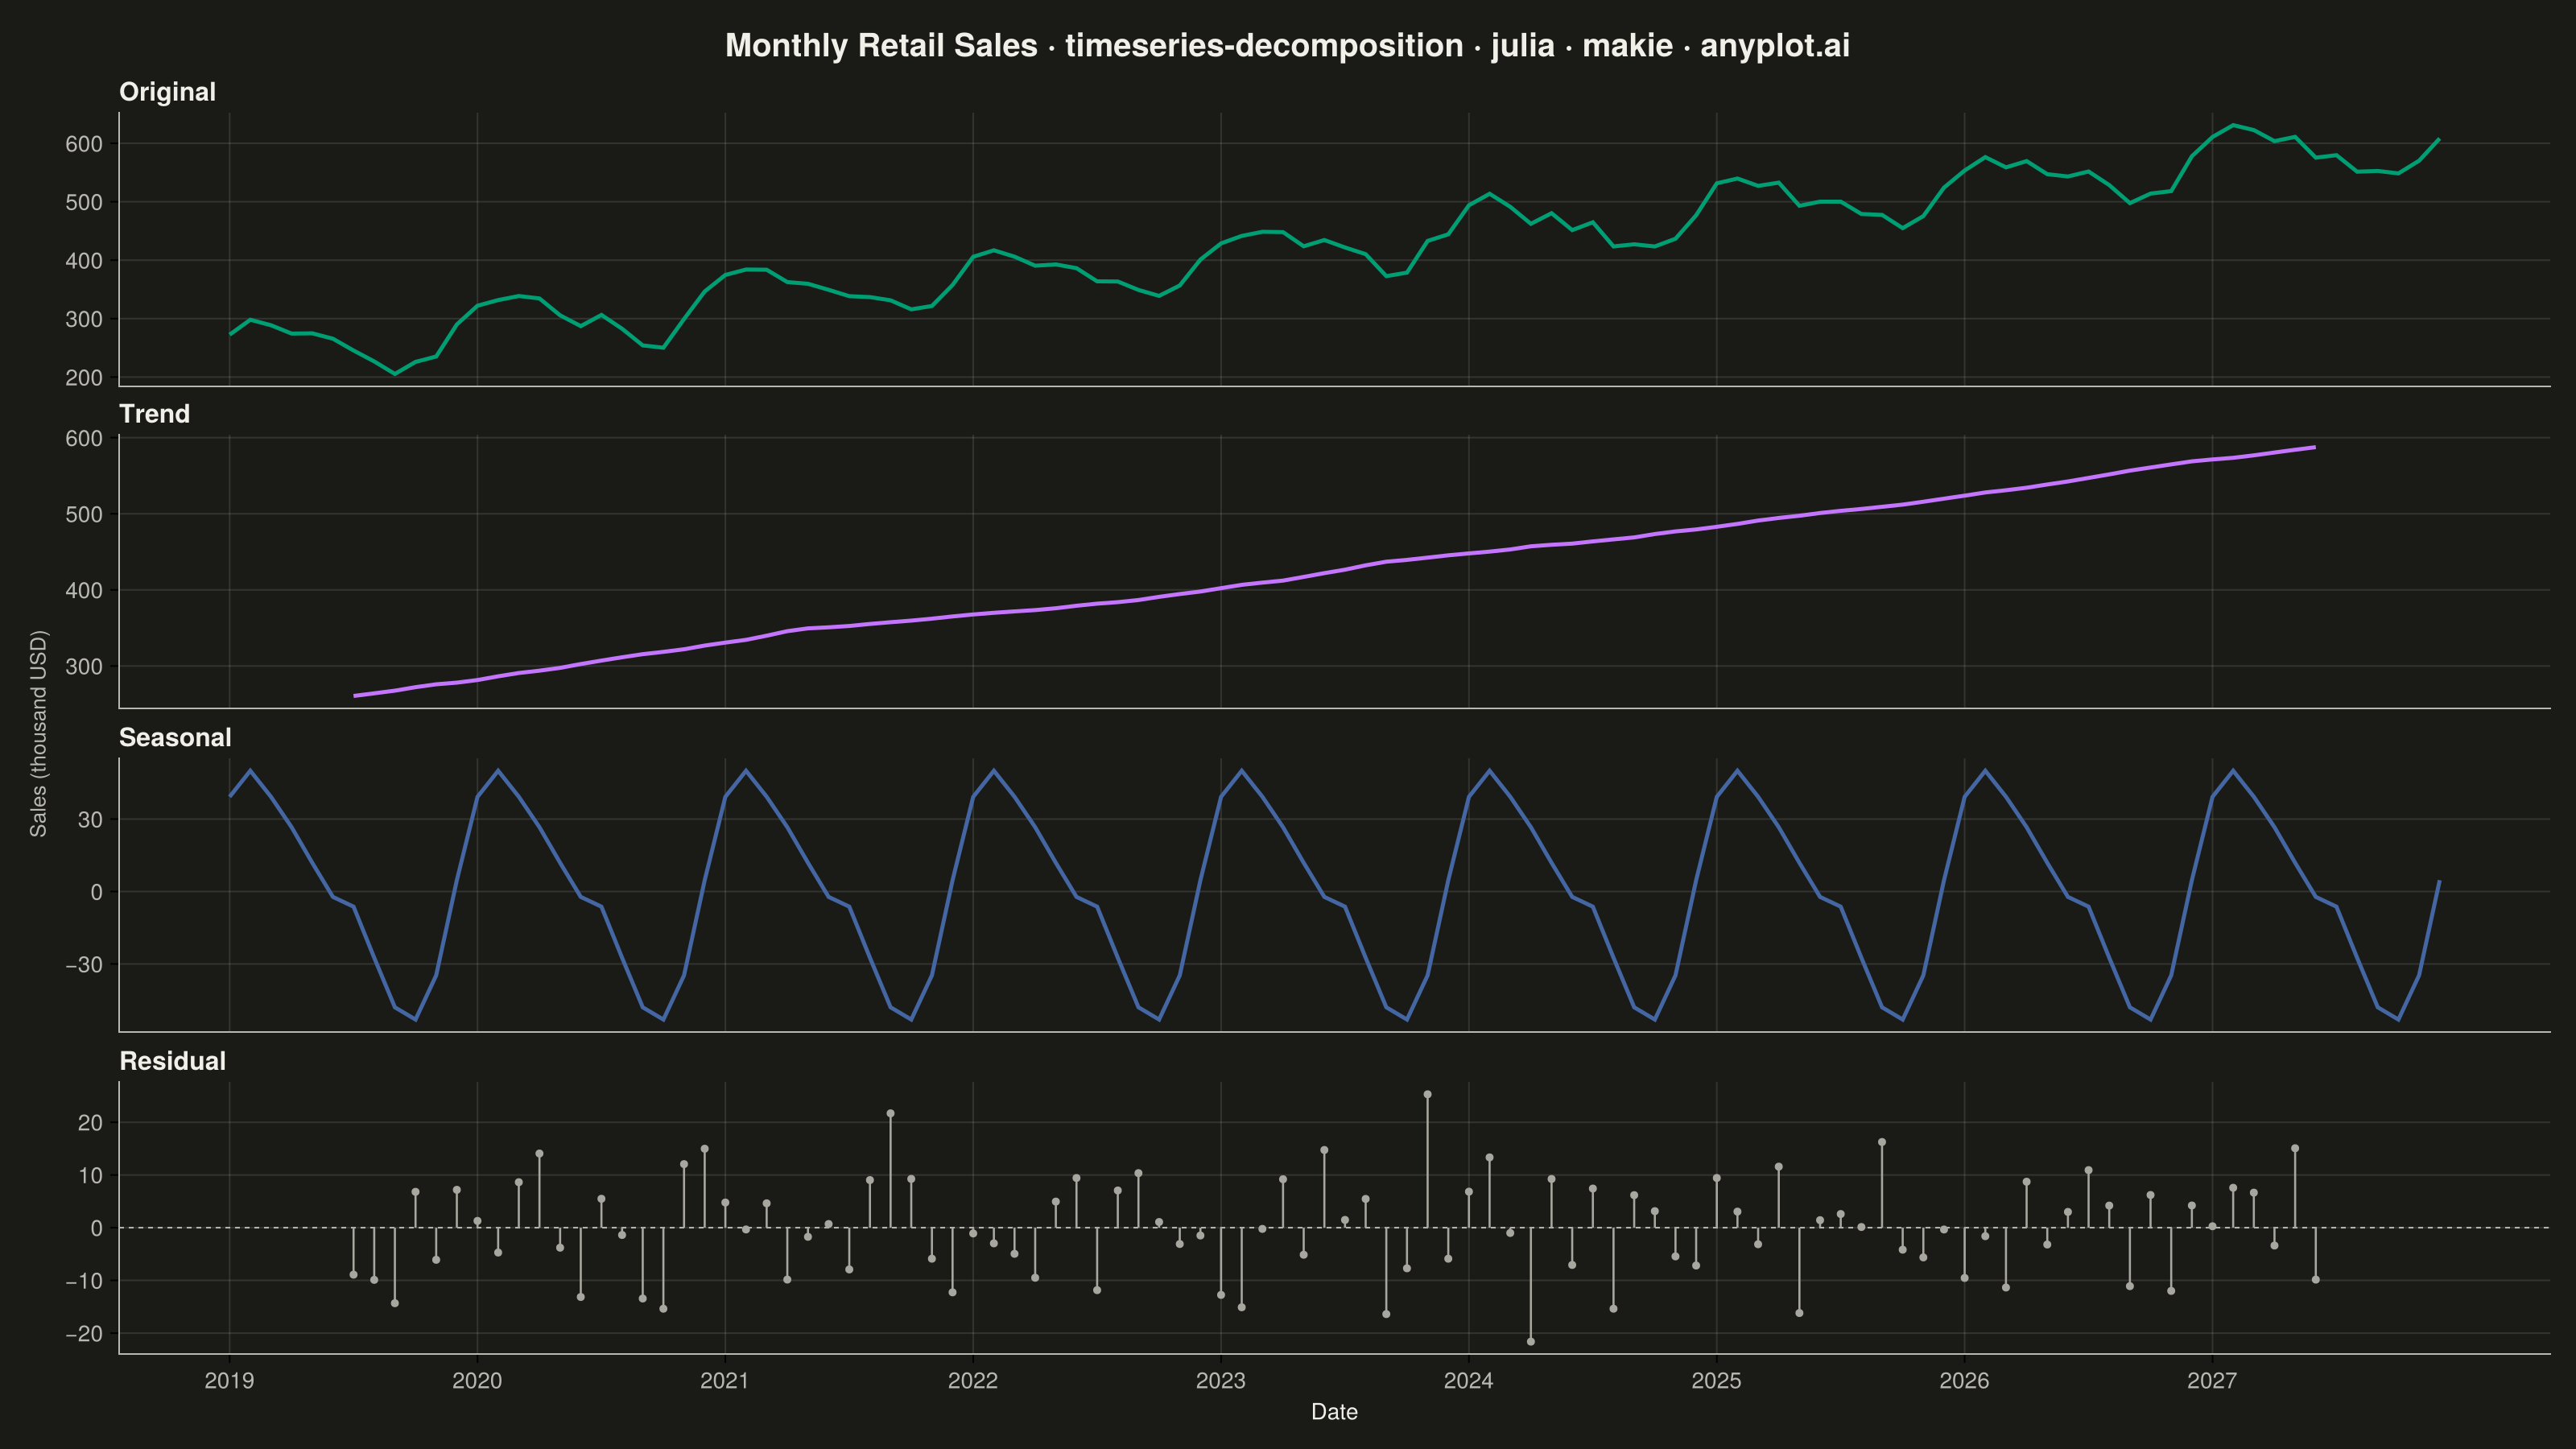
A time series decomposition plot displays a time series broken down into its constituent components: the original series, trend, seasonal pattern, and residual noise. Each component is shown as a separate subplot stacked vertically, sharing a common time axis. This visualization is essential for understanding the underlying structure of time series data and identifying patterns that may not be visible in the raw series.
# anyplot.ai
# timeseries-decomposition: Time Series Decomposition Plot
# Library: makie 0.21.9 | Julia 1.11.9
# Quality: 88/100 | Created: 2026-09-09

using CairoMakie
using Colors
using Random
using Statistics
using Dates

Random.seed!(42)

# --- Theme tokens (see prompts/default-style-guide.md "Theme-adaptive Chrome") --
THEME     = get(ENV, "ANYPLOT_THEME", "light")
PAGE_BG   = THEME == "light" ? colorant"#FAF8F1" : colorant"#1A1A17"
INK       = THEME == "light" ? colorant"#1A1A17" : colorant"#F0EFE8"
INK_SOFT  = THEME == "light" ? colorant"#4A4A44" : colorant"#B8B7B0"
INK_MUTED = THEME == "light" ? colorant"#6B6A63" : colorant"#A8A79F"

# Imprint palette (see prompts/default-style-guide.md "Categorical Palette")
IMPRINT_PALETTE = [
    colorant"#009E73",  # 1 — brand green (Original)
    colorant"#C475FD",  # 2 — lavender (Trend)
    colorant"#4467A3",  # 3 — blue (Seasonal)
]

# --- Data: monthly retail sales over 9 years -----------------------------
n_years  = 9
n_months = n_years * 12
period   = 12
dates    = [Date(2019, 1, 1) + Month(i) for i in 0:(n_months - 1)]
xs       = collect(1:n_months)

trend_true    = 240.0 .+ 3.4 .* xs
seasonal_true = 42.0 .* sin.(2π .* xs ./ period) .+ 14.0 .* sin.(4π .* xs ./ period)
noise         = 11.0 .* randn(n_months)
sales         = trend_true .+ seasonal_true .+ noise

# --- Decomposition: classical additive, centered 2xN moving average -------
half  = period ÷ 2
trend = fill(NaN, n_months)
for i in (half + 1):(n_months - half)
    window   = sales[(i - half):(i + half)]
    trend[i] = (sum(window) - 0.5 * window[1] - 0.5 * window[end]) / period
end

detrended    = sales .- trend
seasonal_avg = zeros(period)
for m in 1:period
    vals = [detrended[i] for i in 1:n_months if !isnan(detrended[i]) && ((i - 1) % period + 1) == m]
    seasonal_avg[m] = mean(vals)
end
seasonal_avg .-= mean(seasonal_avg)
seasonal = [seasonal_avg[(i - 1) % period + 1] for i in 1:n_months]
residual = sales .- trend .- seasonal
valid    = .!isnan.(residual)

# --- Title (fontsize scaled per prompts/plot-generator.md formula) --------
title_text     = "Monthly Retail Sales · timeseries-decomposition · julia · makie · anyplot.ai"
title_fontsize = length(title_text) > 67 ? round(Int, 23 * 67 / length(title_text)) : 23

# --- Figure -----------------------------------------------------------------
fig = Figure(
    resolution      = (1600, 900),
    fontsize        = 14,
    backgroundcolor = PAGE_BG,
)

Label(fig[0, 0:1], title_text; fontsize = title_fontsize, color = INK, font = :bold)
Label(fig[1:4, 0], "Sales (thousand USD)"; rotation = pi / 2, color = INK_SOFT,
      fontsize = 13, tellheight = false)

year_ticks  = collect(1:12:n_months)
year_labels = string.(year.(dates[year_ticks]))
grid_light  = RGBAf(INK.r, INK.g, INK.b, 0.12)

ax_original = Axis(
    fig[1, 1];
    title = "Original", titlealign = :left, titlesize = 16, titlecolor = INK,
    backgroundcolor = PAGE_BG,
    yticklabelcolor = INK_SOFT, xticklabelcolor = INK_SOFT,
    topspinevisible = false, rightspinevisible = false,
    leftspinecolor = INK_SOFT, bottomspinecolor = INK_SOFT,
    xgridcolor = grid_light, ygridcolor = grid_light,
    xticks = (year_ticks, year_labels), xticklabelsvisible = false, xticksvisible = false,
)
ax_trend = Axis(
    fig[2, 1];
    title = "Trend", titlealign = :left, titlesize = 16, titlecolor = INK,
    backgroundcolor = PAGE_BG,
    yticklabelcolor = INK_SOFT, xticklabelcolor = INK_SOFT,
    topspinevisible = false, rightspinevisible = false,
    leftspinecolor = INK_SOFT, bottomspinecolor = INK_SOFT,
    xgridcolor = grid_light, ygridcolor = grid_light,
    xticks = (year_ticks, year_labels), xticklabelsvisible = false, xticksvisible = false,
)
ax_seasonal = Axis(
    fig[3, 1];
    title = "Seasonal", titlealign = :left, titlesize = 16, titlecolor = INK,
    backgroundcolor = PAGE_BG,
    yticklabelcolor = INK_SOFT, xticklabelcolor = INK_SOFT,
    topspinevisible = false, rightspinevisible = false,
    leftspinecolor = INK_SOFT, bottomspinecolor = INK_SOFT,
    xgridcolor = grid_light, ygridcolor = grid_light,
    xticks = (year_ticks, year_labels), xticklabelsvisible = false, xticksvisible = false,
)
ax_residual = Axis(
    fig[4, 1];
    title = "Residual", titlealign = :left, titlesize = 16, titlecolor = INK,
    xlabel = "Date", xlabelcolor = INK,
    backgroundcolor = PAGE_BG,
    yticklabelcolor = INK_SOFT, xticklabelcolor = INK_SOFT,
    topspinevisible = false, rightspinevisible = false,
    leftspinecolor = INK_SOFT, bottomspinecolor = INK_SOFT,
    xgridcolor = grid_light, ygridcolor = grid_light,
    xticks = (year_ticks, year_labels), xticklabelsvisible = true, xticksvisible = true,
)

lines!(ax_original, xs, sales; color = IMPRINT_PALETTE[1], linewidth = 2.5)
lines!(ax_trend, xs, trend; color = IMPRINT_PALETTE[2], linewidth = 2.5)
lines!(ax_seasonal, xs, seasonal; color = IMPRINT_PALETTE[3], linewidth = 2.5)

hlines!(ax_residual, [0.0]; color = INK_SOFT, linewidth = 1, linestyle = :dash)
for (xi, yi) in zip(xs[valid], residual[valid])
    lines!(ax_residual, [xi, xi], [0.0, yi]; color = INK_MUTED, linewidth = 1.3)
end
scatter!(ax_residual, xs[valid], residual[valid]; color = INK_MUTED, markersize = 7, strokewidth = 0)

linkxaxes!(ax_original, ax_trend, ax_seasonal, ax_residual)
rowgap!(fig.layout, 8)
colgap!(fig.layout, 10)

# --- Save -------------------------------------------------------------------
save("plot-$(THEME).png", fig; px_per_unit = 2)
Runnable source as JSON, for any HTTP client: https://api.anyplot.ai/specs/timeseries-decomposition/makie/code. Any spec id and library id listed in llms-full.txt fit the same URL shape; every URL below is complete and callable.
{
  "spec_id": "timeseries-decomposition",
  "language": "julia",
  "library": "makie",
  "page": "https://anyplot.ai/timeseries-decomposition/julia/makie",
  "hub": "https://anyplot.ai/timeseries-decomposition",
  "code_json": "https://api.anyplot.ai/specs/timeseries-decomposition/makie/code",
  "spec_json": "https://api.anyplot.ai/specs/timeseries-decomposition",
  "render_light_png": "https://storage.googleapis.com/anyplot-images/plots/timeseries-decomposition/julia/makie/plot-light.png",
  "render_dark_png": "https://storage.googleapis.com/anyplot-images/plots/timeseries-decomposition/julia/makie/plot-dark.png",
  "quality_score": 88.0,
  "license": "MIT",
  "guide": "https://anyplot.ai/llms.txt"
}
Part of Time Series Decomposition Plot on anyplot.ai.