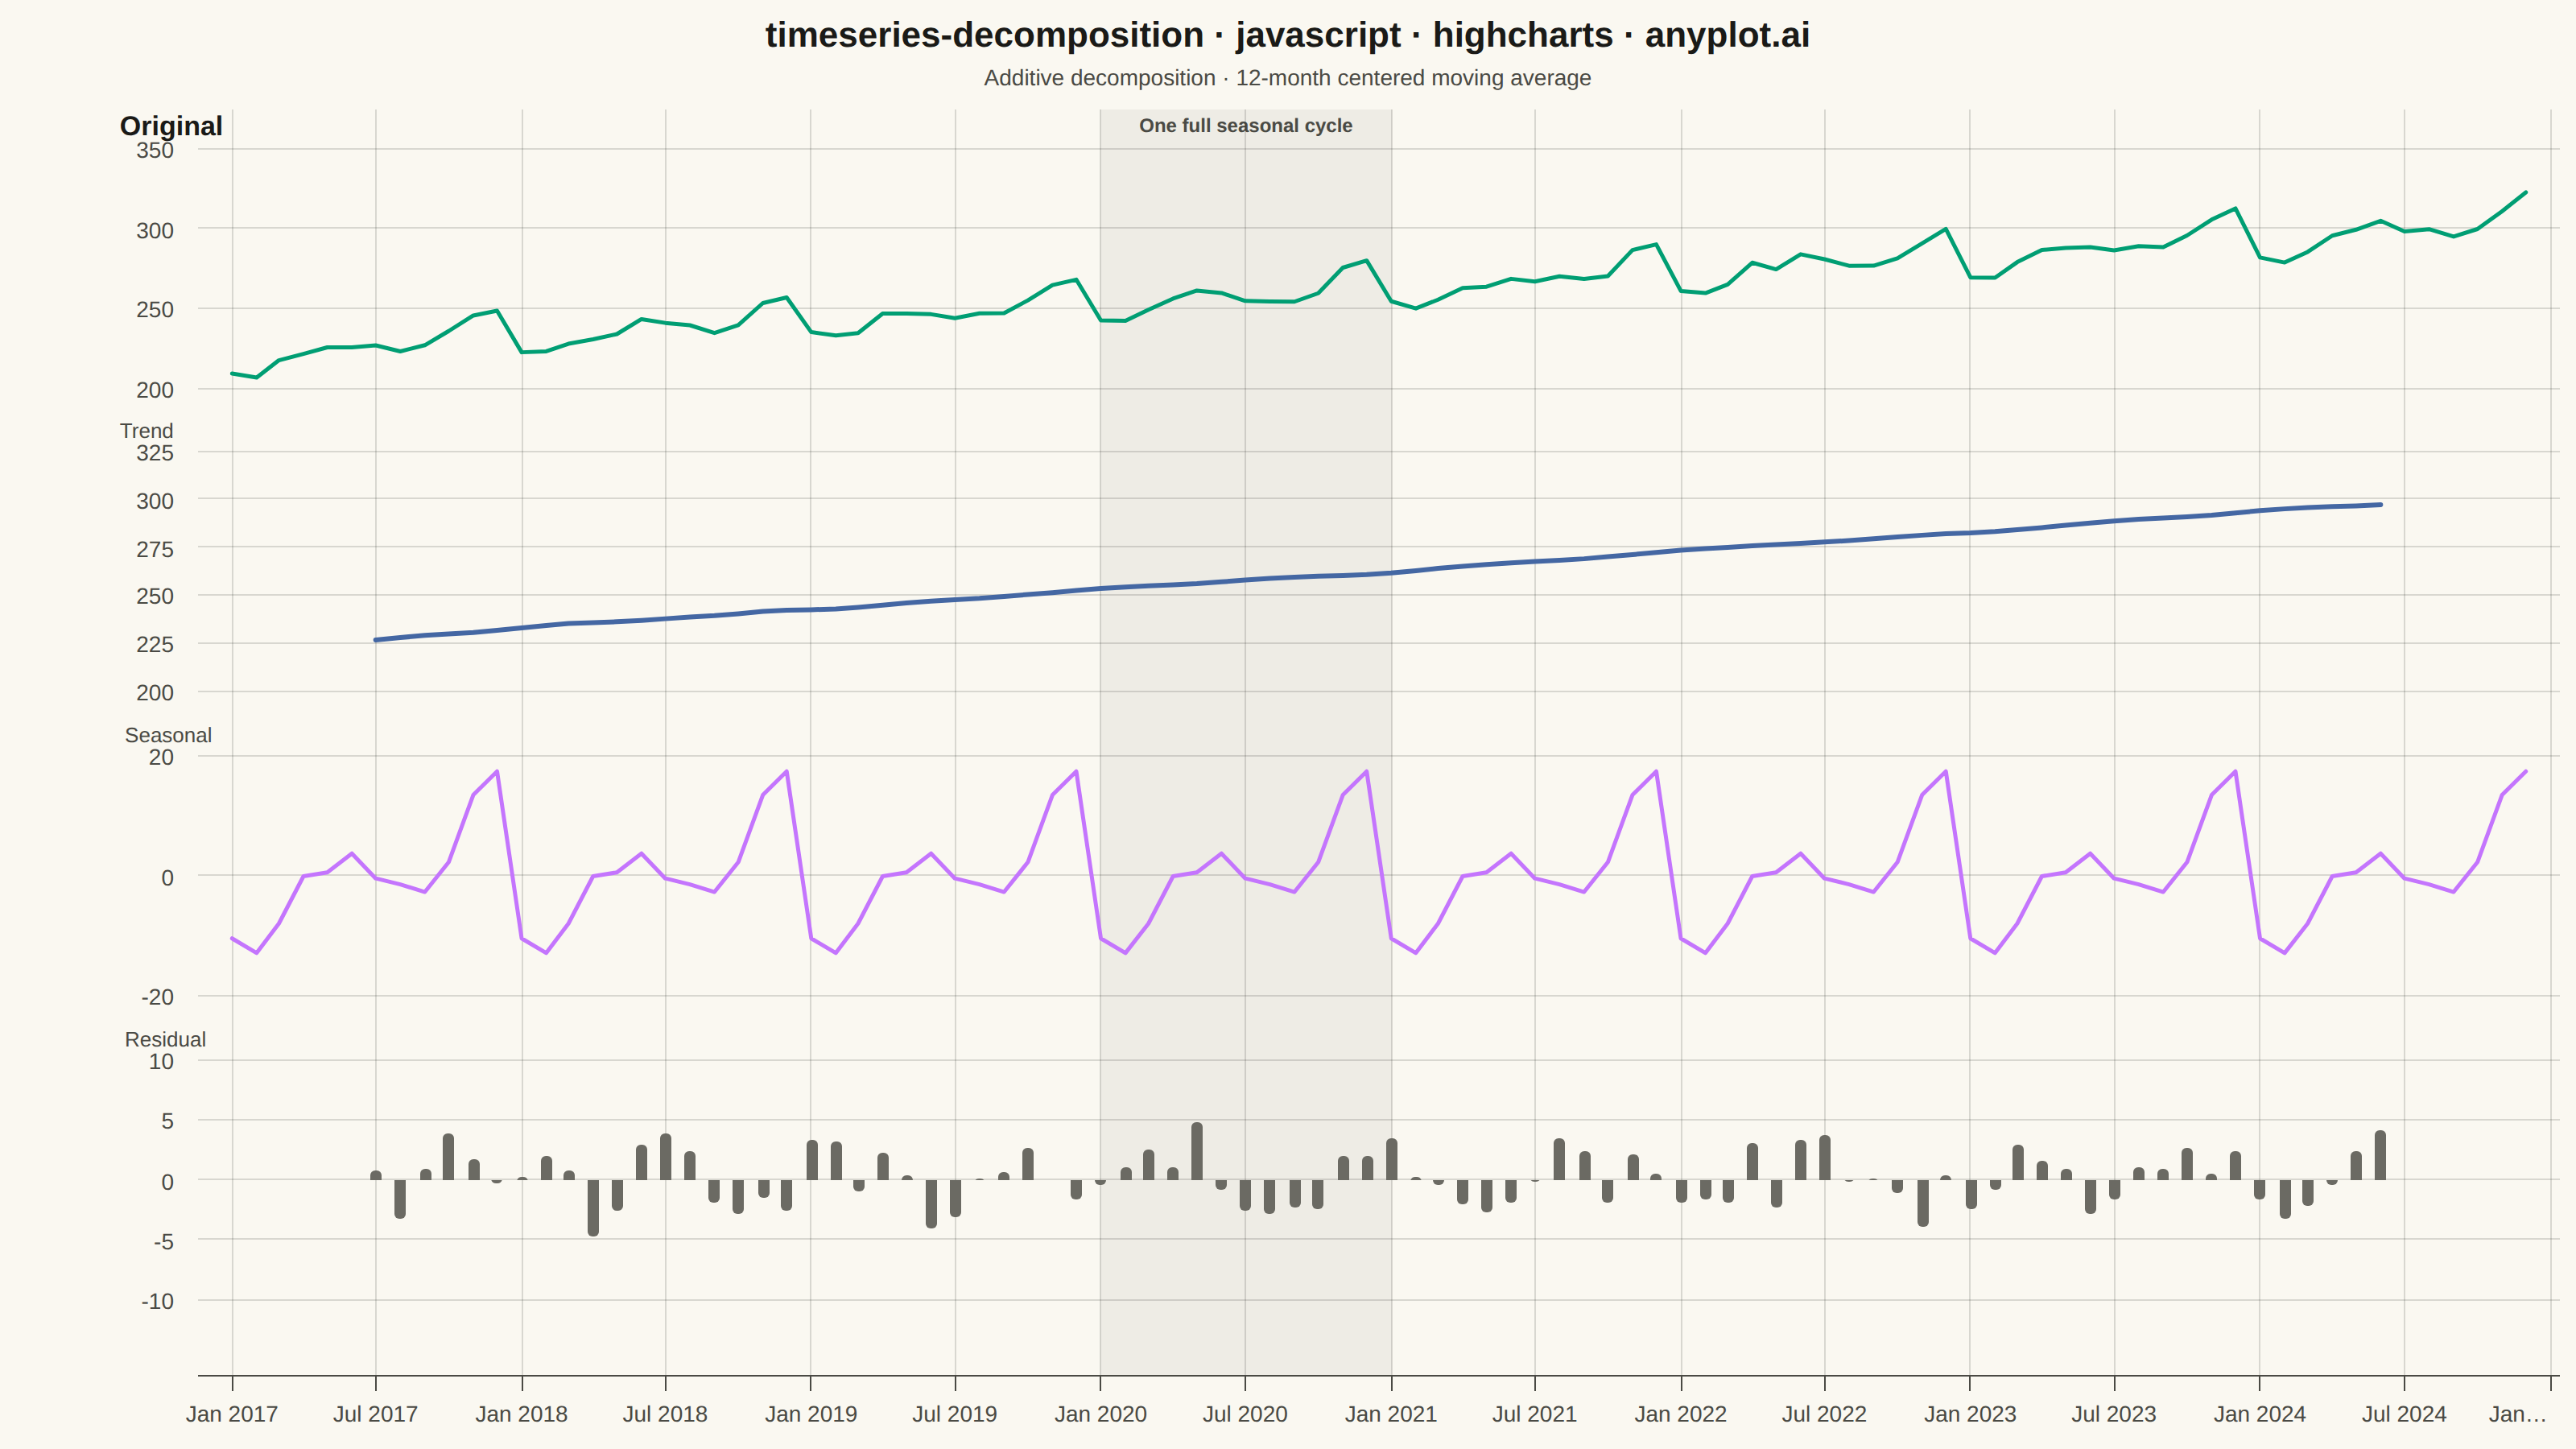
The same plot in 14 other libraries — JavaScript: Chart.js, D3.js, Apache ECharts, MUI X Charts; Python: Altair, Bokeh, lets-plot, Matplotlib, Plotly, plotnine, Pygal, Seaborn; R: ggplot2; Julia: Makie.jl. Compare all 15 side by side: Time Series Decomposition Plot in Python, R, Julia and JavaScript.
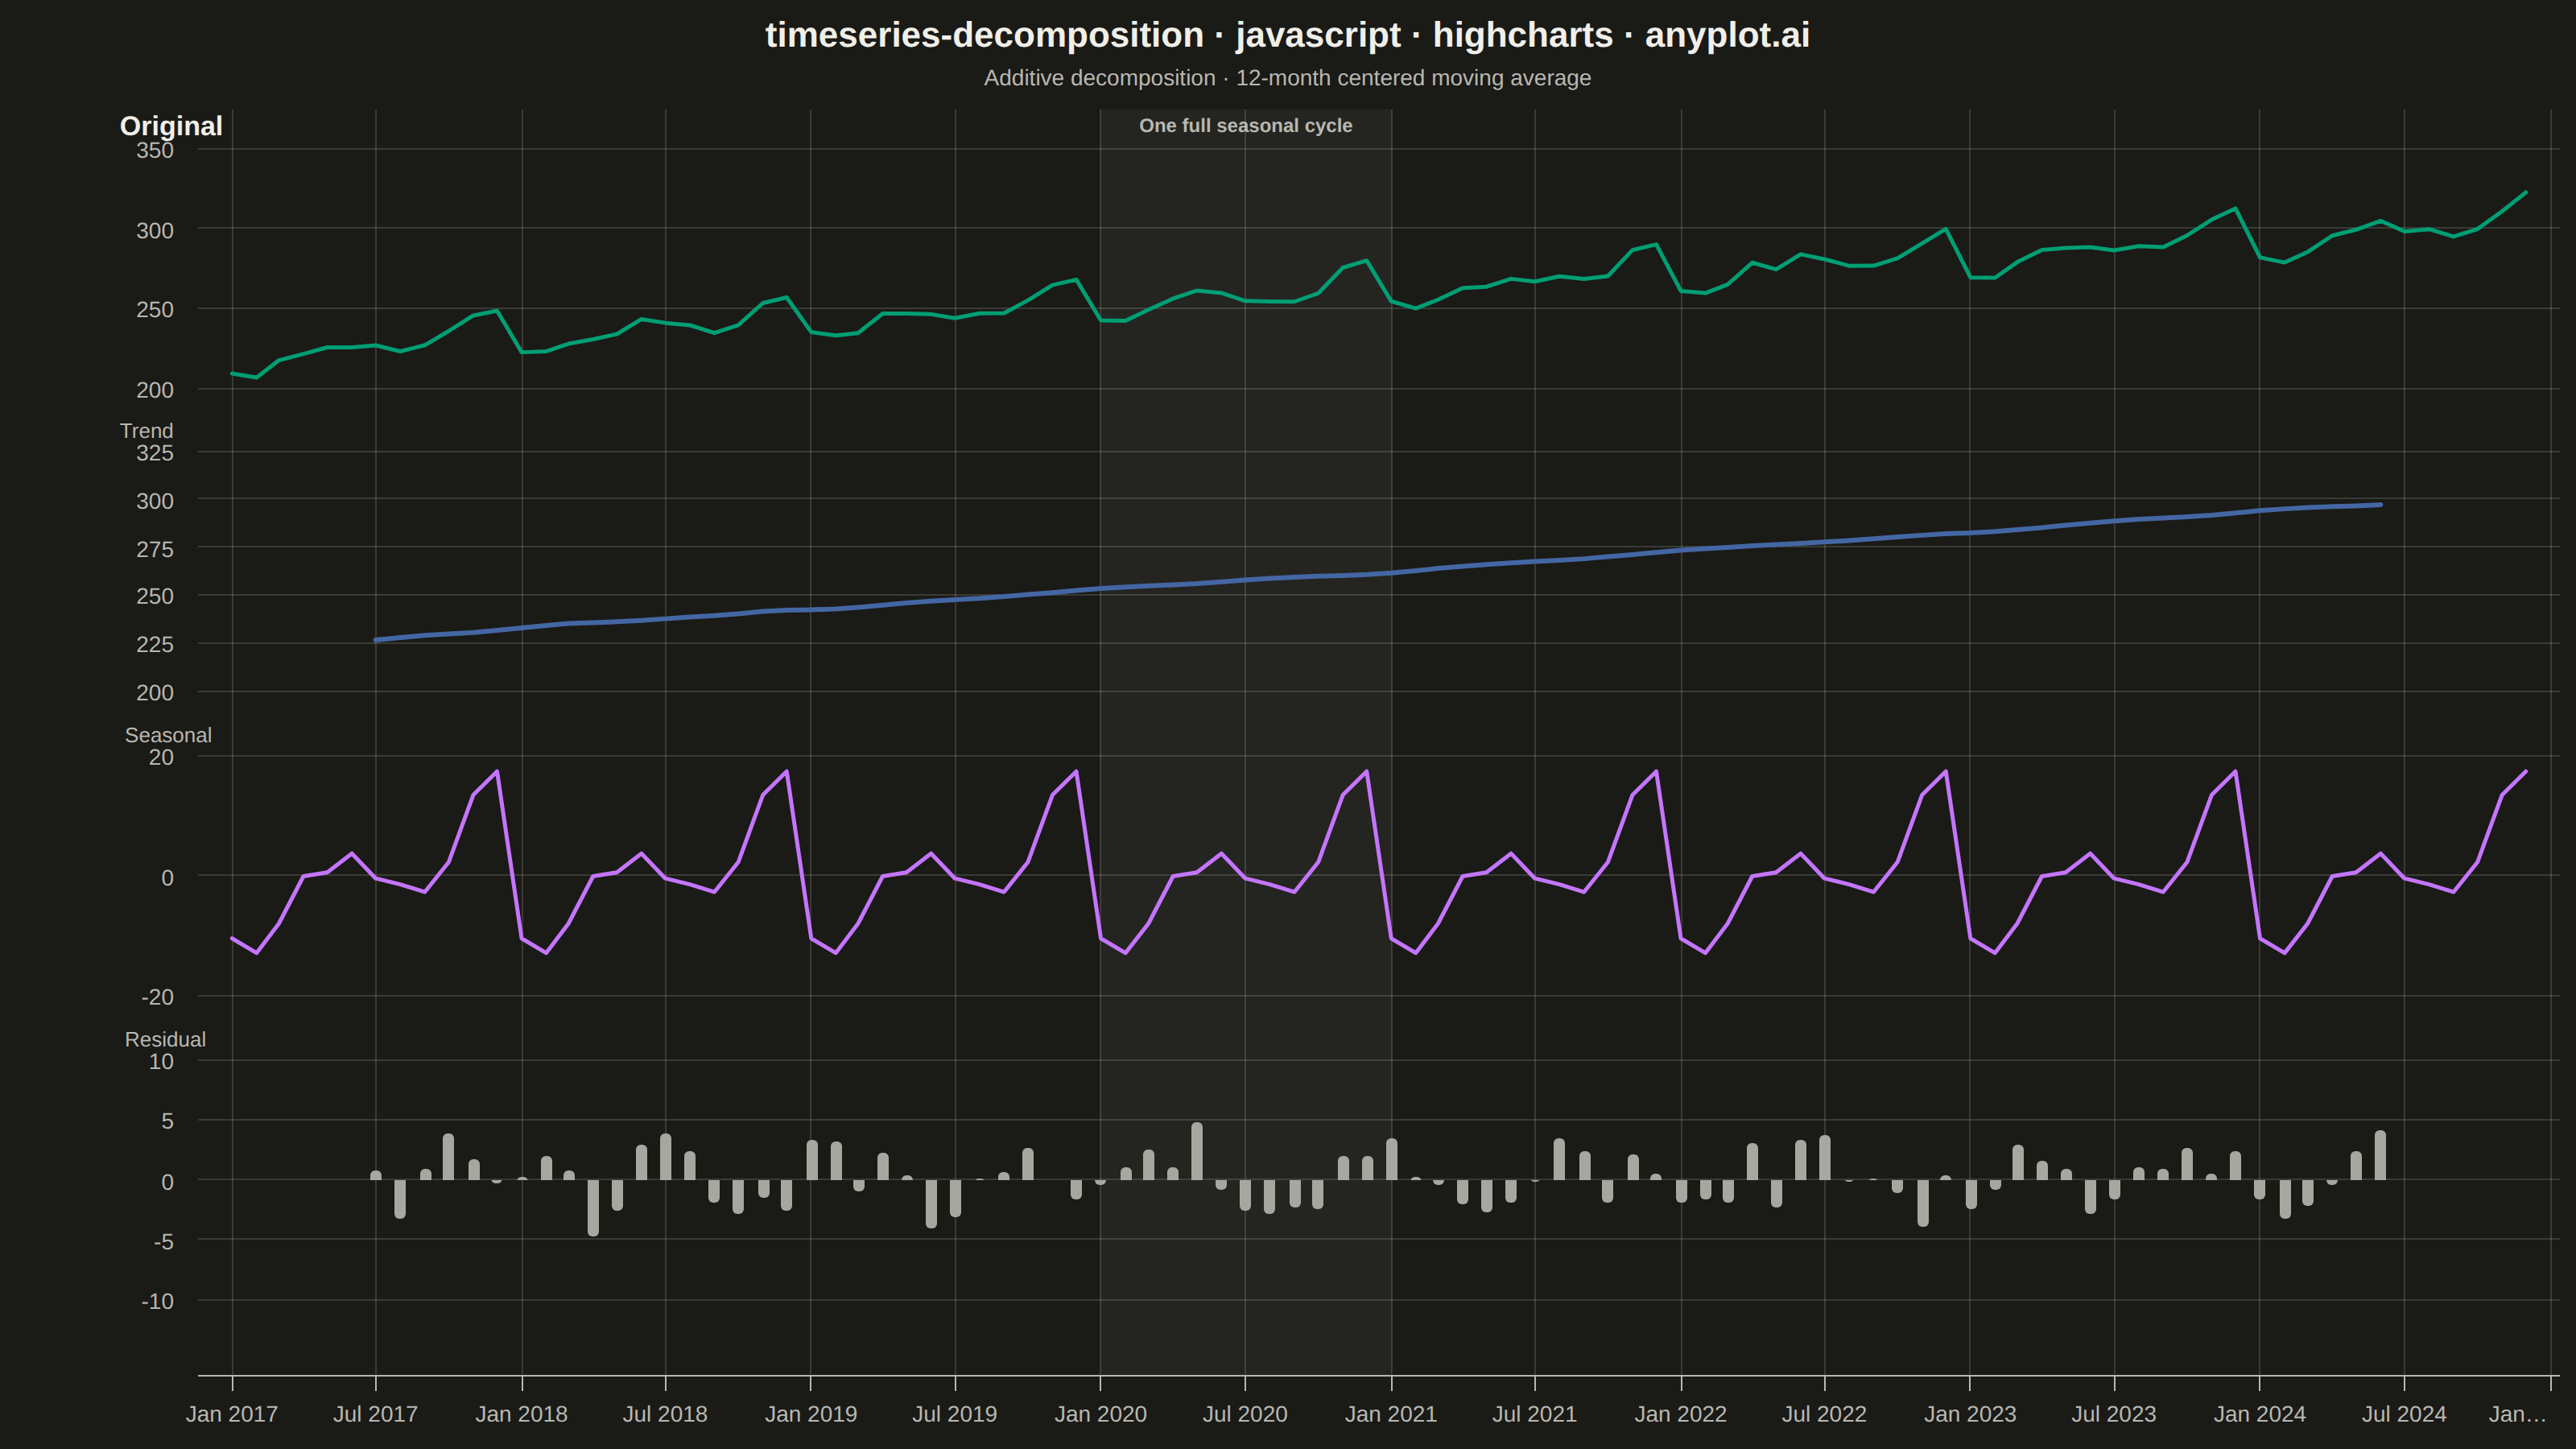
A time series decomposition plot displays a time series broken down into its constituent components: the original series, trend, seasonal pattern, and residual noise. Each component is shown as a separate subplot stacked vertically, sharing a common time axis. This visualization is essential for understanding the underlying structure of time series data and identifying patterns that may not be visible in the raw series.
// anyplot.ai
// timeseries-decomposition: Time Series Decomposition Plot
// Library: highcharts 12.6.0 | JavaScript 22.23.2
// Quality: 92/100 | Created: 2026-09-09

const t = window.ANYPLOT_TOKENS;
// "muted" semantic anchor (other/rest) — not in ANYPLOT_TOKENS, derive from theme
// per prompts/default-style-guide.md "Theme-adaptive Chrome".
const INK_MUTED = t.theme === "dark" ? "#A8A79F" : "#6B6A63";

// --- Data (in-memory, deterministic) ----------------------------------------
// Monthly retail sales index, 8 years — long enough for several seasonal cycles.
const N_MONTHS = 96;
const START_YEAR = 2017;
const PERIOD = 12;
const BASE_LEVEL = 220;
const MONTHLY_GROWTH = 0.85;
// Holiday-retail seasonal shape: winter dip, autumn/holiday build-up.
const SEASONAL_PATTERN = [-9, -11, -5, 1, 3, 5, 2, 0, -3, 4, 14, 19];

let lcgSeed = 42;
function nextRandom() {
  lcgSeed = (lcgSeed * 1664525 + 1013904223) % 4294967296;
  return lcgSeed / 4294967296;
}

const timestamps = [];
const values = [];
for (let i = 0; i < N_MONTHS; i++) {
  const year = START_YEAR + Math.floor(i / PERIOD);
  const month = i % PERIOD;
  timestamps.push(Date.UTC(year, month, 1));

  const trendTrue = BASE_LEVEL + MONTHLY_GROWTH * i;
  const seasonalTrue = SEASONAL_PATTERN[month];
  const noise = (nextRandom() - 0.5) * 8;
  values.push(trendTrue + seasonalTrue + noise);
}

// --- Additive decomposition (centered 2x12 moving average) -----------------
const half = PERIOD / 2;
const trend = new Array(N_MONTHS).fill(null);
for (let i = half; i <= N_MONTHS - 1 - half; i++) {
  let sum = 0.5 * values[i - half] + 0.5 * values[i + half];
  for (let k = i - half + 1; k <= i + half - 1; k++) sum += values[k];
  trend[i] = sum / PERIOD;
}

const seasonalSums = new Array(PERIOD).fill(0);
const seasonalCounts = new Array(PERIOD).fill(0);
for (let i = 0; i < N_MONTHS; i++) {
  if (trend[i] === null) continue;
  const m = i % PERIOD;
  seasonalSums[m] += values[i] - trend[i];
  seasonalCounts[m] += 1;
}
const seasonalRaw = seasonalSums.map((s, m) => s / seasonalCounts[m]);
const seasonalMean = seasonalRaw.reduce((a, b) => a + b, 0) / PERIOD;
const seasonalIndex = seasonalRaw.map((s) => s - seasonalMean);

const seasonal = timestamps.map((_, i) => seasonalIndex[i % PERIOD]);
const residual = values.map((v, i) => (trend[i] === null ? null : v - trend[i] - seasonal[i]));

const originalSeries = timestamps.map((ts, i) => [ts, values[i]]);
const trendSeries = timestamps.map((ts, i) => [ts, trend[i]]);
const seasonalSeries = timestamps.map((ts, i) => [ts, seasonal[i]]);
const residualSeries = timestamps.map((ts, i) => [ts, residual[i]]);

// --- Chart -------------------------------------------------------------------
// Typographic hierarchy: "Original" is the primary reference series, so its
// pane label reads bolder/larger; the three derived components share a
// lighter secondary style.
const paneTitlePrimary = { color: t.ink, fontSize: "17px", fontWeight: "700" };
const paneTitleSecondary = { color: t.inkSoft, fontSize: "13px", fontWeight: "500" };
const axisLabelStyle = { color: t.inkSoft, fontSize: "14px" };

function pane(top, text, primary) {
  return {
    top,
    height: "19%",
    offset: 0,
    gridLineColor: t.grid,
    gridLineWidth: 1,
    lineWidth: 0,
    tickWidth: 0,
    labels: { style: axisLabelStyle },
    title: {
      text,
      align: "high",
      rotation: 0,
      textAlign: "left",
      x: 0,
      y: -8,
      style: primary ? paneTitlePrimary : paneTitleSecondary,
    },
  };
}

Highcharts.chart("container", {
  chart: {
    backgroundColor: "transparent",
    animation: false,
    spacingTop: 12,
    style: { fontFamily: "inherit" },
  },
  credits: { enabled: false },
  colors: t.palette,
  title: {
    text: "timeseries-decomposition · javascript · highcharts · anyplot.ai",
    style: { color: t.ink, fontSize: "22px", fontWeight: "600" },
  },
  subtitle: {
    text: "Additive decomposition · 12-month centered moving average",
    style: { color: t.inkSoft, fontSize: "14px" },
  },
  xAxis: {
    type: "datetime",
    gridLineColor: t.grid,
    gridLineWidth: 1,
    lineColor: t.inkSoft,
    tickColor: t.inkSoft,
    labels: { style: axisLabelStyle },
    // Focal-point annotation: highlight one full seasonal cycle (2020) as a
    // reference band spanning all four panes — the "neutral" semantic anchor
    // (baseline/reference role) rendered as a low-opacity tint of the ink color.
    plotBands: [
      {
        from: Date.UTC(2020, 0, 1),
        to: Date.UTC(2021, 0, 1),
        color: Highcharts.color(t.ink).setOpacity(0.05).get(),
        label: {
          text: "One full seasonal cycle",
          align: "center",
          verticalAlign: "top",
          y: 14,
          style: { color: t.inkSoft, fontSize: "12px", fontWeight: "600" },
        },
      },
    ],
  },
  yAxis: [
    pane("3%", "Original", true),
    pane("27%", "Trend", false),
    pane("51%", "Seasonal", false),
    pane("75%", "Residual", false),
  ],
  legend: { enabled: false },
  tooltip: {
    shared: true,
    xDateFormat: "%b %Y",
    backgroundColor: t.elevatedBg,
    style: { color: t.ink },
  },
  plotOptions: {
    series: { animation: false, marker: { enabled: false } },
    column: { borderWidth: 0 },
  },
  series: [
    {
      name: "Original",
      type: "line",
      yAxis: 0,
      data: originalSeries,
      color: t.palette[0],
      lineWidth: 2.5,
    },
    {
      name: "Trend",
      type: "line",
      yAxis: 1,
      data: trendSeries,
      color: t.palette[2],
      lineWidth: 3,
    },
    {
      name: "Seasonal",
      type: "line",
      yAxis: 2,
      data: seasonalSeries,
      color: t.palette[1],
      lineWidth: 2.5,
    },
    {
      name: "Residual",
      type: "column",
      yAxis: 3,
      data: residualSeries,
      color: INK_MUTED,
    },
  ],
});
Runnable source as JSON, for any HTTP client: https://api.anyplot.ai/specs/timeseries-decomposition/highcharts/code. Any spec id and library id listed in llms-full.txt fit the same URL shape; every URL below is complete and callable.
{
  "spec_id": "timeseries-decomposition",
  "language": "javascript",
  "library": "highcharts",
  "page": "https://anyplot.ai/timeseries-decomposition/javascript/highcharts",
  "hub": "https://anyplot.ai/timeseries-decomposition",
  "code_json": "https://api.anyplot.ai/specs/timeseries-decomposition/highcharts/code",
  "spec_json": "https://api.anyplot.ai/specs/timeseries-decomposition",
  "render_light_png": "https://storage.googleapis.com/anyplot-images/plots/timeseries-decomposition/javascript/highcharts/plot-light.png",
  "render_dark_png": "https://storage.googleapis.com/anyplot-images/plots/timeseries-decomposition/javascript/highcharts/plot-dark.png",
  "interactive_light_html": "https://storage.googleapis.com/anyplot-images/plots/timeseries-decomposition/javascript/highcharts/plot-light.html",
  "interactive_dark_html": "https://storage.googleapis.com/anyplot-images/plots/timeseries-decomposition/javascript/highcharts/plot-dark.html",
  "quality_score": 92.0,
  "license": "MIT",
  "guide": "https://anyplot.ai/llms.txt"
}
Part of Time Series Decomposition Plot on anyplot.ai.