The same plot in 14 other libraries — JavaScript: Chart.js, D3.js, Apache ECharts, Highcharts; Python: Altair, Bokeh, lets-plot, Matplotlib, Plotly, plotnine, Pygal, Seaborn; R: ggplot2; Julia: Makie.jl. Compare all 15 side by side: Time Series Decomposition Plot in Python, R, Julia and JavaScript.
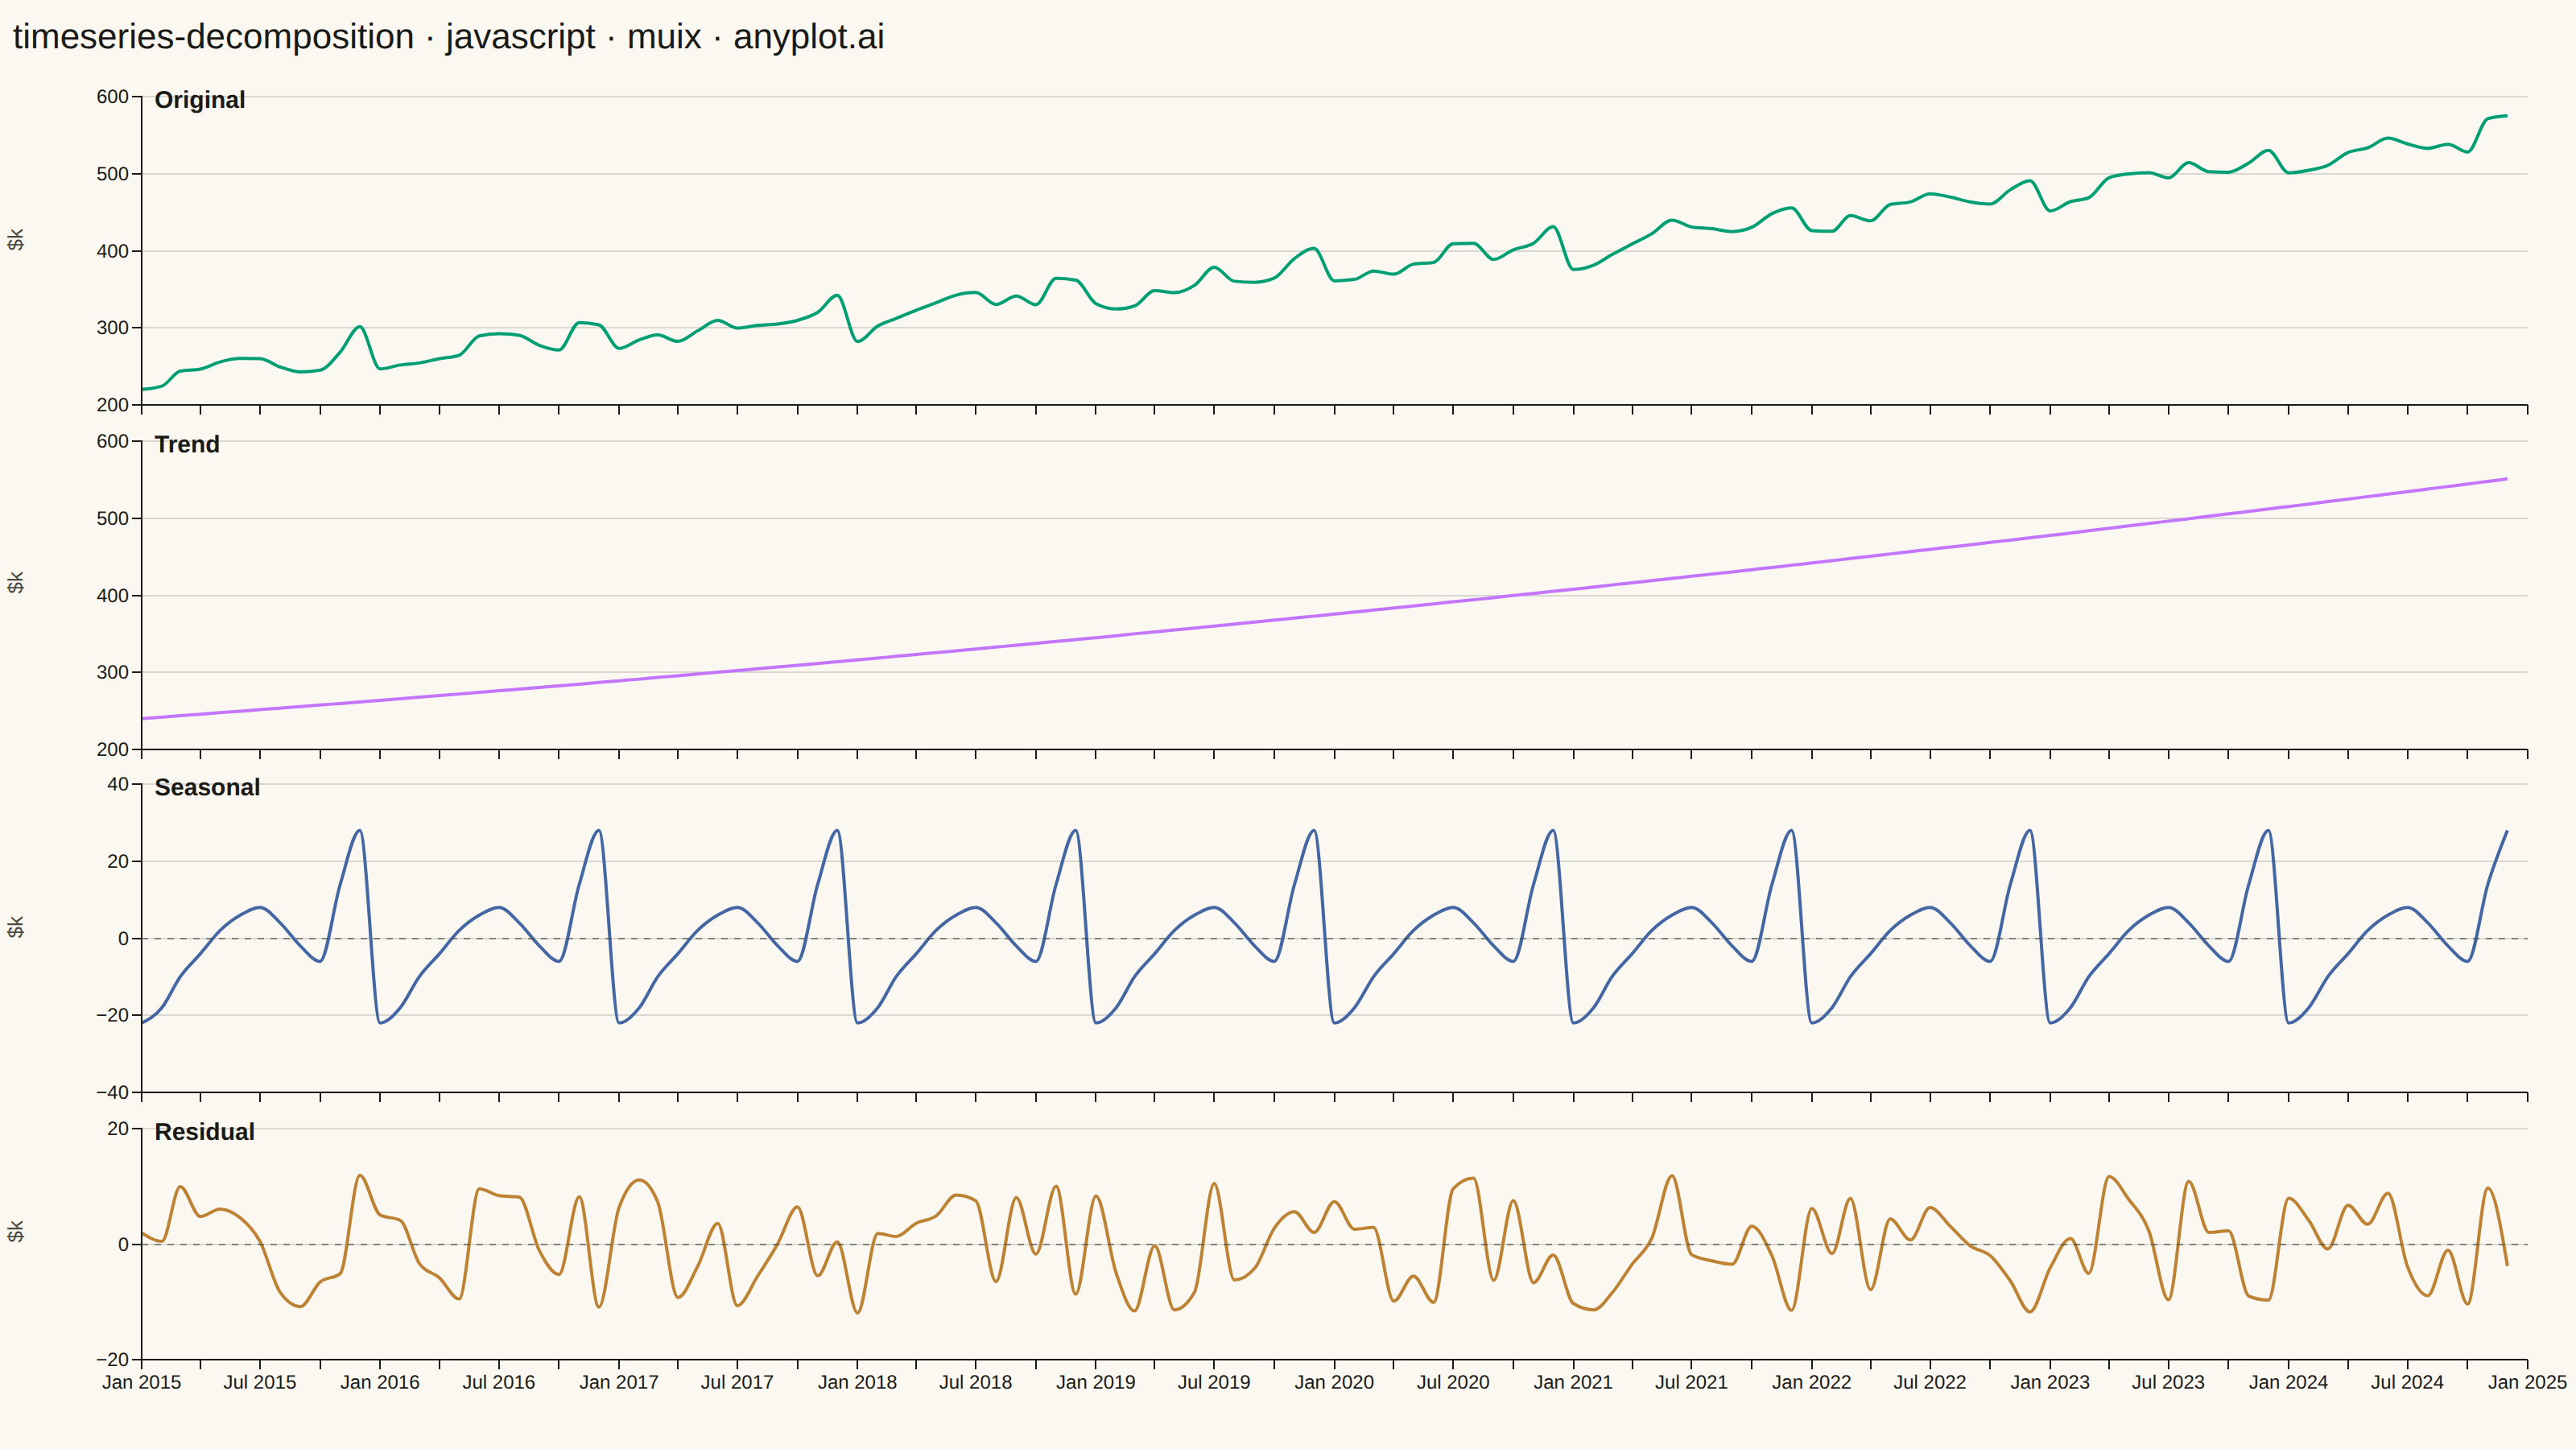
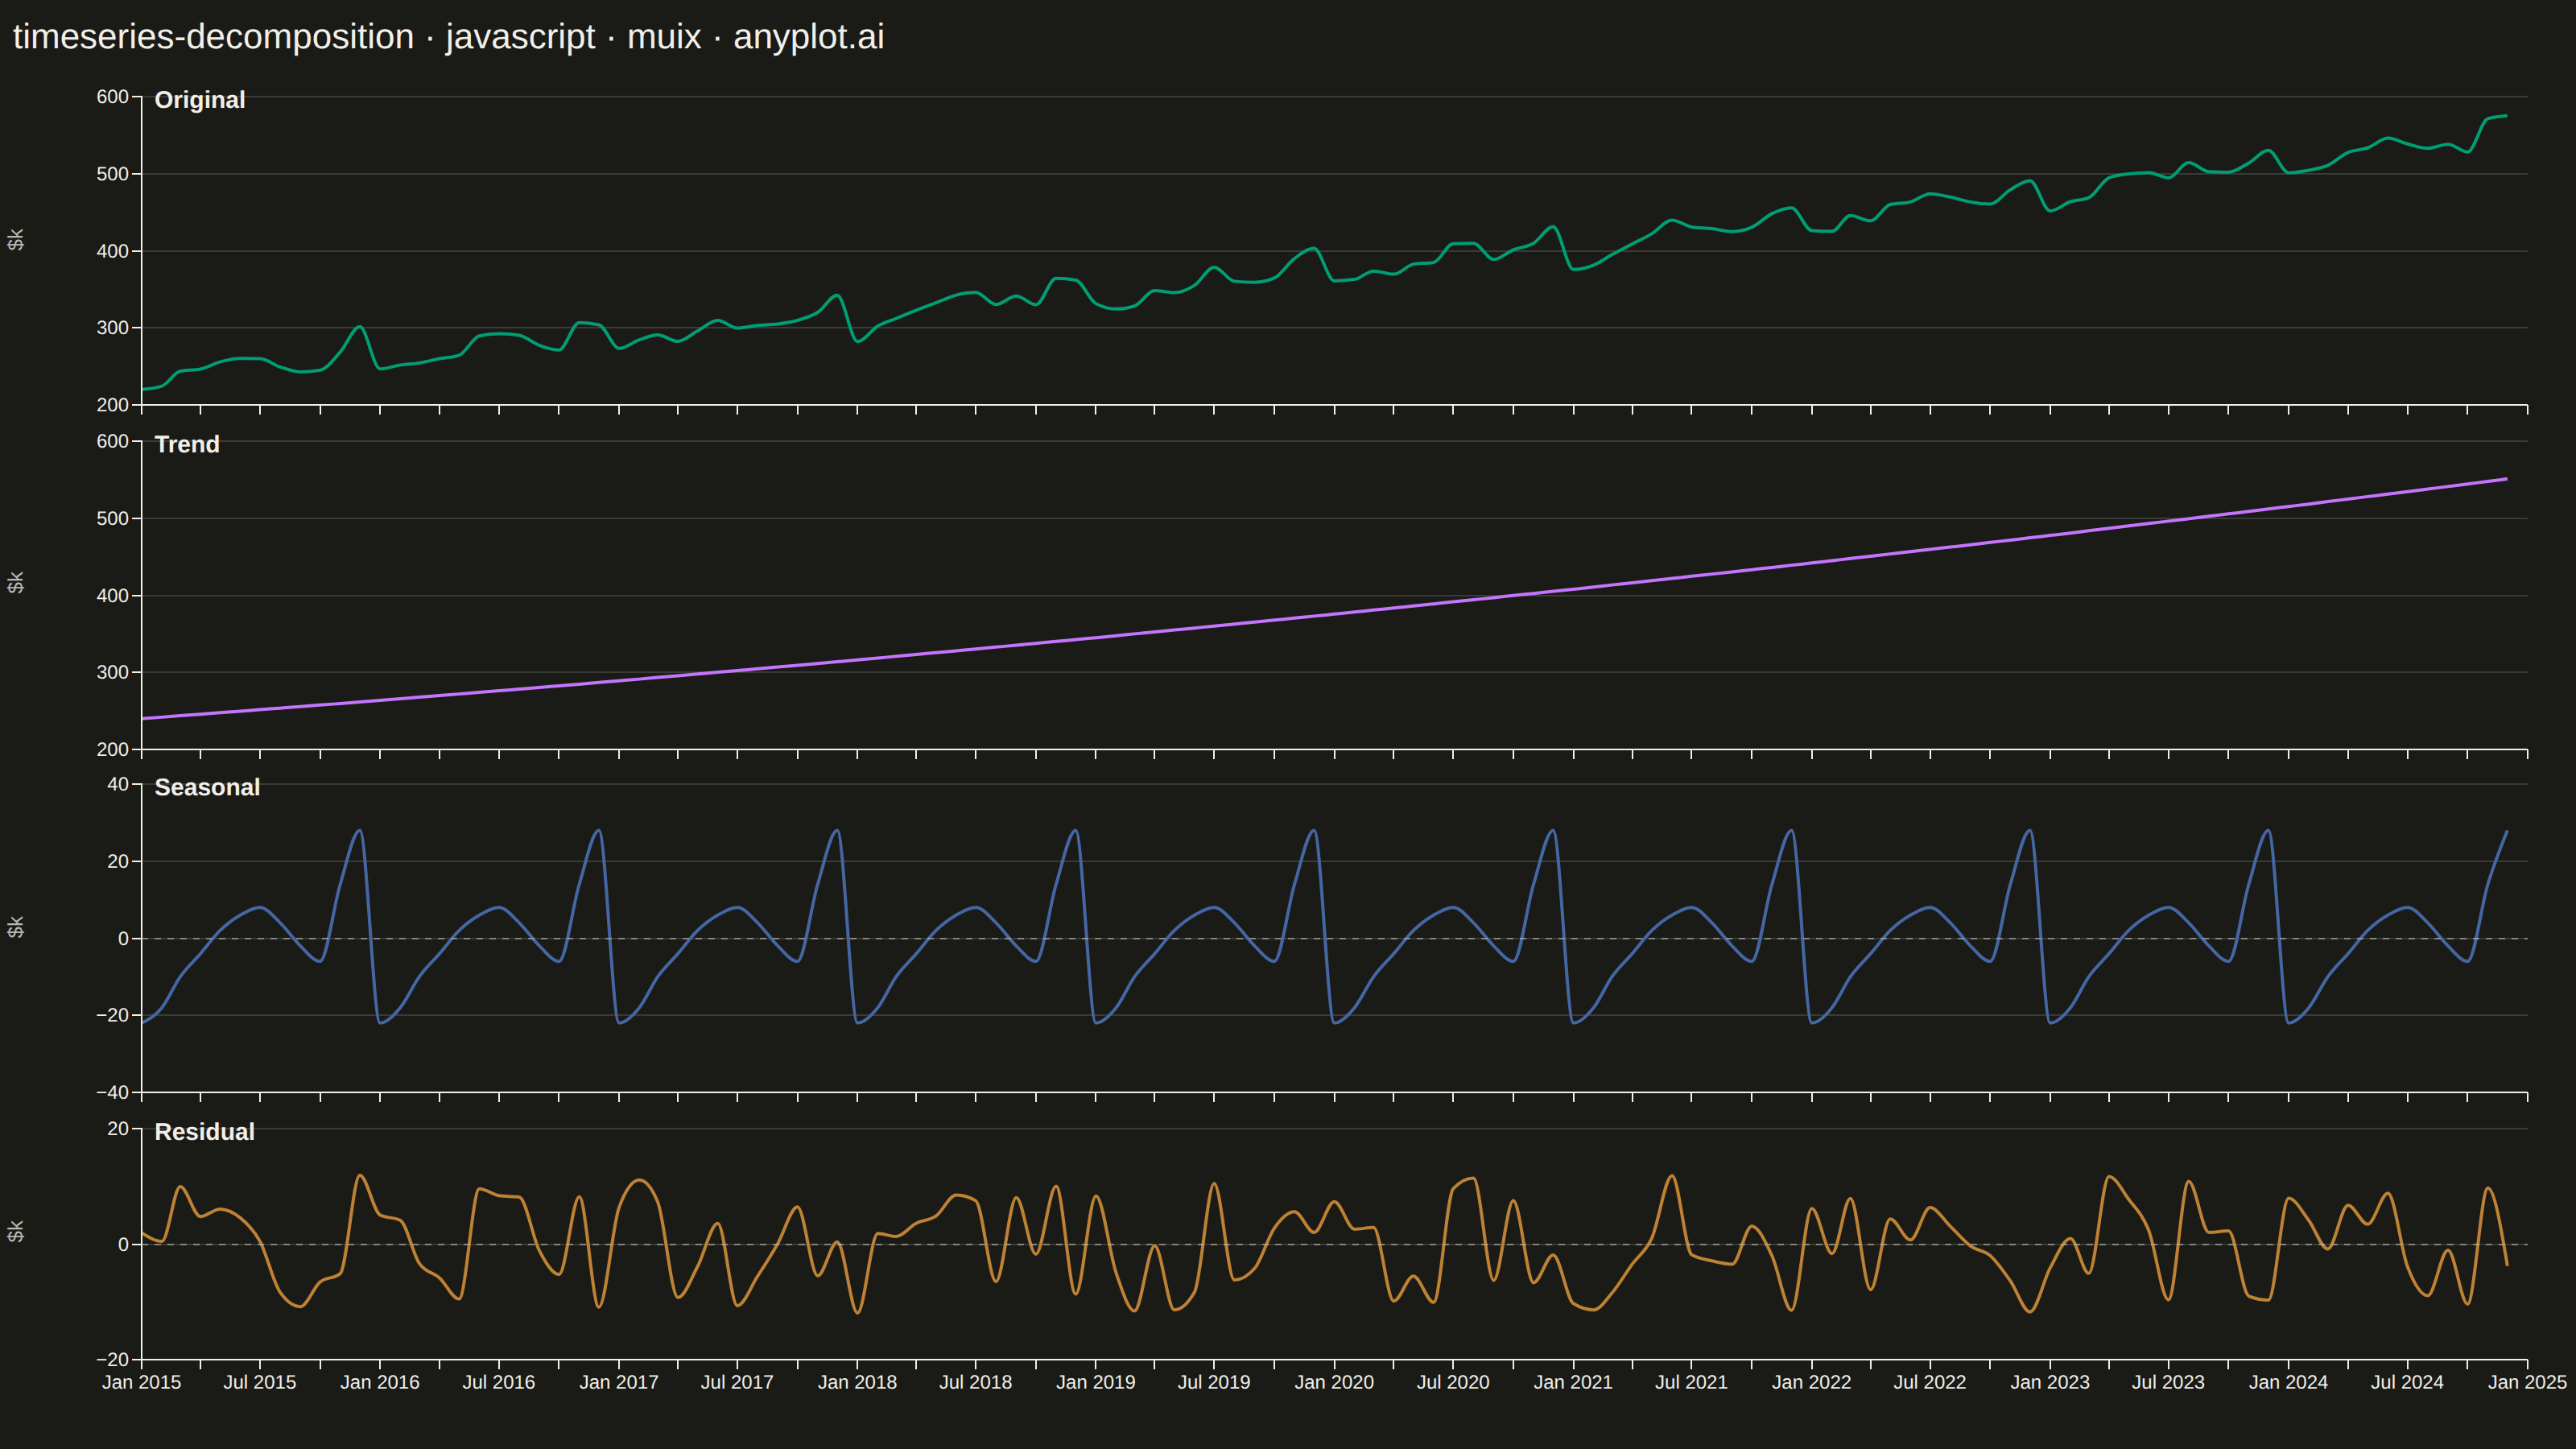
A time series decomposition plot displays a time series broken down into its constituent components: the original series, trend, seasonal pattern, and residual noise. Each component is shown as a separate subplot stacked vertically, sharing a common time axis. This visualization is essential for understanding the underlying structure of time series data and identifying patterns that may not be visible in the raw series.
// anyplot.ai
// timeseries-decomposition: Time Series Decomposition Plot
// Library: muix 7.29.1 | JavaScript 22.23.2
// Quality: 89/100 | Created: 2026-09-09
import { LineChart } from "@mui/x-charts/LineChart";
import { ChartsReferenceLine } from "@mui/x-charts/ChartsReferenceLine";
import { Box, Typography } from "@mui/material";

const t = window.ANYPLOT_TOKENS;

// --- Data (in-memory, deterministic) ----------------------------------------
// Monthly retail sales revenue ($ thousands), 10 years — additive decomposition:
// original = trend + seasonal + residual
const MONTHS = 120;

// Fixed-seed LCG — the browser has no seeded Math.random
let seed = 42;
function nextRandom() {
  seed = (seed * 1103515245 + 12345) % 2147483648;
  return seed / 2147483648;
}

// Jan..Dec seasonal index: winter dip, Nov/Dec holiday spike, sums to 0
const SEASONAL_INDEX = [-22, -18, -10, -4, 2, 6, 8, 4, -2, -6, 14, 28];

const dates = [];
const trendSeries = [];
const seasonalSeries = [];
const residualSeries = [];
const originalSeries = [];

for (let i = 0; i < MONTHS; i += 1) {
  const trendValue = 240 + 1.9 * i + 0.006 * i * i;
  const seasonalValue = SEASONAL_INDEX[i % 12];
  const residualValue = (nextRandom() - 0.5) * 24;

  dates.push(new Date(2015, i, 1));
  trendSeries.push(trendValue);
  seasonalSeries.push(seasonalValue);
  residualSeries.push(residualValue);
  originalSeries.push(trendValue + seasonalValue + residualValue);
}

const formatMonth = (date) => date.toLocaleDateString("en-US", { month: "short", year: "numeric" });

// Canonical Imprint 1->N order, top to bottom: Original, Trend, Seasonal,
// Residual each take the next palette slot. This also keeps every series a
// fixed hex that stays identical across themes (no theme-adaptive tokens on
// data colors).
const PANELS = [
  { label: "Original", data: originalSeries, color: t.palette[0], zeroLine: false },
  { label: "Trend", data: trendSeries, color: t.palette[1], zeroLine: false },
  { label: "Seasonal", data: seasonalSeries, color: t.palette[2], zeroLine: true },
  { label: "Residual", data: residualSeries, color: t.palette[3], zeroLine: true },
];

const TITLE = "timeseries-decomposition · javascript · muix · anyplot.ai";
const TITLE_HEIGHT = 46;

// --- Chart (default-exported component — the harness mounts it) ------------
export default function Chart() {
  const { width, height } = window.ANYPLOT_SIZE;
  const panelHeight = (height - TITLE_HEIGHT) / PANELS.length;

  return (
    <Box sx={{ width, height, display: "flex", flexDirection: "column" }}>
      <Typography
        sx={{
          height: TITLE_HEIGHT,
          lineHeight: `${TITLE_HEIGHT}px`,
          pl: 1,
          color: t.ink,
          fontSize: 22,
          fontWeight: 500,
        }}
      >
        {TITLE}
      </Typography>
      {PANELS.map((panel, index) => {
        const isLast = index === PANELS.length - 1;
        return (
          <Box key={panel.label} sx={{ position: "relative" }}>
            <Typography
              sx={{
                position: "absolute",
                top: 6,
                left: 96,
                fontSize: 15,
                fontWeight: 600,
                color: t.ink,
                pointerEvents: "none",
              }}
            >
              {panel.label}
            </Typography>
            {/* Native yAxis.label collides with tick numbers in these short
                panels regardless of margin, so the units label is drawn by
                hand instead, spanning the plot area (excludes the x-axis
                band at the bottom). */}
            <Box
              sx={{
                position: "absolute",
                left: 2,
                top: 0,
                bottom: isLast ? 56 : 8,
                width: 16,
                display: "flex",
                alignItems: "center",
                justifyContent: "center",
                pointerEvents: "none",
              }}
            >
              <Typography
                sx={{
                  writingMode: "vertical-rl",
                  transform: "rotate(180deg)",
                  fontSize: 13,
                  color: t.inkSoft,
                  whiteSpace: "nowrap",
                }}
              >
                $k
              </Typography>
            </Box>
            <LineChart
              width={width}
              height={panelHeight}
              skipAnimation
              series={[
                {
                  data: panel.data,
                  label: panel.label,
                  color: panel.color,
                  showMark: false,
                  curve: "monotoneX",
                },
              ]}
              xAxis={[
                {
                  data: dates,
                  scaleType: "time",
                  valueFormatter: isLast ? formatMonth : () => "",
                },
              ]}
              margin={{ left: 88, right: 30, top: 14, bottom: isLast ? 56 : 8 }}
              grid={{ horizontal: true }}
              slotProps={{ legend: { hidden: true } }}
            >
              {panel.zeroLine ? (
                <ChartsReferenceLine
                  y={0}
                  lineStyle={{ stroke: t.inkSoft, strokeDasharray: "4 4", strokeOpacity: 0.6 }}
                />
              ) : null}
            </LineChart>
          </Box>
        );
      })}
    </Box>
  );
}
Runnable source as JSON, for any HTTP client: https://api.anyplot.ai/specs/timeseries-decomposition/muix/code. Any spec id and library id listed in llms-full.txt fit the same URL shape; every URL below is complete and callable.
{
  "spec_id": "timeseries-decomposition",
  "language": "javascript",
  "library": "muix",
  "page": "https://anyplot.ai/timeseries-decomposition/javascript/muix",
  "hub": "https://anyplot.ai/timeseries-decomposition",
  "code_json": "https://api.anyplot.ai/specs/timeseries-decomposition/muix/code",
  "spec_json": "https://api.anyplot.ai/specs/timeseries-decomposition",
  "render_light_png": "https://storage.googleapis.com/anyplot-images/plots/timeseries-decomposition/javascript/muix/plot-light.png",
  "render_dark_png": "https://storage.googleapis.com/anyplot-images/plots/timeseries-decomposition/javascript/muix/plot-dark.png",
  "interactive_light_html": "https://storage.googleapis.com/anyplot-images/plots/timeseries-decomposition/javascript/muix/plot-light.html",
  "interactive_dark_html": "https://storage.googleapis.com/anyplot-images/plots/timeseries-decomposition/javascript/muix/plot-dark.html",
  "quality_score": 89.0,
  "license": "MIT",
  "guide": "https://anyplot.ai/llms.txt"
}
Part of Time Series Decomposition Plot on anyplot.ai.