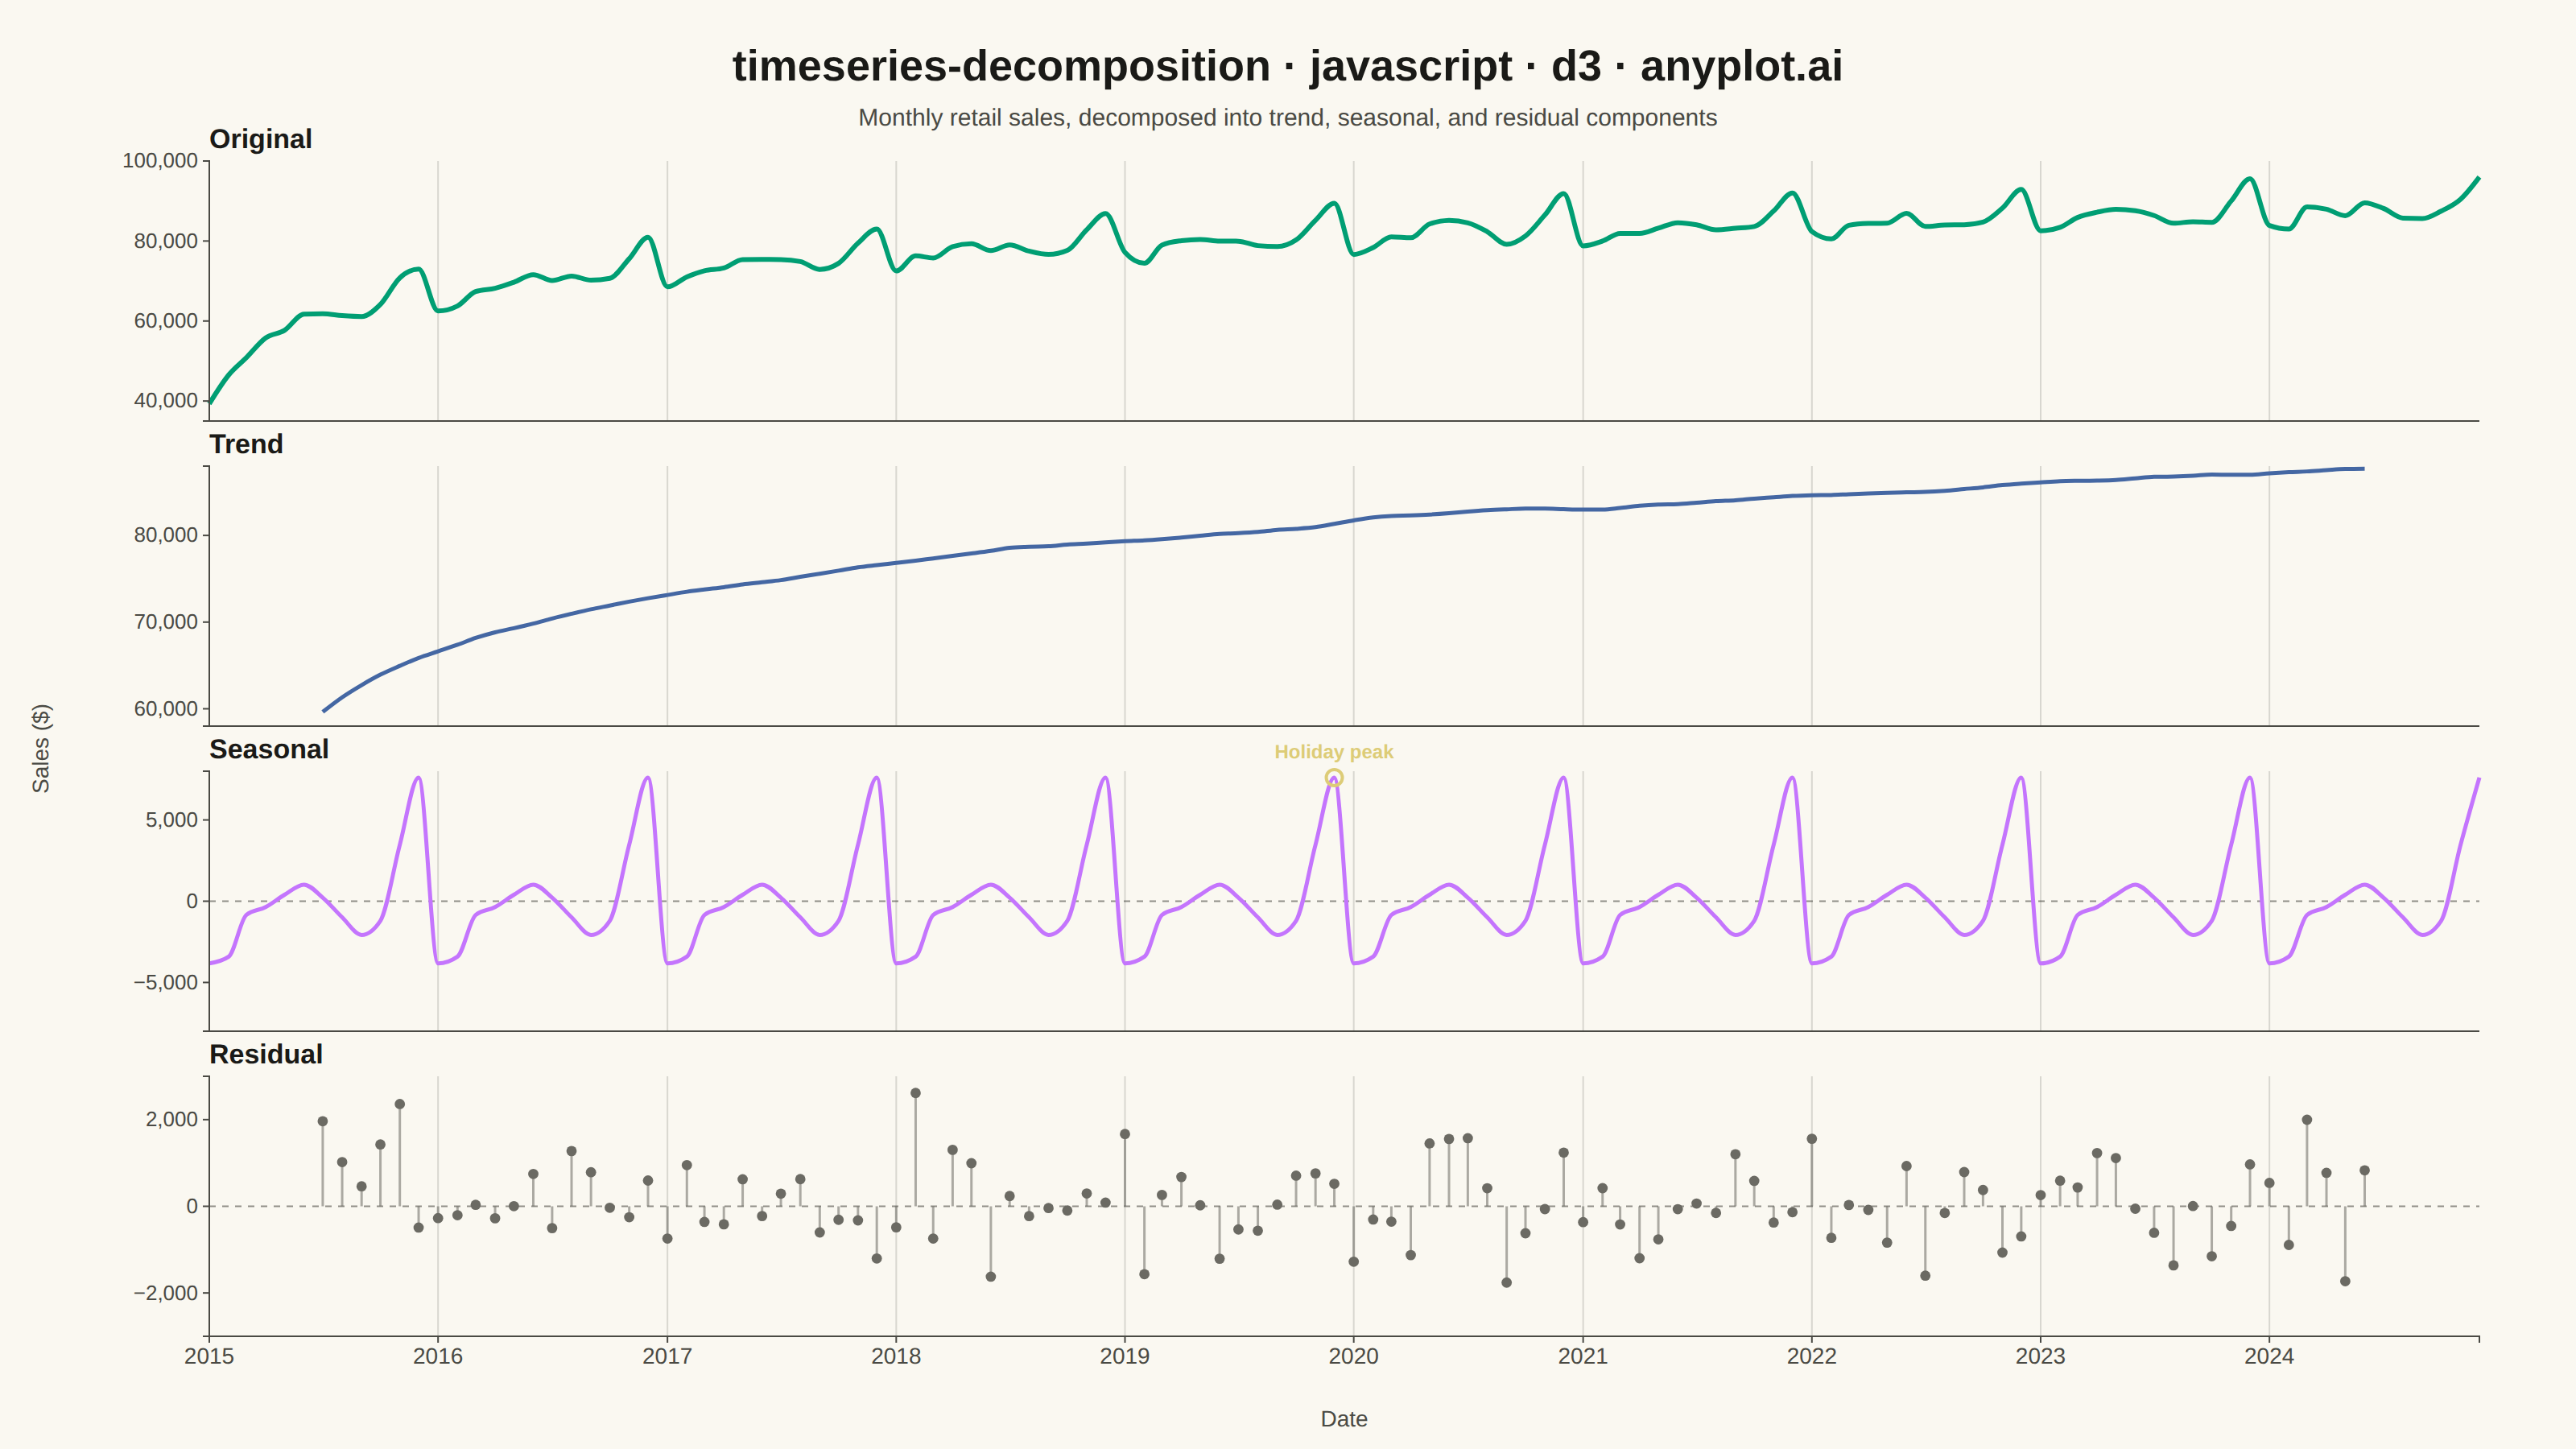
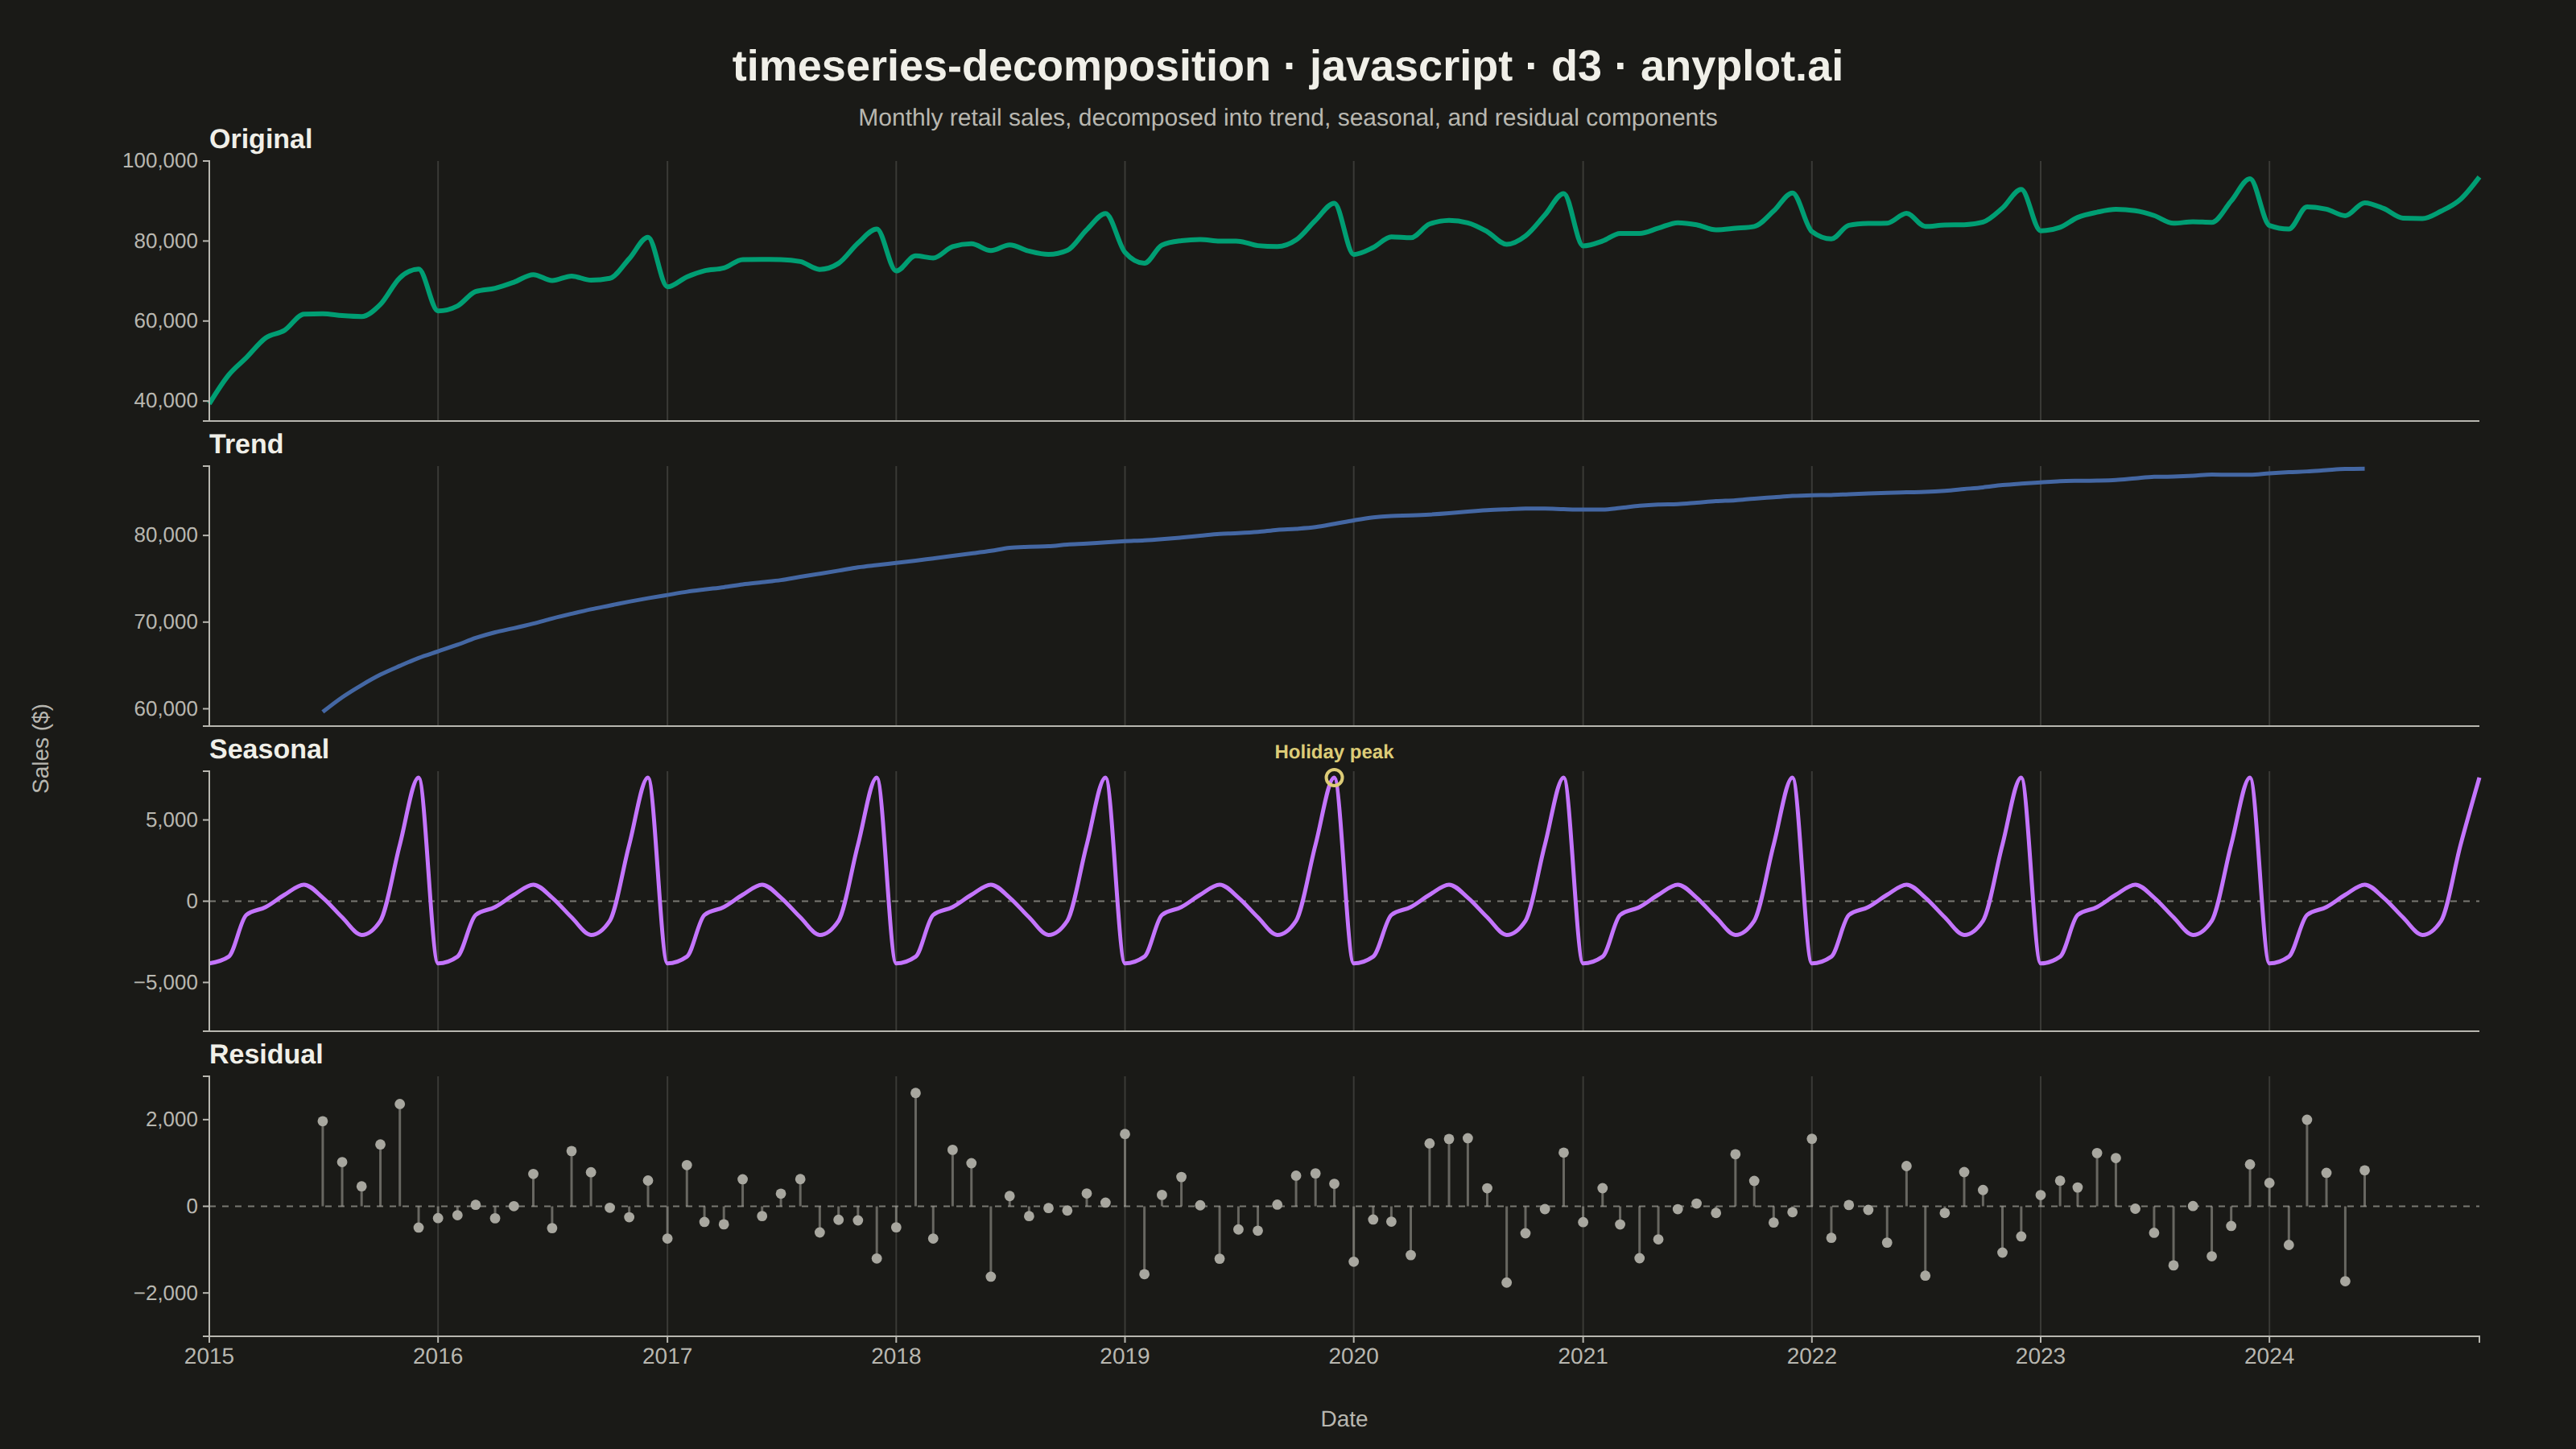
The same plot in 14 other libraries — JavaScript: Chart.js, Apache ECharts, Highcharts, MUI X Charts; Python: Altair, Bokeh, lets-plot, Matplotlib, Plotly, plotnine, Pygal, Seaborn; R: ggplot2; Julia: Makie.jl. Compare all 15 side by side: Time Series Decomposition Plot in Python, R, Julia and JavaScript.
A time series decomposition plot displays a time series broken down into its constituent components: the original series, trend, seasonal pattern, and residual noise. Each component is shown as a separate subplot stacked vertically, sharing a common time axis. This visualization is essential for understanding the underlying structure of time series data and identifying patterns that may not be visible in the raw series.
// anyplot.ai
// timeseries-decomposition: Time Series Decomposition Plot
// Library: d3 7.9.0 | JavaScript 22.23.2
// Quality: 92/100 | Created: 2026-09-09

const t = window.ANYPLOT_TOKENS;
const theme = window.ANYPLOT_THEME === "dark" ? "dark" : "light";
const muted = theme === "dark" ? "#A8A79F" : "#6B6A63";
const { width, height } = window.ANYPLOT_SIZE;

// --- Data (in-memory, deterministic LCG — no seeded RNG in the browser) -----
function lcg(seed) {
  let state = seed >>> 0;
  return () => {
    state = (state * 1664525 + 1013904223) >>> 0;
    return state / 4294967296;
  };
}
function approxNormal(rand) {
  // Irwin-Hall sum-of-12-uniforms approximation of a standard normal draw
  let sum = 0;
  for (let i = 0; i < 12; i += 1) sum += rand();
  return sum - 6;
}

const PERIOD = 12; // monthly seasonality
const N = 10 * PERIOD; // 10 years of monthly retail sales

const rand = lcg(7);
const dates = [];
const sales = [];
// Holiday-shopping seasonal shape: soft summer dip, sharp Nov/Dec spike
const SEASONAL_SHAPE = [
  -3200, -2600, -800, 400, 1200, 1800, 900, -400, -1600, -600, 4200, 8600,
];
for (let i = 0; i < N; i += 1) {
  const d = new Date(Date.UTC(2015, i, 1));
  dates.push(d);
  const trendComponent = 42000 + 9500 * Math.log1p(i); // decelerating, saturating growth
  const seasonalComponent = SEASONAL_SHAPE[d.getUTCMonth()];
  const noiseComponent = 900 * approxNormal(rand);
  sales.push(trendComponent + seasonalComponent + noiseComponent);
}

// --- Additive decomposition (centered moving average + seasonal averaging) --
function centeredMovingAverage(values, period) {
  const half = period / 2;
  const out = new Array(values.length).fill(null);
  for (let i = half; i < values.length - half; i += 1) {
    let sum = values[i - half] * 0.5 + values[i + half] * 0.5;
    for (let j = i - half + 1; j <= i + half - 1; j += 1) sum += values[j];
    out[i] = sum / period;
  }
  return out;
}

const trend = centeredMovingAverage(sales, PERIOD);

const seasonalSums = new Array(PERIOD).fill(0);
const seasonalCounts = new Array(PERIOD).fill(0);
for (let i = 0; i < N; i += 1) {
  if (trend[i] === null) continue;
  const idx = i % PERIOD;
  seasonalSums[idx] += sales[i] - trend[i];
  seasonalCounts[idx] += 1;
}
const seasonalRaw = seasonalSums.map((s, idx) => s / seasonalCounts[idx]);
const seasonalMean = d3.mean(seasonalRaw);
const seasonalIndex = seasonalRaw.map((s) => s - seasonalMean);
const seasonal = dates.map((d) => seasonalIndex[d.getUTCMonth()]);
const residual = sales.map((v, i) =>
  trend[i] === null ? null : v - trend[i] - seasonal[i],
);

// --- Layout -------------------------------------------------------------
const margin = { top: 100, right: 60, bottom: 70, left: 130 };
const iw = width - margin.left - margin.right;
const ih = height - margin.top - margin.bottom;
const panelGap = 28;

const panels = [
  { key: "original", label: "Original", color: t.palette[0], values: sales },
  { key: "trend", label: "Trend", color: t.palette[2], values: trend },
  { key: "seasonal", label: "Seasonal", color: t.palette[1], values: seasonal },
  { key: "residual", label: "Residual", color: muted, values: residual },
];
const panelHeight = (ih - panelGap * (panels.length - 1)) / panels.length;

const x = d3.scaleUtc().domain(d3.extent(dates)).range([0, iw]);
const xTicks = d3.utcYear.every(1).range(dates[0], dates[N - 1]);

const svg = d3
  .select("#container")
  .append("svg")
  .attr("width", width)
  .attr("height", height);

// --- Title ----------------------------------------------------------------
svg
  .append("text")
  .attr("x", width / 2)
  .attr("y", 50)
  .attr("text-anchor", "middle")
  .attr("fill", t.ink)
  .style("font-size", "27px")
  .style("font-weight", "700")
  .text("timeseries-decomposition · javascript · d3 · anyplot.ai");
svg
  .append("text")
  .attr("x", width / 2)
  .attr("y", 78)
  .attr("text-anchor", "middle")
  .attr("fill", t.inkSoft)
  .style("font-size", "15px")
  .text(
    "Monthly retail sales, decomposed into trend, seasonal, and residual components",
  );

// --- Panels -----------------------------------------------------------------
const panelGroups = svg
  .selectAll(".panel")
  .data(panels)
  .join("g")
  .attr("class", "panel")
  .attr(
    "transform",
    (panel, i) =>
      `translate(${margin.left},${margin.top + i * (panelHeight + panelGap)})`,
  );

panelGroups.each(function (panel, i) {
  const isLast = i === panels.length - 1;
  const g = d3.select(this);

  const points = dates.map((d, j) => ({ date: d, value: panel.values[j] }));
  const defined = points.filter((p) => p.value !== null);
  let [lo, hi] = d3.extent(defined, (p) => p.value);
  if (panel.key === "seasonal" || panel.key === "residual") {
    const span = Math.max(Math.abs(lo), Math.abs(hi));
    lo = -span;
    hi = span;
  }
  const y = d3.scaleLinear().domain([lo, hi]).nice().range([panelHeight, 0]);

  // Vertical gridlines shared across panels — trace one date through all four
  g.selectAll(".gridline")
    .data(xTicks)
    .join("line")
    .attr("x1", (d) => x(d))
    .attr("x2", (d) => x(d))
    .attr("y1", 0)
    .attr("y2", panelHeight)
    .attr("stroke", t.grid)
    .attr("stroke-width", 1);

  // Zero reference line for signed components
  if (lo < 0 && hi > 0) {
    g.append("line")
      .attr("x1", 0)
      .attr("x2", iw)
      .attr("y1", y(0))
      .attr("y2", y(0))
      .attr("stroke", t.inkSoft)
      .attr("stroke-width", 1)
      .attr("stroke-dasharray", "4,4")
      .attr("opacity", 0.6);
  }

  if (panel.key === "residual") {
    g.selectAll(".resid-stem")
      .data(defined)
      .join("line")
      .attr("x1", (d) => x(d.date))
      .attr("x2", (d) => x(d.date))
      .attr("y1", y(0))
      .attr("y2", (d) => y(d.value))
      .attr("stroke", panel.color)
      .attr("stroke-width", 1.5)
      .attr("opacity", 0.55);
    g.selectAll(".resid-dot")
      .data(defined)
      .join("circle")
      .attr("cx", (d) => x(d.date))
      .attr("cy", (d) => y(d.value))
      .attr("r", 3.2)
      .attr("fill", panel.color);
  } else {
    const line = d3
      .line()
      .defined((d) => d.value !== null)
      .x((d) => x(d.date))
      .y((d) => y(d.value))
      .curve(d3.curveMonotoneX);
    g.append("path")
      .datum(points)
      .attr("fill", "none")
      .attr("stroke", panel.color)
      .attr("stroke-width", panel.key === "original" ? 3 : 2.5)
      .attr("d", line);

    if (panel.key === "seasonal") {
      // Callout on a representative holiday peak to sharpen the data story
      const peakIndex = 4 * PERIOD + 11; // December, mid-series (avoids edge crowding)
      const peakDate = dates[peakIndex];
      const peakValue = seasonal[peakIndex];
      g.append("circle")
        .attr("cx", x(peakDate))
        .attr("cy", y(peakValue))
        .attr("r", 5)
        .attr("fill", "none")
        .attr("stroke", t.amber)
        .attr("stroke-width", 2);
      g.append("text")
        .attr("x", x(peakDate))
        .attr("y", y(peakValue) - 12)
        .attr("text-anchor", "middle")
        .attr("fill", t.amber)
        .style("font-size", "12px")
        .style("font-weight", "600")
        .text("Holiday peak");
    }
  }

  // Y axis
  const yAxis = g.append("g").call(d3.axisLeft(y).ticks(4).tickSize(4));
  yAxis.selectAll("text").attr("fill", t.inkSoft).style("font-size", "13px");
  yAxis.selectAll("line").attr("stroke", t.inkSoft);
  yAxis.select(".domain").attr("stroke", t.inkSoft);

  // X axis — tick labels only on the bottom panel, keep the domain line on all
  const xAxisG = g
    .append("g")
    .attr("transform", `translate(0,${panelHeight})`)
    .call(
      d3
        .axisBottom(x)
        .tickValues(xTicks)
        .tickFormat(isLast ? d3.utcFormat("%Y") : () => "")
        .tickSize(isLast ? 4 : 0),
    );
  xAxisG.selectAll("text").attr("fill", t.inkSoft).style("font-size", "14px");
  xAxisG.selectAll("line").attr("stroke", t.inkSoft);
  xAxisG.select(".domain").attr("stroke", t.inkSoft);

  // Panel label
  g.append("text")
    .attr("x", 0)
    .attr("y", -8)
    .attr("fill", t.ink)
    .style("font-size", "17px")
    .style("font-weight", "600")
    .text(panel.label);
});

// --- Shared x-axis label -----------------------------------------------------
svg
  .append("text")
  .attr("x", margin.left + iw / 2)
  .attr("y", height - 14)
  .attr("text-anchor", "middle")
  .attr("fill", t.inkSoft)
  .style("font-size", "14px")
  .text("Date");

// --- Shared y-axis unit label -------------------------------------------------
svg
  .append("text")
  .attr("transform", "rotate(-90)")
  .attr("x", -(margin.top + ih / 2))
  .attr("y", 30)
  .attr("text-anchor", "middle")
  .attr("fill", t.inkSoft)
  .style("font-size", "14px")
  .text("Sales ($)");
Runnable source as JSON, for any HTTP client: https://api.anyplot.ai/specs/timeseries-decomposition/d3/code. Any spec id and library id listed in llms-full.txt fit the same URL shape; every URL below is complete and callable.
{
  "spec_id": "timeseries-decomposition",
  "language": "javascript",
  "library": "d3",
  "page": "https://anyplot.ai/timeseries-decomposition/javascript/d3",
  "hub": "https://anyplot.ai/timeseries-decomposition",
  "code_json": "https://api.anyplot.ai/specs/timeseries-decomposition/d3/code",
  "spec_json": "https://api.anyplot.ai/specs/timeseries-decomposition",
  "render_light_png": "https://storage.googleapis.com/anyplot-images/plots/timeseries-decomposition/javascript/d3/plot-light.png",
  "render_dark_png": "https://storage.googleapis.com/anyplot-images/plots/timeseries-decomposition/javascript/d3/plot-dark.png",
  "interactive_light_html": "https://storage.googleapis.com/anyplot-images/plots/timeseries-decomposition/javascript/d3/plot-light.html",
  "interactive_dark_html": "https://storage.googleapis.com/anyplot-images/plots/timeseries-decomposition/javascript/d3/plot-dark.html",
  "quality_score": 92.0,
  "license": "MIT",
  "guide": "https://anyplot.ai/llms.txt"
}
Part of Time Series Decomposition Plot on anyplot.ai.