The same plot in 14 other libraries — JavaScript: D3.js, Apache ECharts, Highcharts, MUI X Charts; Python: Altair, Bokeh, lets-plot, Matplotlib, Plotly, plotnine, Pygal, Seaborn; R: ggplot2; Julia: Makie.jl. Compare all 15 side by side: Time Series Decomposition Plot in Python, R, Julia and JavaScript.
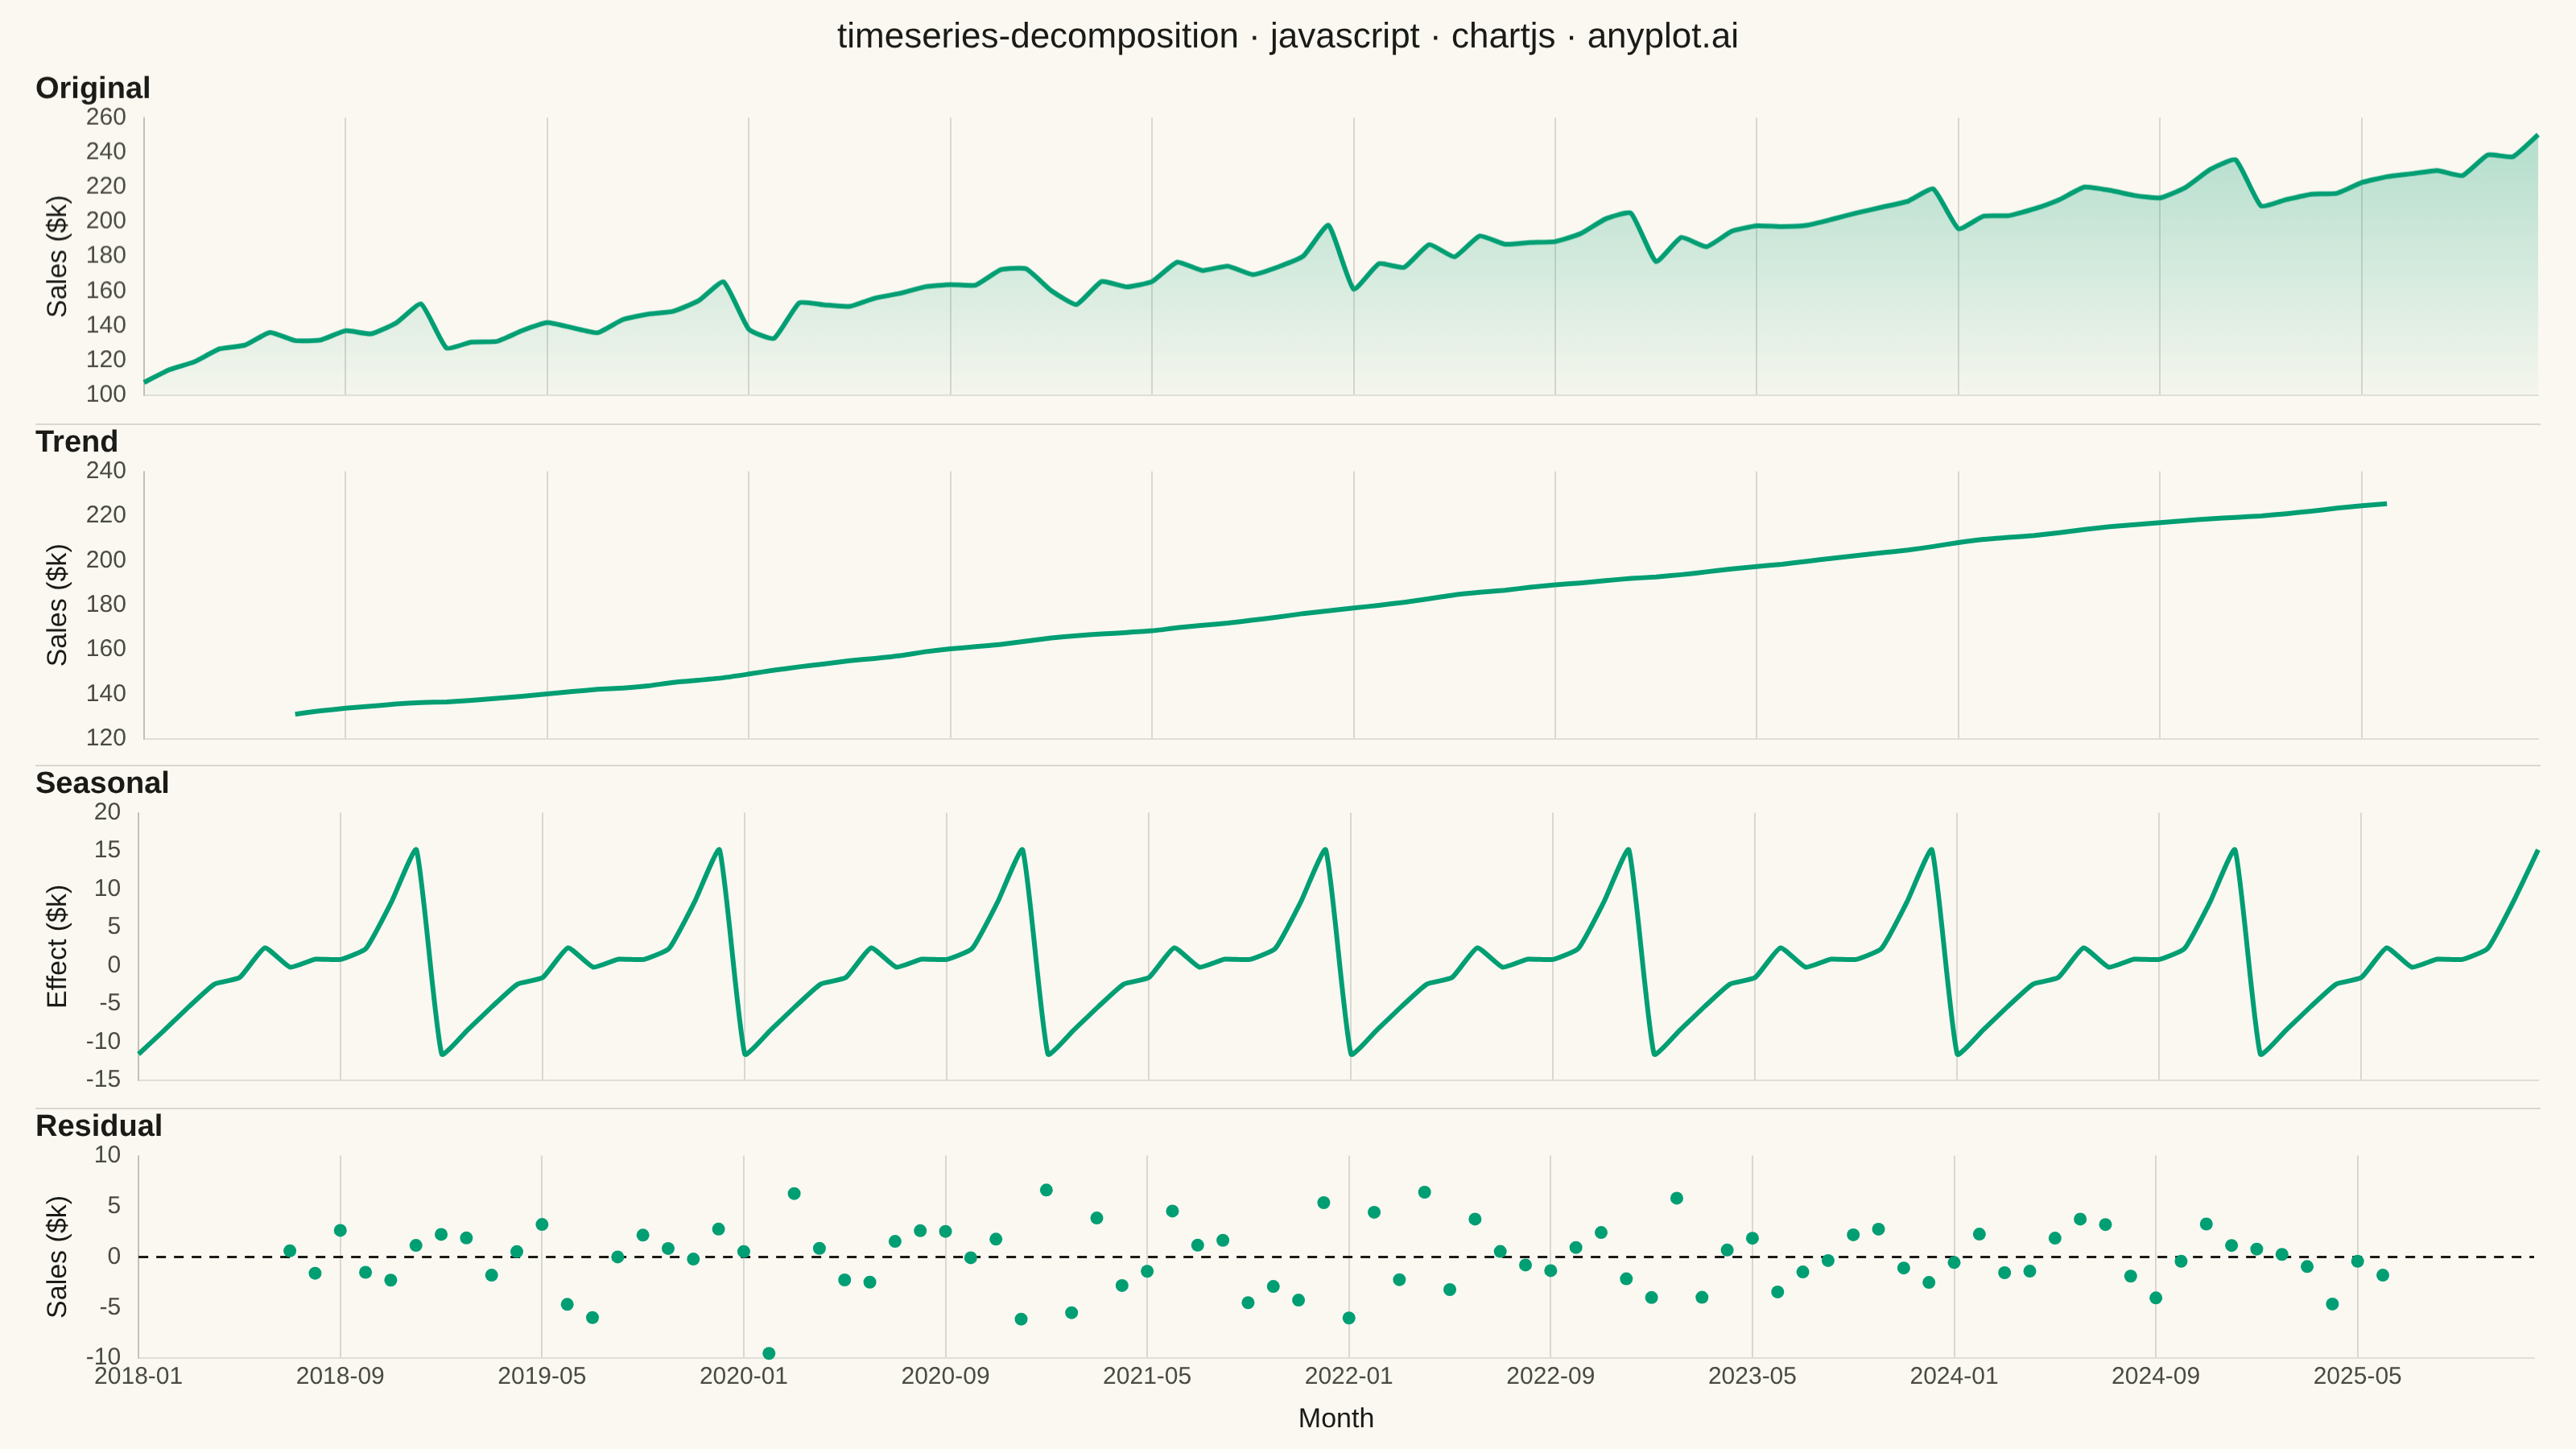
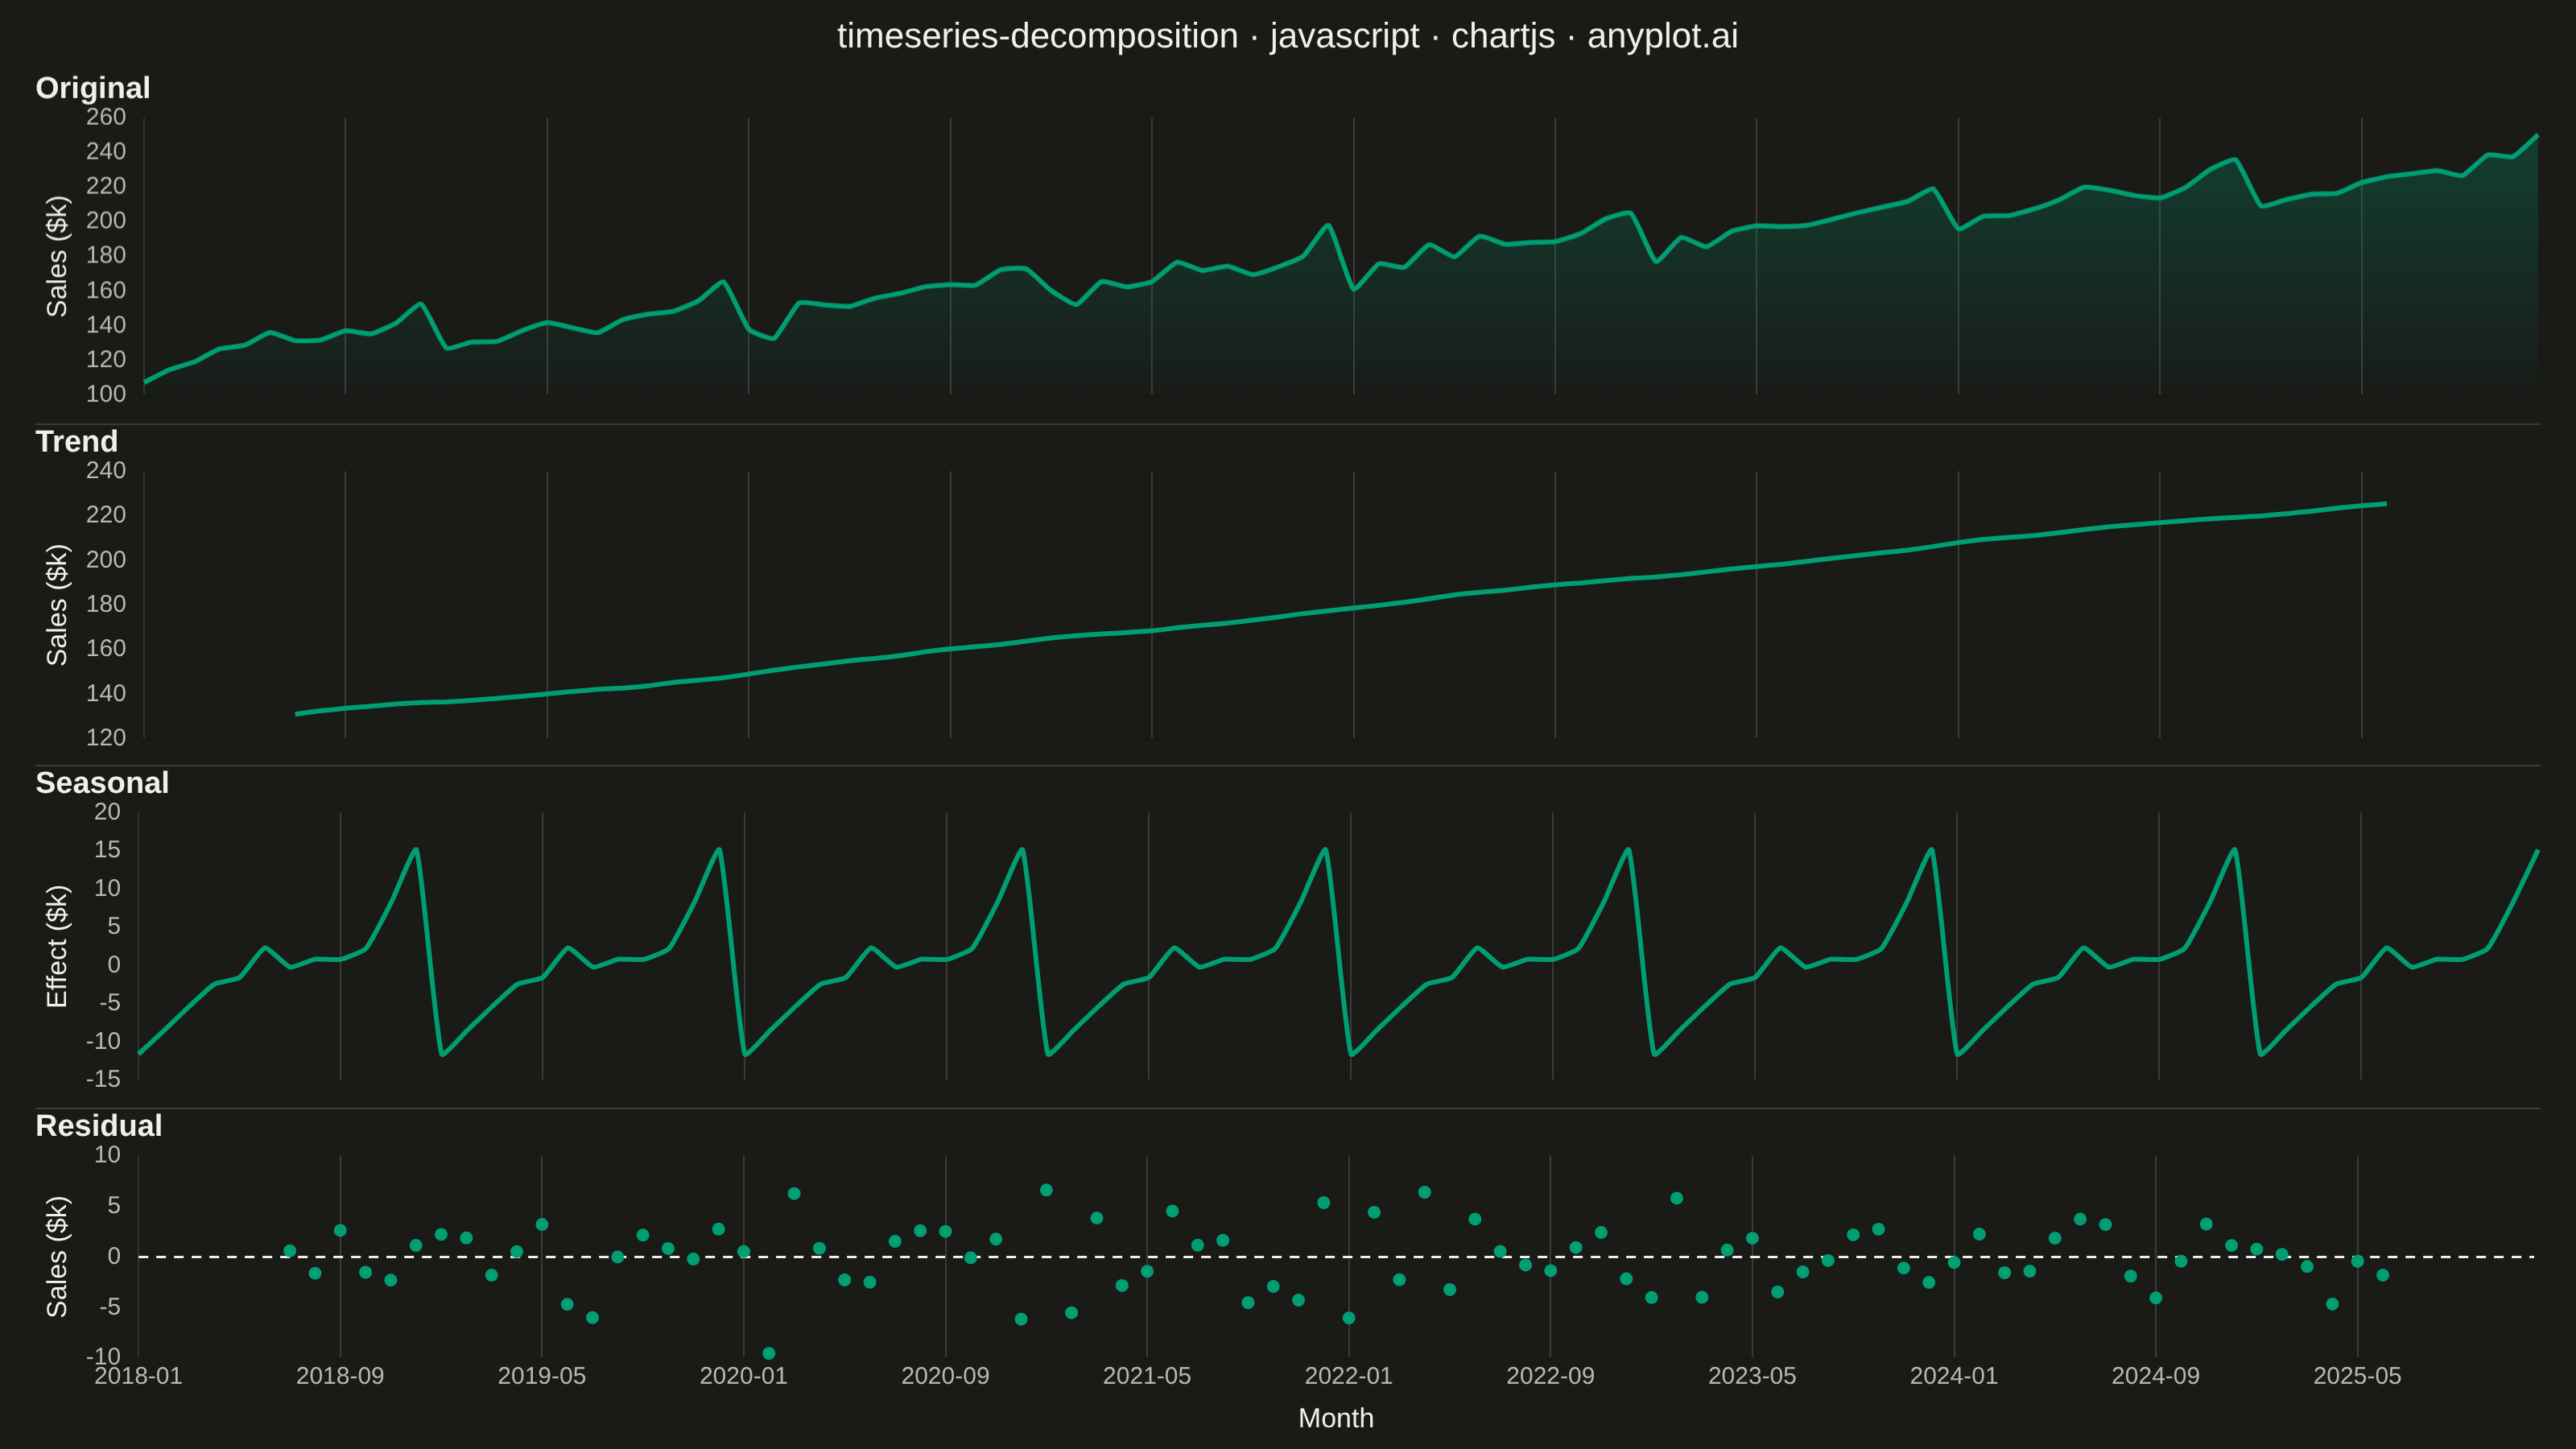
A time series decomposition plot displays a time series broken down into its constituent components: the original series, trend, seasonal pattern, and residual noise. Each component is shown as a separate subplot stacked vertically, sharing a common time axis. This visualization is essential for understanding the underlying structure of time series data and identifying patterns that may not be visible in the raw series.
// anyplot.ai
// timeseries-decomposition: Time Series Decomposition Plot
// Library: chartjs 4.4.7 | JavaScript 22.23.2
// Quality: 89/100 | Created: 2026-09-09

const t = window.ANYPLOT_TOKENS;

// --- Data: monthly retail sales, 2018-2025 (in-memory, deterministic) ------
const N_MONTHS = 96;
const START_YEAR = 2018;
const labels = Array.from({ length: N_MONTHS }, (_, i) => {
  const year = START_YEAR + Math.floor(i / 12);
  const month = (i % 12) + 1;
  return `${year}-${String(month).padStart(2, "0")}`;
});

// Fixed-seed LCG -> Box-Muller gaussian (browser has no seeded RNG)
let lcgSeed = 42;
function uniformRandom() {
  lcgSeed = (lcgSeed * 1103515245 + 12345) % 2147483648;
  return lcgSeed / 2147483648;
}
function gaussianNoise(std) {
  const u1 = Math.max(uniformRandom(), 1e-9);
  const u2 = uniformRandom();
  return Math.sqrt(-2 * Math.log(u1)) * Math.cos(2 * Math.PI * u2) * std;
}

function hexToRgba(hex, alpha) {
  const r = parseInt(hex.slice(1, 3), 16);
  const g = parseInt(hex.slice(3, 5), 16);
  const b = parseInt(hex.slice(5, 7), 16);
  return `rgba(${r}, ${g}, ${b}, ${alpha})`;
}

// Underlying growth (steady) + holiday-season seasonality (Jan=0 .. Dec=11)
const GROWTH_BASE = 120;
const GROWTH_SLOPE = 1.15;
const SEASONAL_PATTERN = [-9, -6, -2, 1, 3, 5, 6, 4, 2, 4, 11, 18];
const NOISE_STD = 3.5;

const salesKUsd = Array.from({ length: N_MONTHS }, (_, i) => {
  const growth = GROWTH_BASE + GROWTH_SLOPE * i;
  const seasonal = SEASONAL_PATTERN[i % 12];
  return growth + seasonal + gaussianNoise(NOISE_STD);
});

// --- Classical additive decomposition (centered 2x12 moving average) -------
const HALF_PERIOD = 6;
const trend = new Array(N_MONTHS).fill(null);
for (let i = HALF_PERIOD; i < N_MONTHS - HALF_PERIOD; i++) {
  let sum = 0.5 * salesKUsd[i - HALF_PERIOD] + 0.5 * salesKUsd[i + HALF_PERIOD];
  for (let k = -(HALF_PERIOD - 1); k <= HALF_PERIOD - 1; k++) sum += salesKUsd[i + k];
  trend[i] = sum / 12;
}

const detrended = salesKUsd.map((v, i) => (trend[i] === null ? null : v - trend[i]));
const seasonalIndex = Array.from({ length: 12 }, (_, m) => {
  const vals = detrended.filter((v, i) => i % 12 === m && v !== null);
  return vals.reduce((a, b) => a + b, 0) / vals.length;
});
const seasonalMean = seasonalIndex.reduce((a, b) => a + b, 0) / 12;
const centeredSeasonalIndex = seasonalIndex.map((v) => v - seasonalMean);
const seasonal = Array.from({ length: N_MONTHS }, (_, i) => centeredSeasonalIndex[i % 12]);

const residual = salesKUsd.map((v, i) => (trend[i] === null ? null : v - trend[i] - seasonal[i]));
const zeroLine = new Array(N_MONTHS).fill(0);

// --- Layout: four stacked panels sharing one time axis ----------------------
const container = document.getElementById("container");
container.style.display = "flex";
container.style.flexDirection = "column";
container.style.boxSizing = "border-box";
container.style.padding = "10px 22px 4px";
container.style.backgroundColor = t.pageBg;

const PANELS = [
  { key: "original", title: "Original", axisLabel: "Sales ($k)", data: salesKUsd, kind: "line", showMainTitle: true, flex: 1.2 },
  { key: "trend", title: "Trend", axisLabel: "Sales ($k)", data: trend, kind: "line", showMainTitle: false, flex: 1 },
  { key: "seasonal", title: "Seasonal", axisLabel: "Effect ($k)", data: seasonal, kind: "line", showMainTitle: false, flex: 1 },
  { key: "residual", title: "Residual", axisLabel: "Sales ($k)", data: residual, kind: "points", showMainTitle: false, flex: 1 },
];

PANELS.forEach((panel, idx) => {
  const row = document.createElement("div");
  row.style.flex = `${panel.flex} 1 0`;
  row.style.minHeight = "0";
  row.style.position = "relative";
  row.style.borderBottom = idx < PANELS.length - 1 ? `1px solid ${t.grid}` : "none";
  row.style.paddingBottom = idx < PANELS.length - 1 ? "4px" : "0";
  container.appendChild(row);

  const canvas = document.createElement("canvas");
  row.appendChild(canvas);

  const isBottom = idx === PANELS.length - 1;
  const isOriginal = panel.key === "original";
  const datasets = [
    {
      label: panel.title,
      data: panel.data,
      borderColor: t.palette[0],
      backgroundColor: isOriginal
        ? (context) => {
            const { chartArea, ctx } = context.chart;
            if (!chartArea) return hexToRgba(t.palette[0], 0.2);
            const gradient = ctx.createLinearGradient(0, chartArea.top, 0, chartArea.bottom);
            gradient.addColorStop(0, hexToRgba(t.palette[0], 0.3));
            gradient.addColorStop(1, hexToRgba(t.palette[0], 0.02));
            return gradient;
          }
        : t.palette[0],
      borderWidth: panel.kind === "line" ? 3 : 0,
      showLine: panel.kind === "line",
      pointRadius: panel.kind === "line" ? 0 : 4,
      pointHoverRadius: 0,
      spanGaps: false,
      tension: 0.15,
      fill: isOriginal,
    },
  ];
  if (panel.key === "residual") {
    datasets.push({
      label: "Zero reference",
      data: zeroLine,
      borderColor: t.ink,
      borderWidth: 1.5,
      borderDash: [6, 5],
      pointRadius: 0,
      showLine: true,
    });
  }

  new Chart(canvas, {
    type: "line",
    data: { labels, datasets },
    options: {
      responsive: true,
      maintainAspectRatio: false,
      animation: false,
      plugins: {
        title: {
          display: panel.showMainTitle,
          text: "timeseries-decomposition · javascript · chartjs · anyplot.ai",
          color: t.ink,
          font: { size: 22, weight: "500" },
          padding: { bottom: 8 },
        },
        subtitle: {
          display: true,
          text: panel.title,
          color: t.ink,
          align: "start",
          font: { size: 19, weight: "600" },
          padding: { bottom: 6 },
        },
        legend: { display: false },
      },
      scales: {
        x: {
          ticks: {
            display: isBottom,
            color: t.inkSoft,
            font: { size: 15 },
            maxRotation: 0,
            autoSkip: true,
            maxTicksLimit: 12,
          },
          grid: { color: t.grid, drawTicks: false },
          title: { display: isBottom, text: "Month", color: t.ink, font: { size: 17 } },
        },
        y: {
          ticks: { color: t.inkSoft, font: { size: 15 } },
          grid: { display: false },
          title: { display: true, text: panel.axisLabel, color: t.ink, font: { size: 17 } },
        },
      },
    },
  });
});
Runnable source as JSON, for any HTTP client: https://api.anyplot.ai/specs/timeseries-decomposition/chartjs/code. Any spec id and library id listed in llms-full.txt fit the same URL shape; every URL below is complete and callable.
{
  "spec_id": "timeseries-decomposition",
  "language": "javascript",
  "library": "chartjs",
  "page": "https://anyplot.ai/timeseries-decomposition/javascript/chartjs",
  "hub": "https://anyplot.ai/timeseries-decomposition",
  "code_json": "https://api.anyplot.ai/specs/timeseries-decomposition/chartjs/code",
  "spec_json": "https://api.anyplot.ai/specs/timeseries-decomposition",
  "render_light_png": "https://storage.googleapis.com/anyplot-images/plots/timeseries-decomposition/javascript/chartjs/plot-light.png",
  "render_dark_png": "https://storage.googleapis.com/anyplot-images/plots/timeseries-decomposition/javascript/chartjs/plot-dark.png",
  "interactive_light_html": "https://storage.googleapis.com/anyplot-images/plots/timeseries-decomposition/javascript/chartjs/plot-light.html",
  "interactive_dark_html": "https://storage.googleapis.com/anyplot-images/plots/timeseries-decomposition/javascript/chartjs/plot-dark.html",
  "quality_score": 89.0,
  "license": "MIT",
  "guide": "https://anyplot.ai/llms.txt"
}
Part of Time Series Decomposition Plot on anyplot.ai.