The same plot in 14 other libraries — JavaScript: Chart.js, D3.js, Highcharts, MUI X Charts; Python: Altair, Bokeh, lets-plot, Matplotlib, Plotly, plotnine, Pygal, Seaborn; R: ggplot2; Julia: Makie.jl. Compare all 15 side by side: Time Series Decomposition Plot in Python, R, Julia and JavaScript.
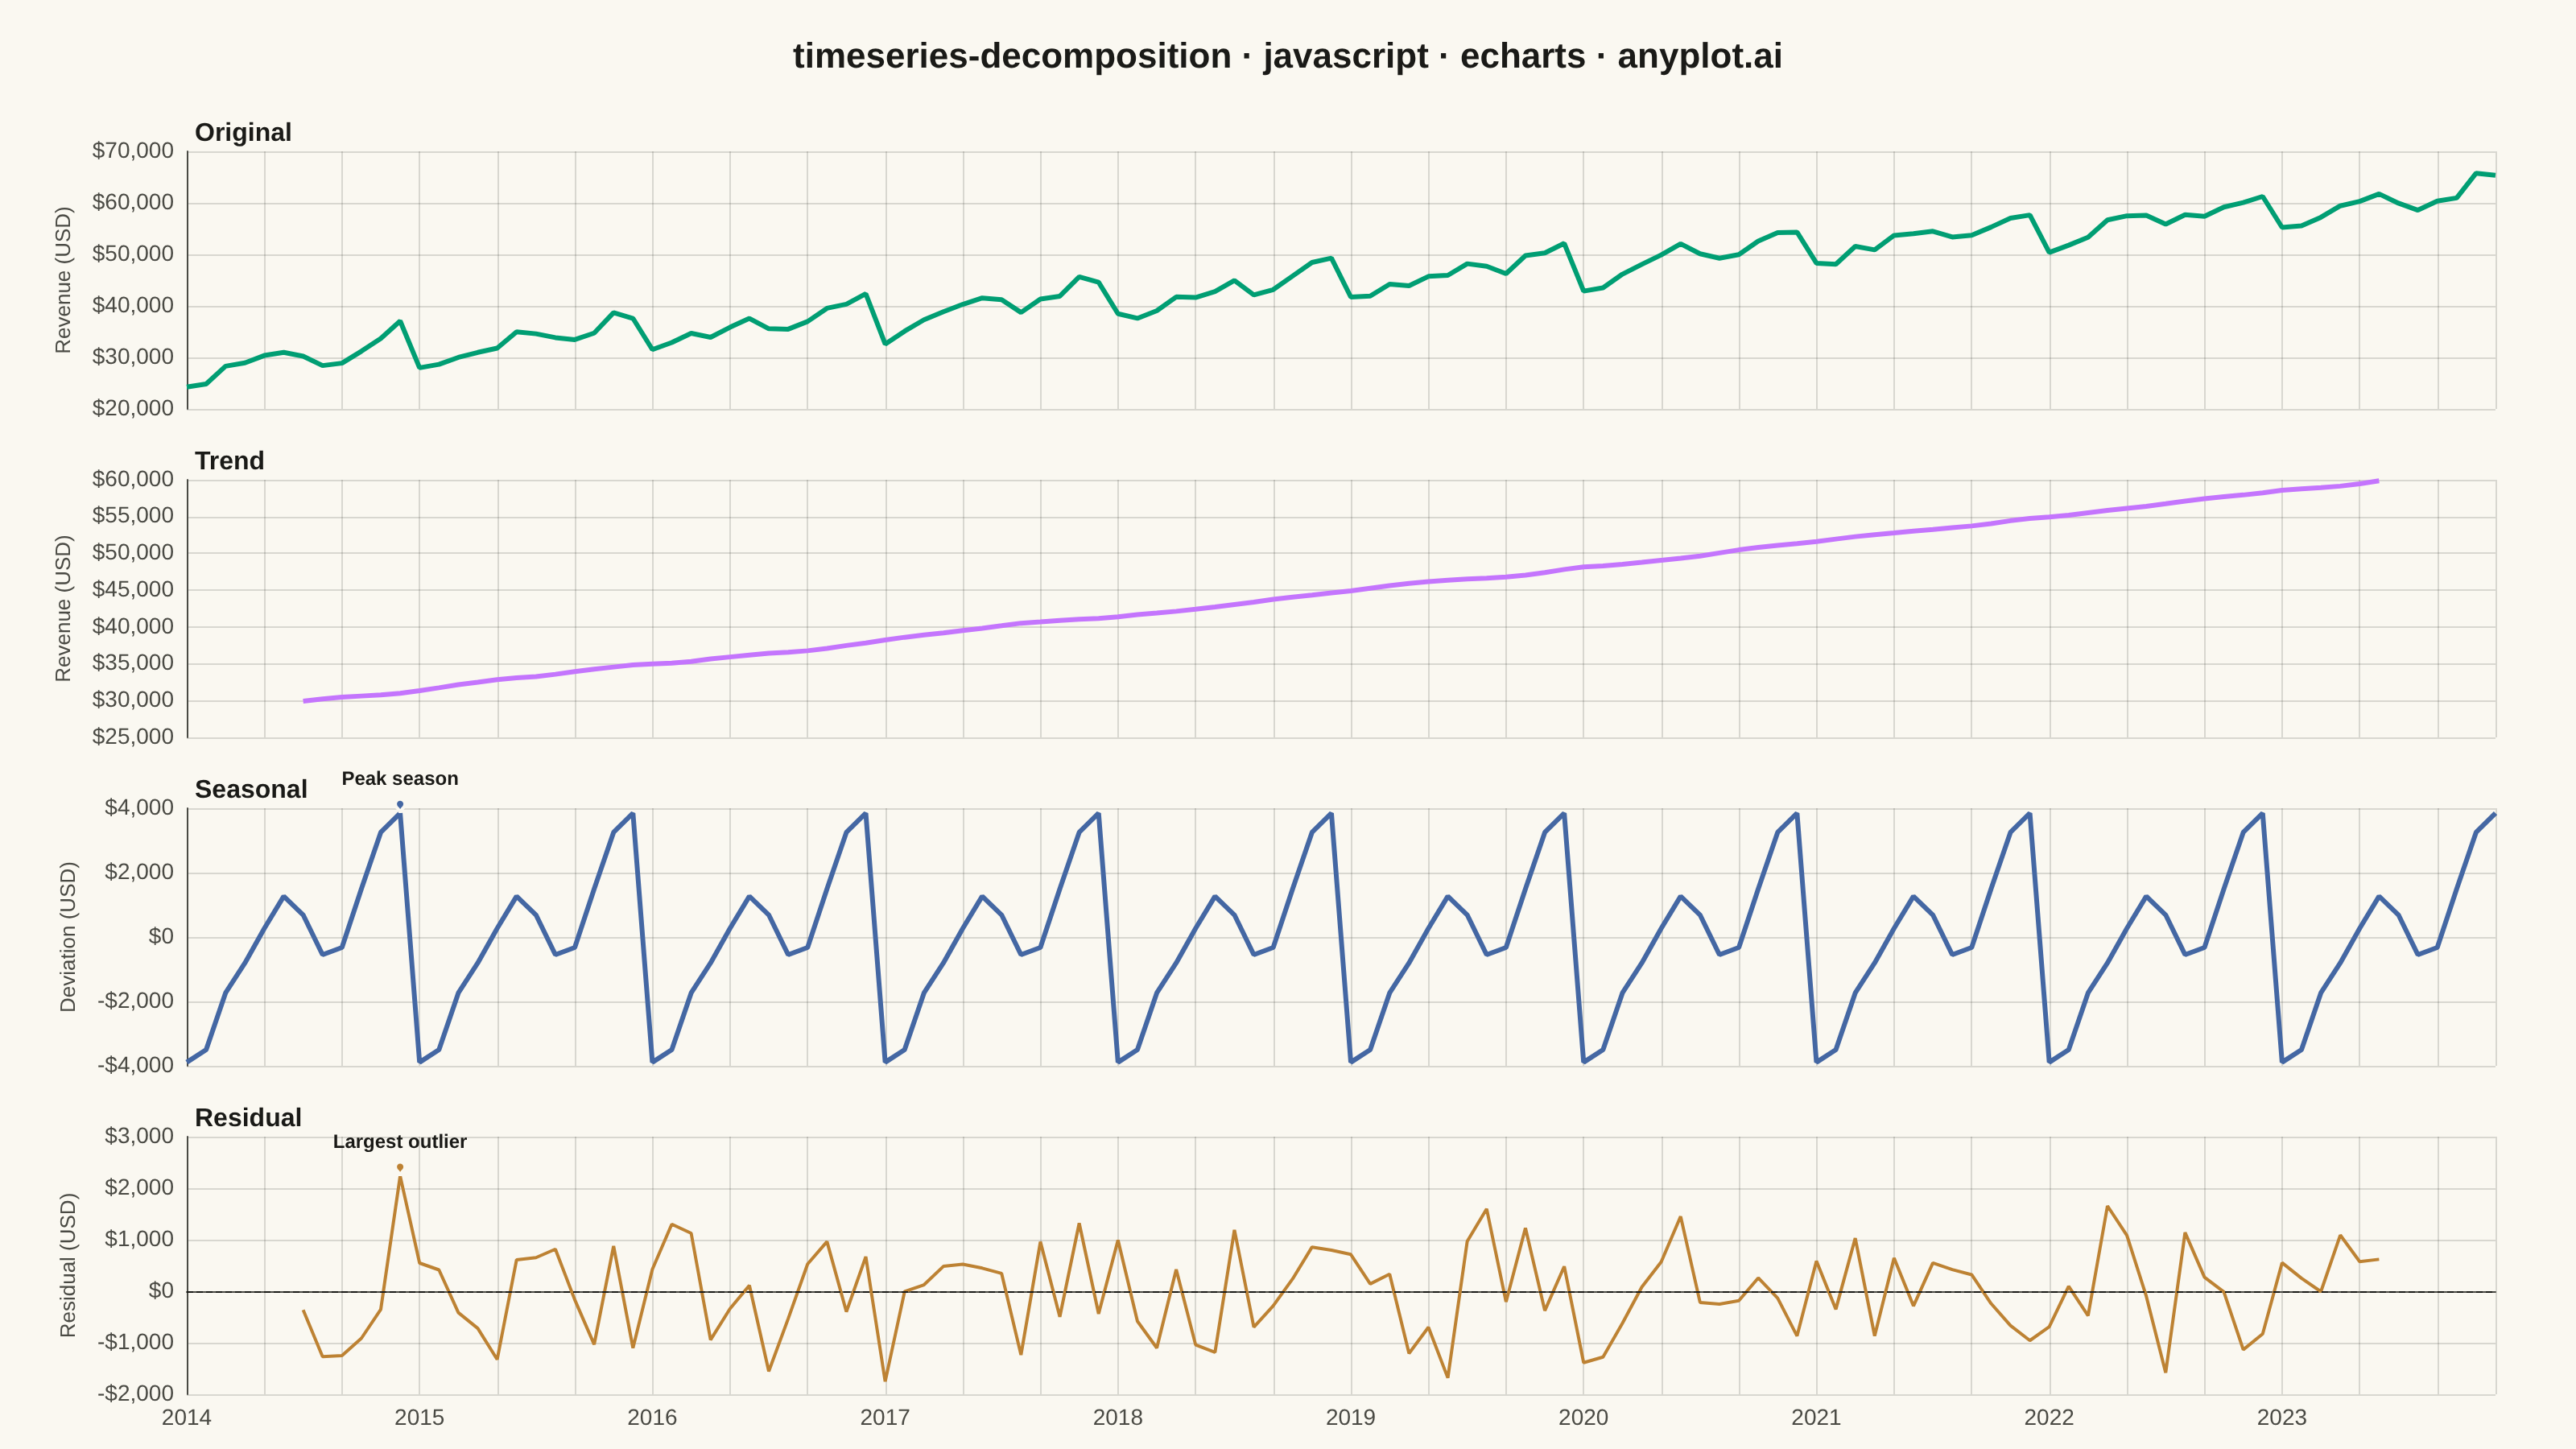
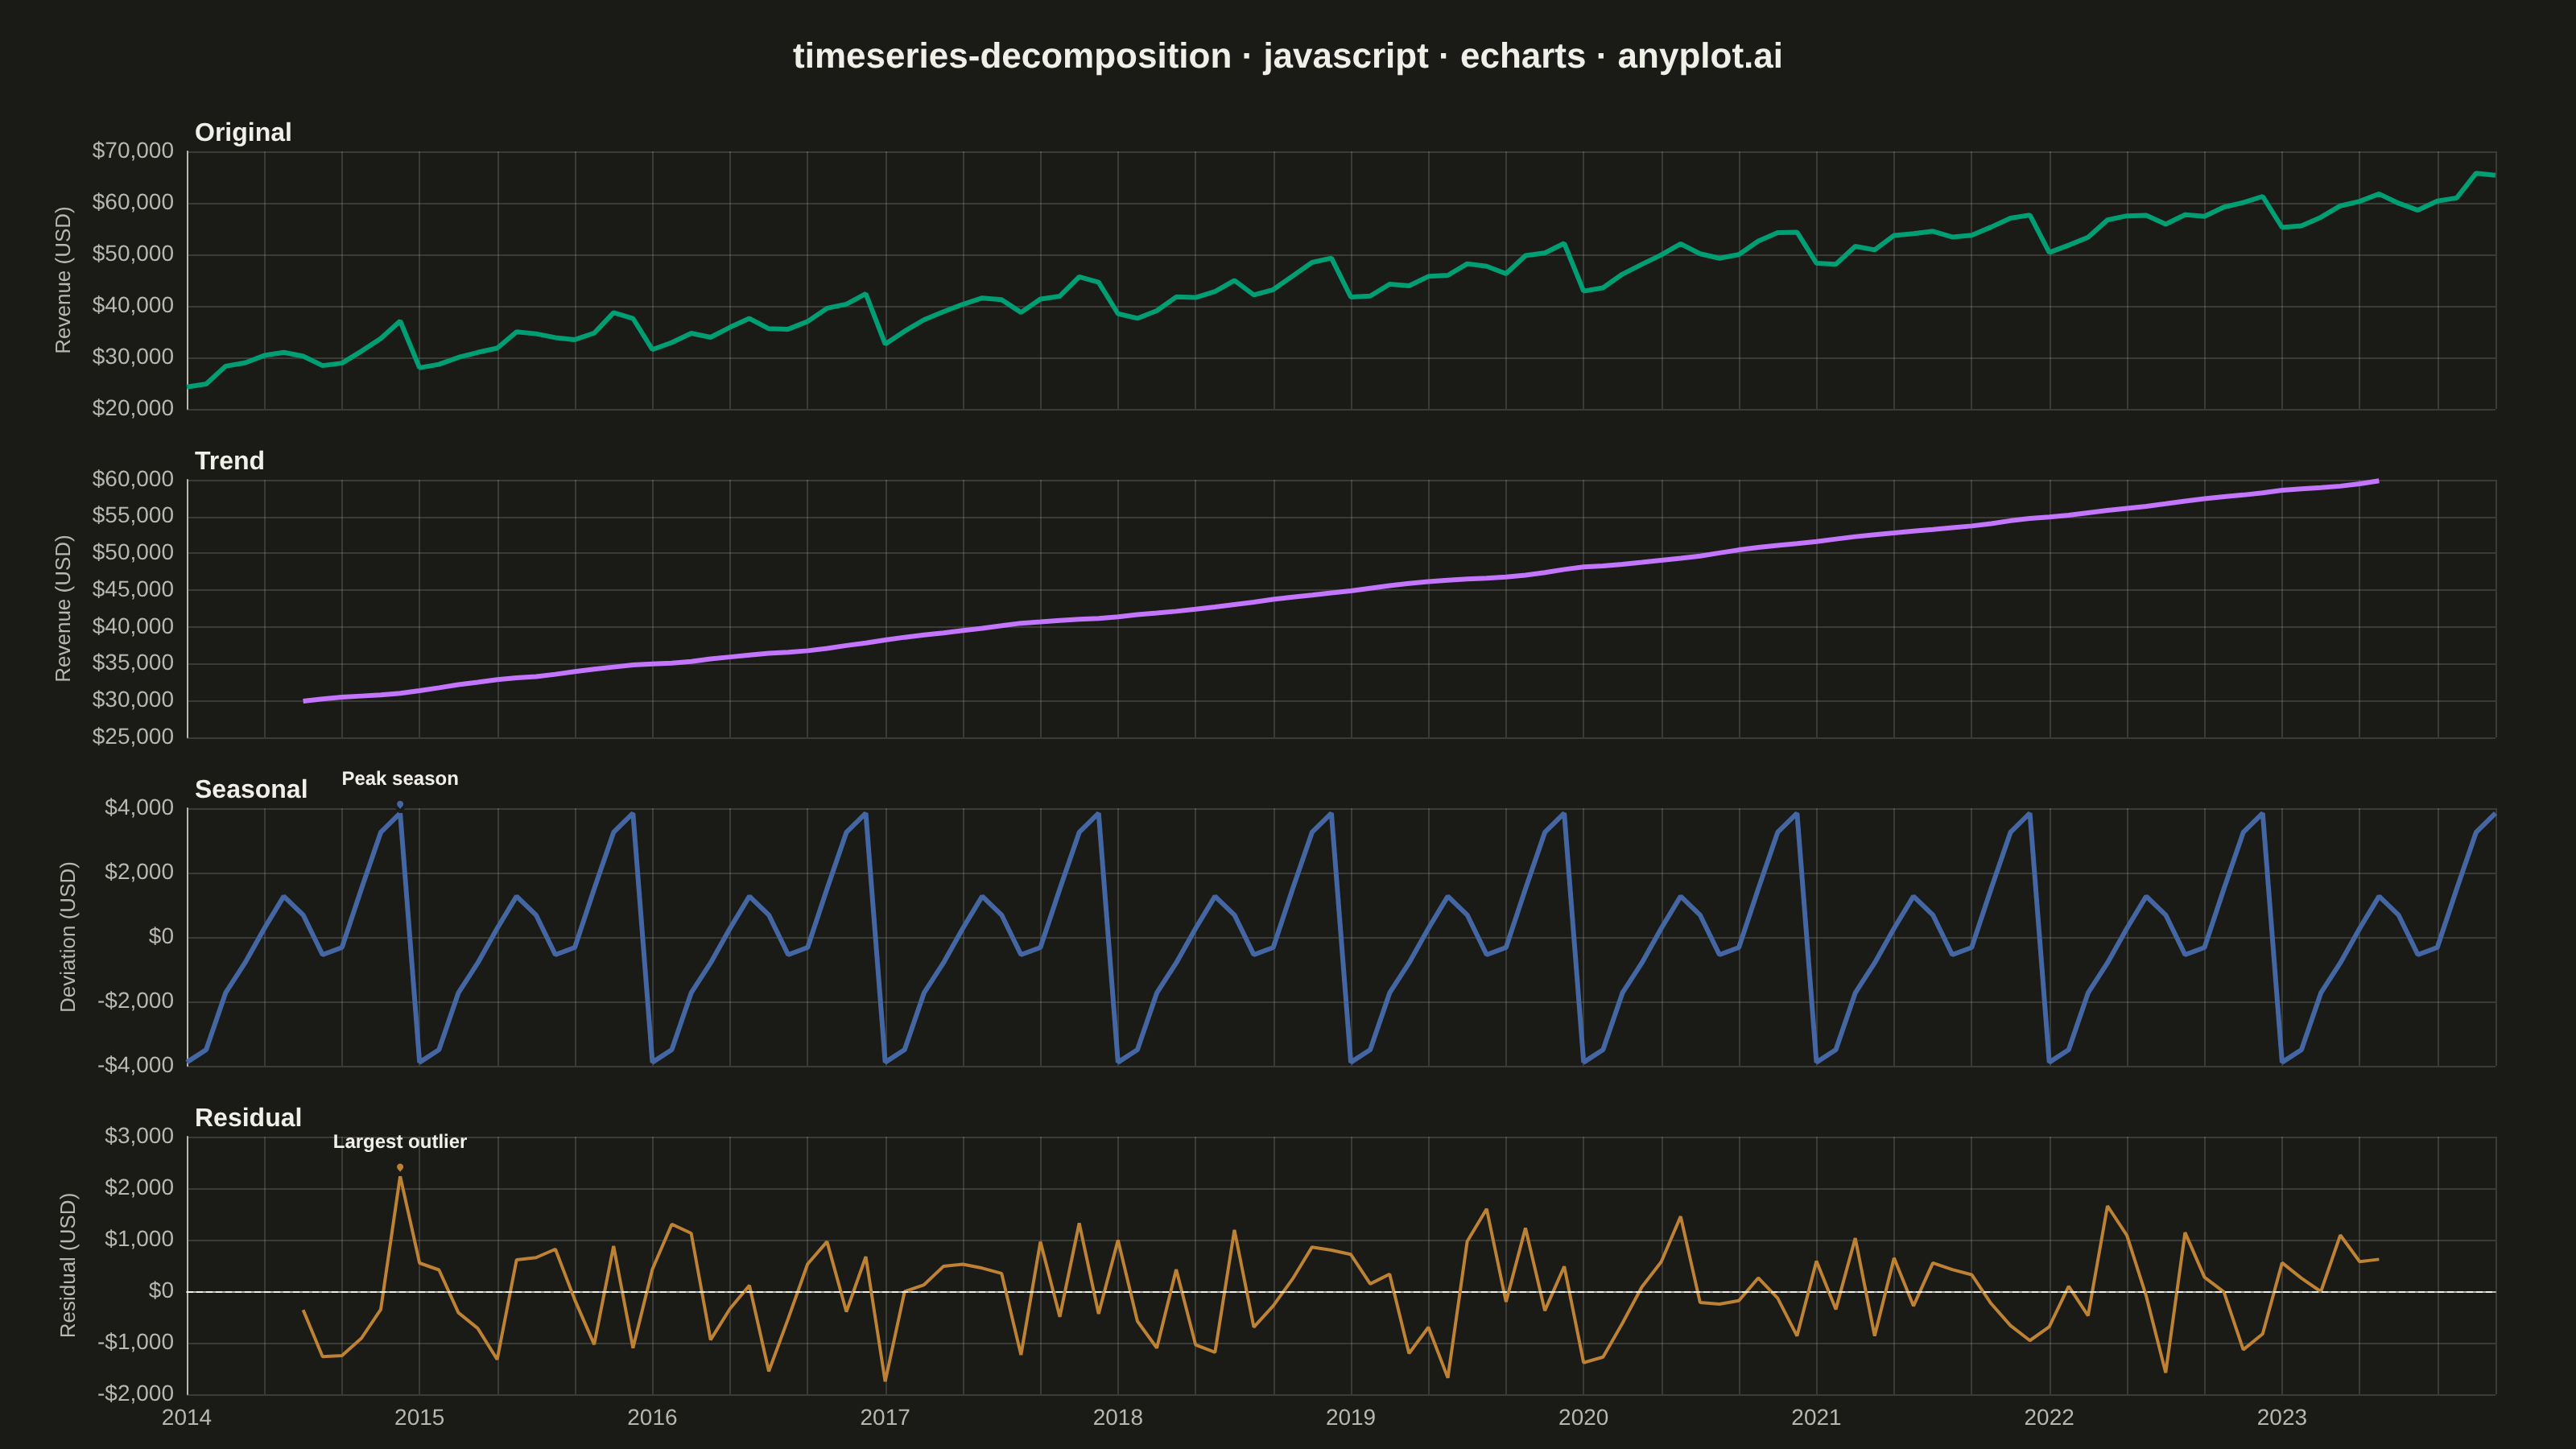
A time series decomposition plot displays a time series broken down into its constituent components: the original series, trend, seasonal pattern, and residual noise. Each component is shown as a separate subplot stacked vertically, sharing a common time axis. This visualization is essential for understanding the underlying structure of time series data and identifying patterns that may not be visible in the raw series.
// anyplot.ai
// timeseries-decomposition: Time Series Decomposition Plot
// Library: echarts 6.1.0 | JavaScript 22.23.2
// Quality: 91/100 | Created: 2026-09-09

const t = window.ANYPLOT_TOKENS;

// --- Data: 10 years of monthly e-commerce revenue (in-memory, deterministic) ---
const START_YEAR = 2014;
const NUM_MONTHS = 120; // 10 years, monthly cadence -> 10 full seasonal cycles

const dateLabels = [];
for (let idx = 0; idx < NUM_MONTHS; idx++) {
  const year = START_YEAR + Math.floor(idx / 12);
  const month = String((idx % 12) + 1).padStart(2, "0");
  dateLabels.push(`${year}-${month}`);
}

// Holiday-season lift baked into the synthetic series (Jan..Dec deviation, $)
const SEASONAL_TRUE = [-4000, -3500, -1500, -500, 500, 1000, 500, -500, 0, 1500, 3500, 4500];

let lcgSeed = 42;
const nextRandom = () => {
  lcgSeed = (lcgSeed * 1103515245 + 12345) & 0x7fffffff;
  return lcgSeed / 0x7fffffff;
};

const revenue = [];
for (let idx = 0; idx < NUM_MONTHS; idx++) {
  const trendTrue = 28000 + 280 * idx;
  const seasonTrue = SEASONAL_TRUE[idx % 12];
  const noise = (nextRandom() - 0.5) * 3000;
  revenue.push(Math.round(trendTrue + seasonTrue + noise));
}

// --- Classical additive decomposition (period = 12) --------------------------
const PERIOD = 12;
const HALF = PERIOD / 2;

const trendRaw = new Array(NUM_MONTHS).fill(null);
for (let idx = HALF; idx < NUM_MONTHS - HALF; idx++) {
  let sum = 0.5 * revenue[idx - HALF] + 0.5 * revenue[idx + HALF];
  for (let k = idx - HALF + 1; k <= idx + HALF - 1; k++) sum += revenue[k];
  trendRaw[idx] = sum / PERIOD;
}

const seasonalSums = new Array(PERIOD).fill(0);
const seasonalCounts = new Array(PERIOD).fill(0);
for (let idx = 0; idx < NUM_MONTHS; idx++) {
  if (trendRaw[idx] !== null) {
    const m = idx % PERIOD;
    seasonalSums[m] += revenue[idx] - trendRaw[idx];
    seasonalCounts[m] += 1;
  }
}
const seasonalRaw = seasonalSums.map((s, m) => s / seasonalCounts[m]);
const seasonalMean = seasonalRaw.reduce((a, b) => a + b, 0) / PERIOD;
const seasonalIndex = seasonalRaw.map((s) => s - seasonalMean);

const trendData = trendRaw.map((v) => (v === null ? null : Math.round(v)));
const seasonalData = dateLabels.map((_, idx) => Math.round(seasonalIndex[idx % PERIOD]));
const residualData = revenue.map((v, idx) =>
  trendRaw[idx] === null ? null : Math.round(v - trendRaw[idx] - seasonalIndex[idx % PERIOD])
);

// --- Storytelling annotations: peak season + largest residual outlier --------
const seasonalPeakIdx = seasonalData.indexOf(Math.max(...seasonalData));
let residualPeakIdx = 0;
let residualPeakAbs = -Infinity;
residualData.forEach((v, idx) => {
  if (v !== null && Math.abs(v) > residualPeakAbs) {
    residualPeakAbs = Math.abs(v);
    residualPeakIdx = idx;
  }
});

// --- Init ---------------------------------------------------------------------
const chart = echarts.init(document.getElementById("container"));

// --- Shared axis/grid styling --------------------------------------------------
const dollarFormatter = (v) => (v < 0 ? "-$" : "$") + Math.abs(v).toLocaleString("en-US");

const makeXAxis = (gridIndex, showLabels) => ({
  type: "category",
  gridIndex,
  data: dateLabels,
  boundaryGap: false,
  axisLine: { show: showLabels, lineStyle: { color: t.inkSoft } },
  axisTick: { show: false },
  axisLabel: {
    show: showLabels,
    color: t.inkSoft,
    fontSize: 14,
    formatter: (value) => (value.endsWith("-01") ? value.slice(0, 4) : ""),
  },
  splitLine: { show: true, lineStyle: { color: t.grid } },
});

const makeYAxis = (gridIndex, name) => ({
  type: "value",
  gridIndex,
  scale: true,
  name,
  nameLocation: "middle",
  nameGap: 46,
  nameRotate: 90,
  nameTextStyle: { color: t.inkSoft, fontSize: 13 },
  axisLine: { show: true, lineStyle: { color: t.inkSoft } },
  axisTick: { show: false },
  axisLabel: { color: t.inkSoft, fontSize: 14, formatter: dollarFormatter },
  splitLine: { show: true, lineStyle: { color: t.grid } },
});

const makePanelLabel = (top, text) => ({
  text,
  left: 116,
  top,
  textStyle: { color: t.ink, fontSize: 16, fontWeight: 600 },
});

// --- Option ---------------------------------------------------------------------
chart.setOption({
  animation: false,
  color: t.palette,
  backgroundColor: "transparent",
  tooltip: { trigger: "axis" },
  axisPointer: { link: [{ xAxisIndex: "all" }] },
  title: [
    {
      text: "timeseries-decomposition · javascript · echarts · anyplot.ai",
      left: "center",
      top: 20,
      textStyle: { color: t.ink, fontSize: 22 },
    },
    makePanelLabel(70, "Original"),
    makePanelLabel(274, "Trend"),
    makePanelLabel(478, "Seasonal"),
    makePanelLabel(682, "Residual"),
  ],
  grid: [
    { left: 116, right: 50, top: 94, height: 160 },
    { left: 116, right: 50, top: 298, height: 160 },
    { left: 116, right: 50, top: 502, height: 160 },
    { left: 116, right: 50, top: 706, height: 160 },
  ],
  xAxis: [makeXAxis(0, false), makeXAxis(1, false), makeXAxis(2, false), makeXAxis(3, true)],
  yAxis: [
    makeYAxis(0, "Revenue (USD)"),
    makeYAxis(1, "Revenue (USD)"),
    makeYAxis(2, "Deviation (USD)"),
    makeYAxis(3, "Residual (USD)"),
  ],
  series: [
    {
      name: "Original",
      type: "line",
      xAxisIndex: 0,
      yAxisIndex: 0,
      data: revenue,
      symbol: "none",
      lineStyle: { width: 3, color: t.palette[0] },
      itemStyle: { color: t.palette[0] },
    },
    {
      name: "Trend",
      type: "line",
      xAxisIndex: 1,
      yAxisIndex: 1,
      data: trendData,
      connectNulls: false,
      symbol: "none",
      lineStyle: { width: 3, color: t.palette[1] },
      itemStyle: { color: t.palette[1] },
    },
    {
      name: "Seasonal",
      type: "line",
      xAxisIndex: 2,
      yAxisIndex: 2,
      data: seasonalData,
      symbol: "none",
      lineStyle: { width: 3, color: t.palette[2] },
      itemStyle: { color: t.palette[2] },
      markPoint: {
        symbolSize: 10,
        itemStyle: { color: t.palette[2], borderColor: t.pageBg, borderWidth: 2 },
        label: { show: true, position: "top", color: t.ink, fontSize: 12, fontWeight: 600, formatter: "Peak season" },
        data: [{ coord: [dateLabels[seasonalPeakIdx], seasonalData[seasonalPeakIdx]] }],
      },
    },
    {
      name: "Residual",
      type: "line",
      xAxisIndex: 3,
      yAxisIndex: 3,
      data: residualData,
      connectNulls: false,
      symbol: "none",
      lineStyle: { width: 2, color: t.palette[3] },
      itemStyle: { color: t.palette[3] },
      markLine: {
        symbol: "none",
        silent: true,
        label: { show: false },
        lineStyle: { color: t.ink, type: "dashed", width: 1 },
        data: [{ yAxis: 0 }],
      },
      markPoint: {
        symbolSize: 10,
        itemStyle: { color: t.palette[3], borderColor: t.pageBg, borderWidth: 2 },
        label: {
          show: true,
          position: "top",
          color: t.ink,
          fontSize: 12,
          fontWeight: 600,
          formatter: "Largest outlier",
        },
        data: [{ coord: [dateLabels[residualPeakIdx], residualData[residualPeakIdx]] }],
      },
    },
  ],
});
Runnable source as JSON, for any HTTP client: https://api.anyplot.ai/specs/timeseries-decomposition/echarts/code. Any spec id and library id listed in llms-full.txt fit the same URL shape; every URL below is complete and callable.
{
  "spec_id": "timeseries-decomposition",
  "language": "javascript",
  "library": "echarts",
  "page": "https://anyplot.ai/timeseries-decomposition/javascript/echarts",
  "hub": "https://anyplot.ai/timeseries-decomposition",
  "code_json": "https://api.anyplot.ai/specs/timeseries-decomposition/echarts/code",
  "spec_json": "https://api.anyplot.ai/specs/timeseries-decomposition",
  "render_light_png": "https://storage.googleapis.com/anyplot-images/plots/timeseries-decomposition/javascript/echarts/plot-light.png",
  "render_dark_png": "https://storage.googleapis.com/anyplot-images/plots/timeseries-decomposition/javascript/echarts/plot-dark.png",
  "interactive_light_html": "https://storage.googleapis.com/anyplot-images/plots/timeseries-decomposition/javascript/echarts/plot-light.html",
  "interactive_dark_html": "https://storage.googleapis.com/anyplot-images/plots/timeseries-decomposition/javascript/echarts/plot-dark.html",
  "quality_score": 91.0,
  "license": "MIT",
  "guide": "https://anyplot.ai/llms.txt"
}
Part of Time Series Decomposition Plot on anyplot.ai.