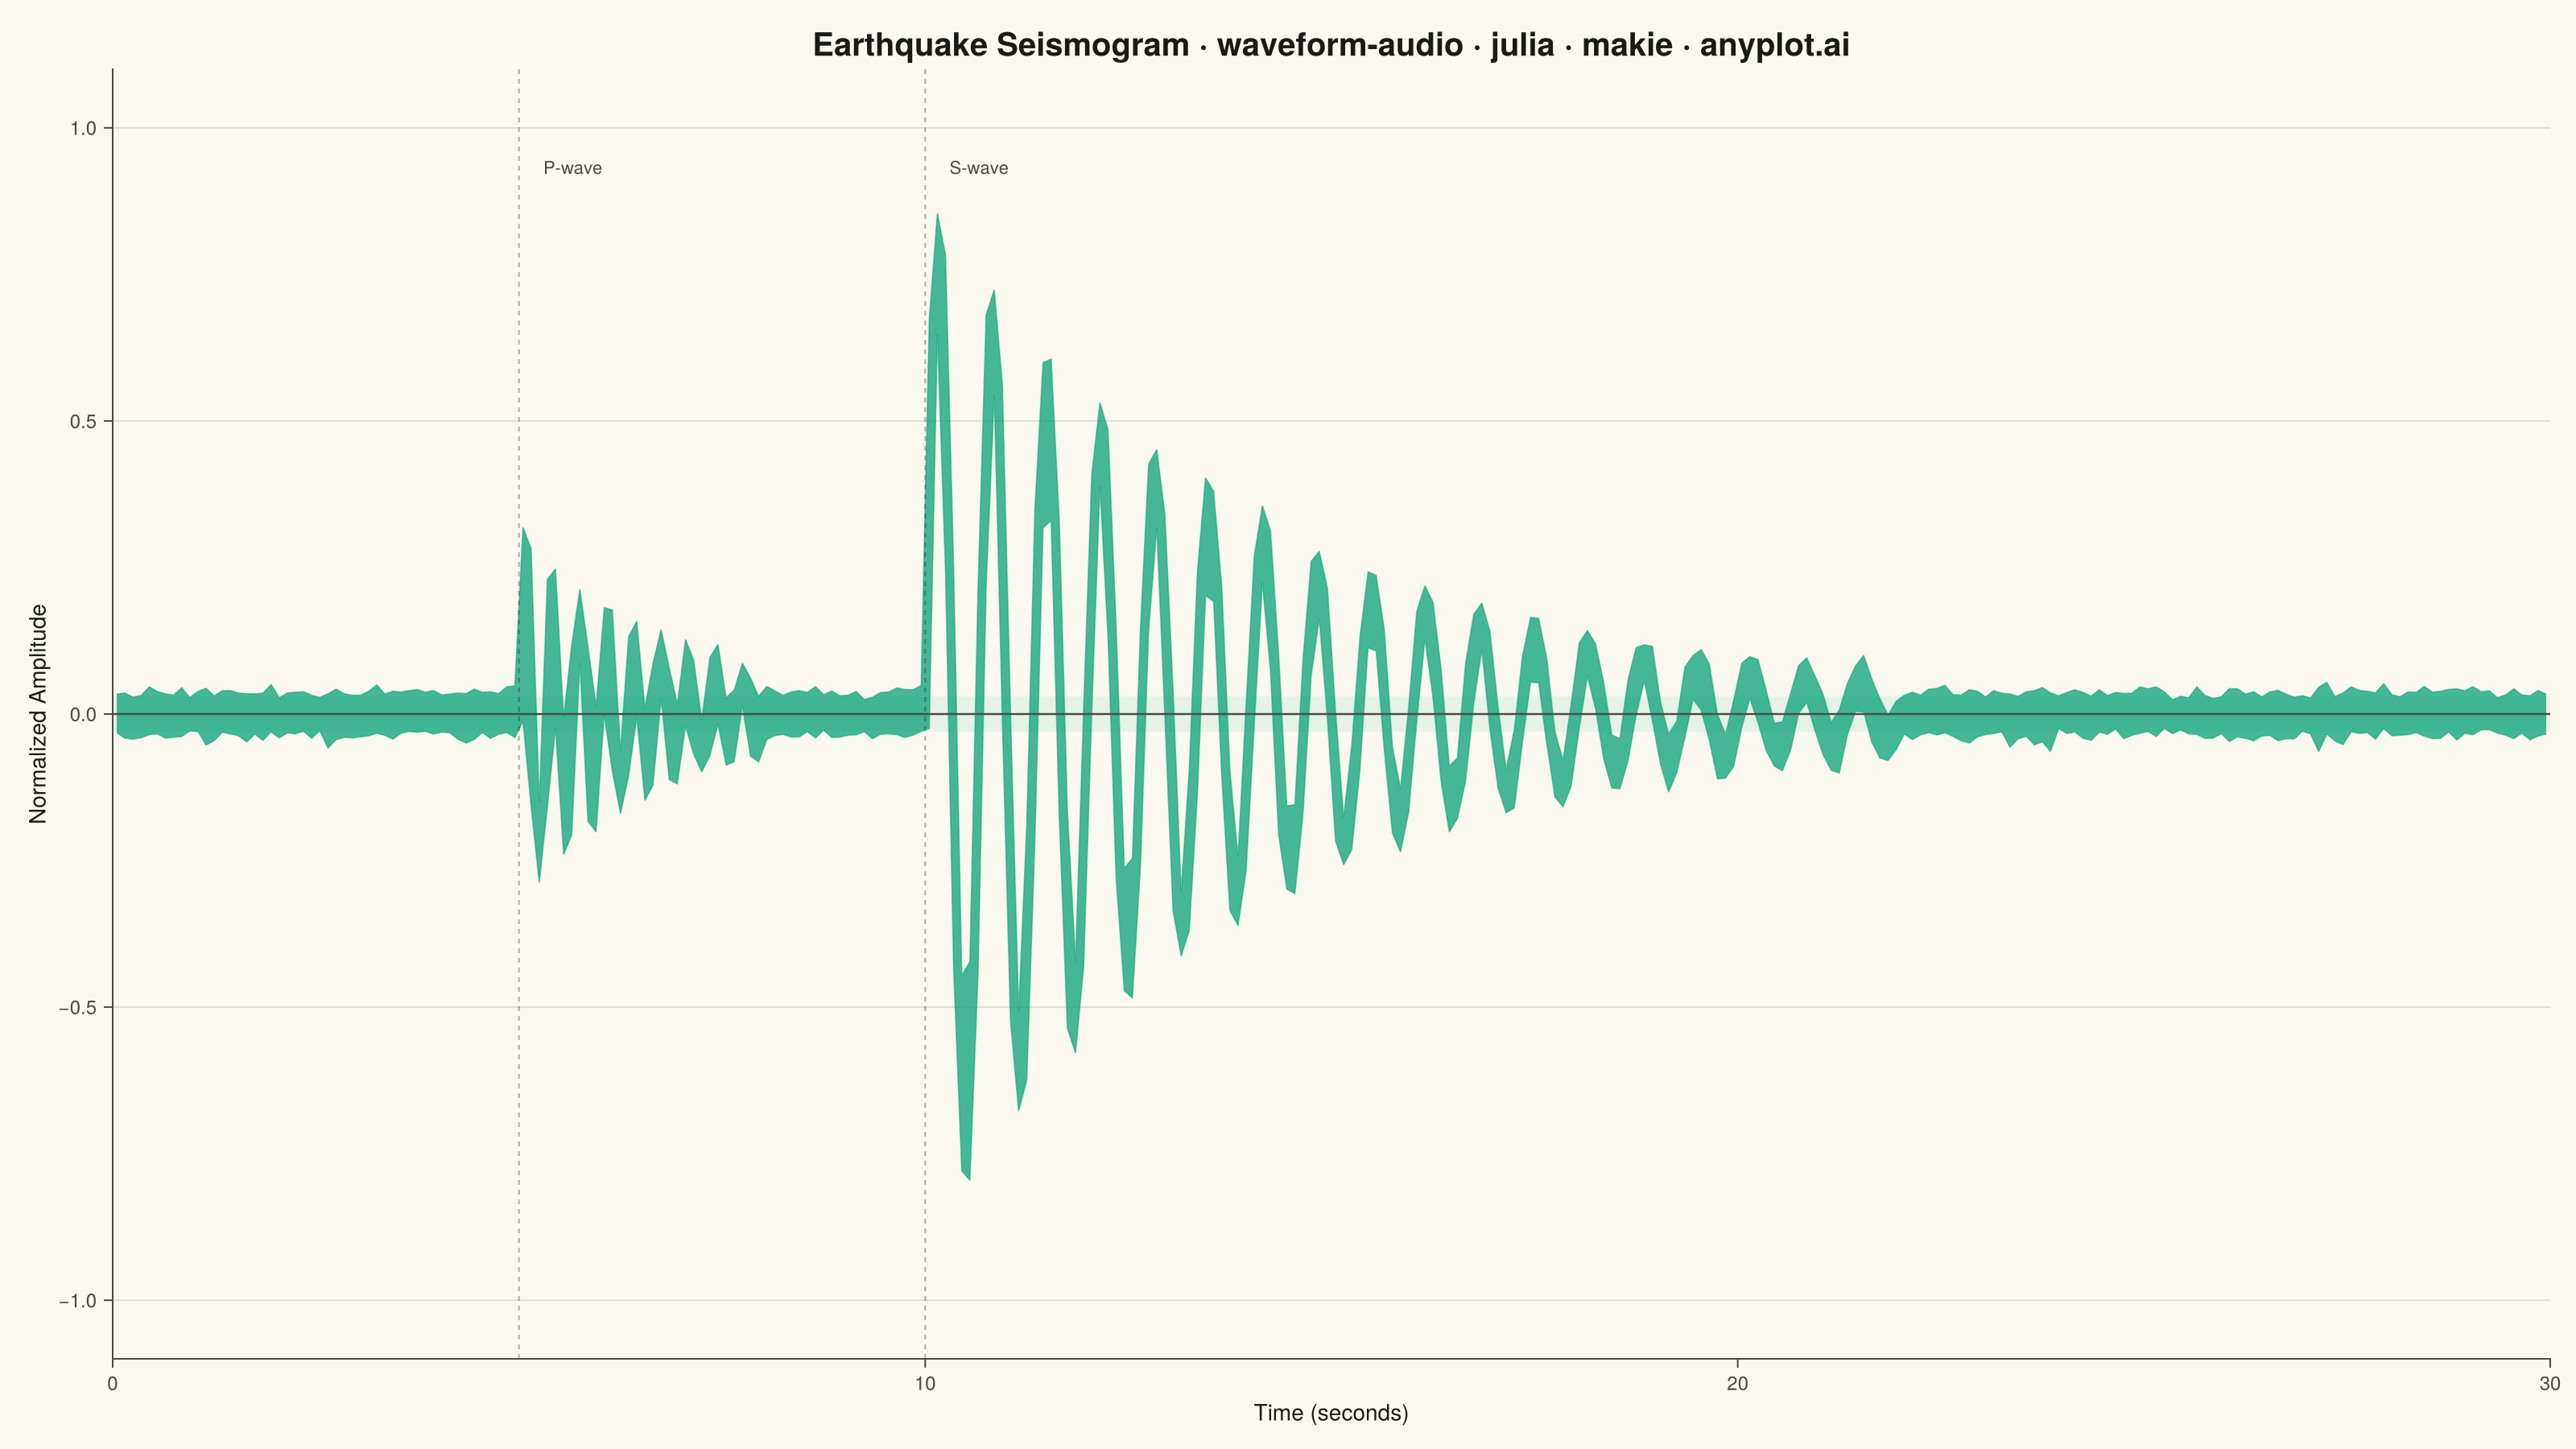
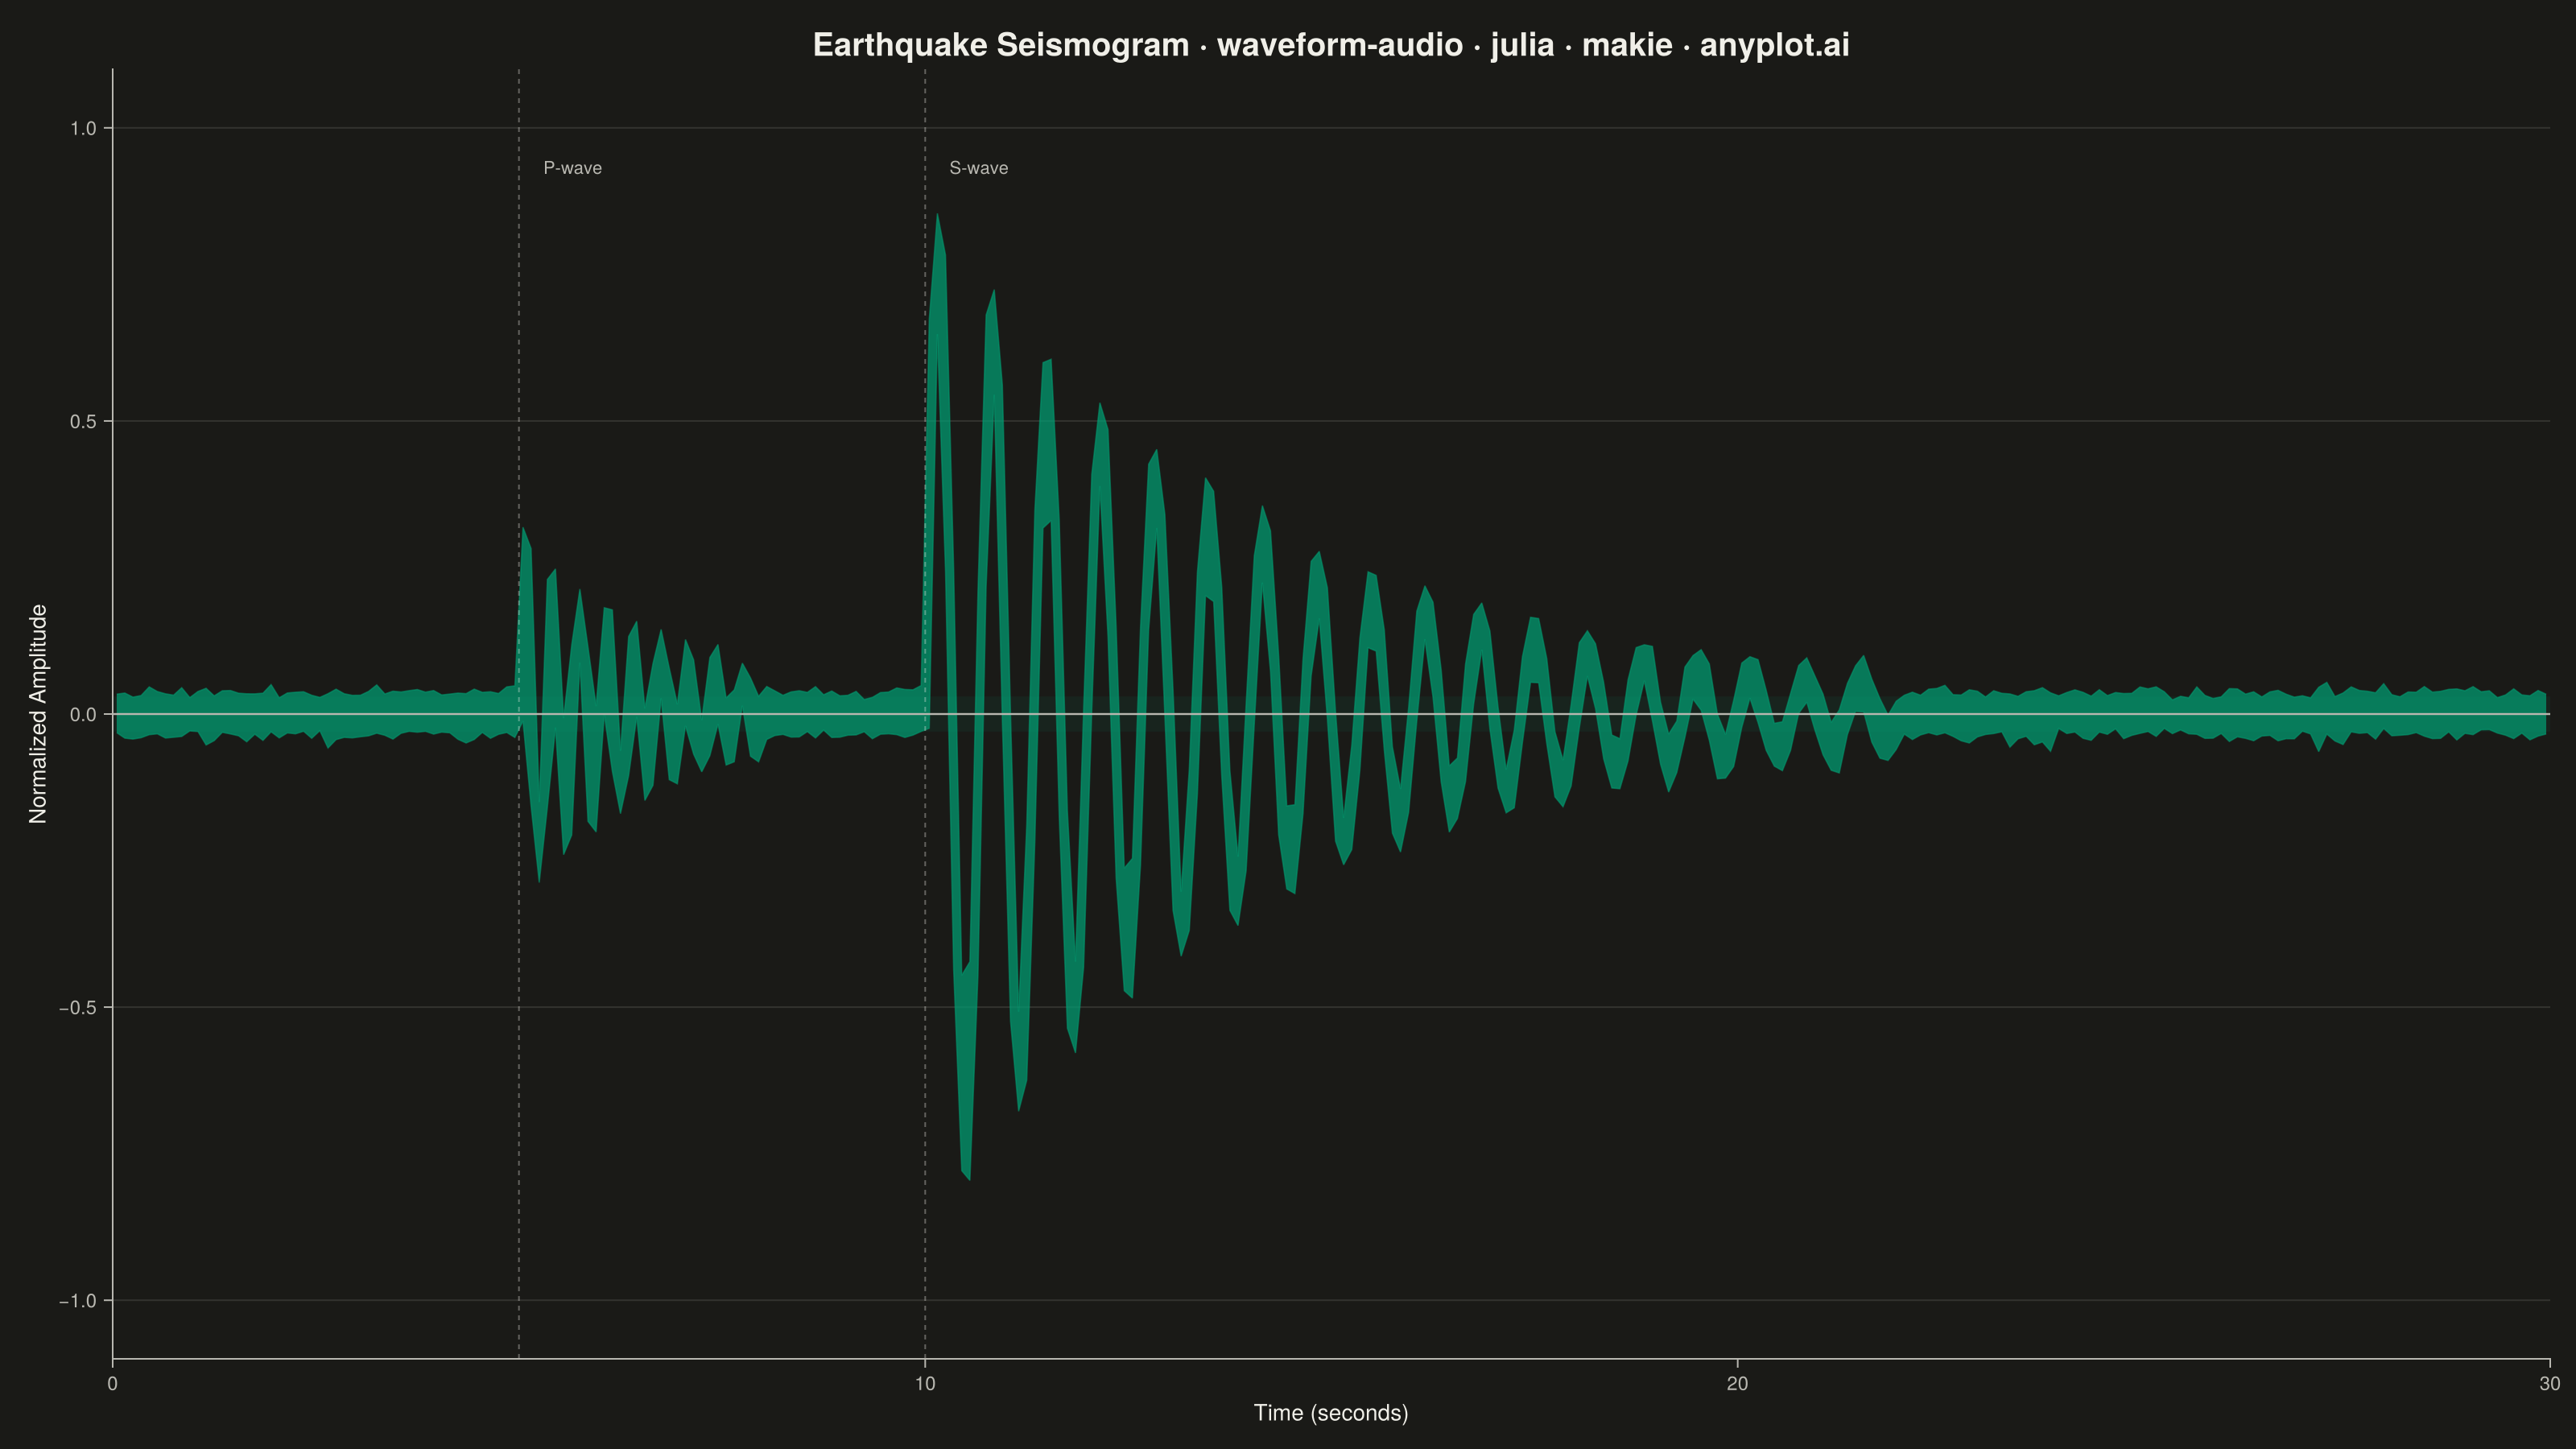
A time-domain visualization of audio amplitude that displays the raw waveform shape as seen in digital audio workstations (DAWs). The plot shows positive and negative amplitude symmetrically around a zero baseline, with time on the x-axis and normalized amplitude (-1 to +1) on the y-axis. This is the fundamental representation for inspecting audio signals, revealing dynamics, clipping, silence, and transient characteristics at a glance.
Preview render from the Makie.jl implementation.