The same plot in 14 other libraries — JavaScript: D3.js, Apache ECharts, Highcharts, MUI X Charts; Python: Altair, Bokeh, lets-plot, Matplotlib, Plotly, plotnine, Pygal, Seaborn; R: ggplot2; Julia: Makie.jl. Compare all 15 side by side: Audio Waveform Plot in Python, R, Julia and JavaScript.
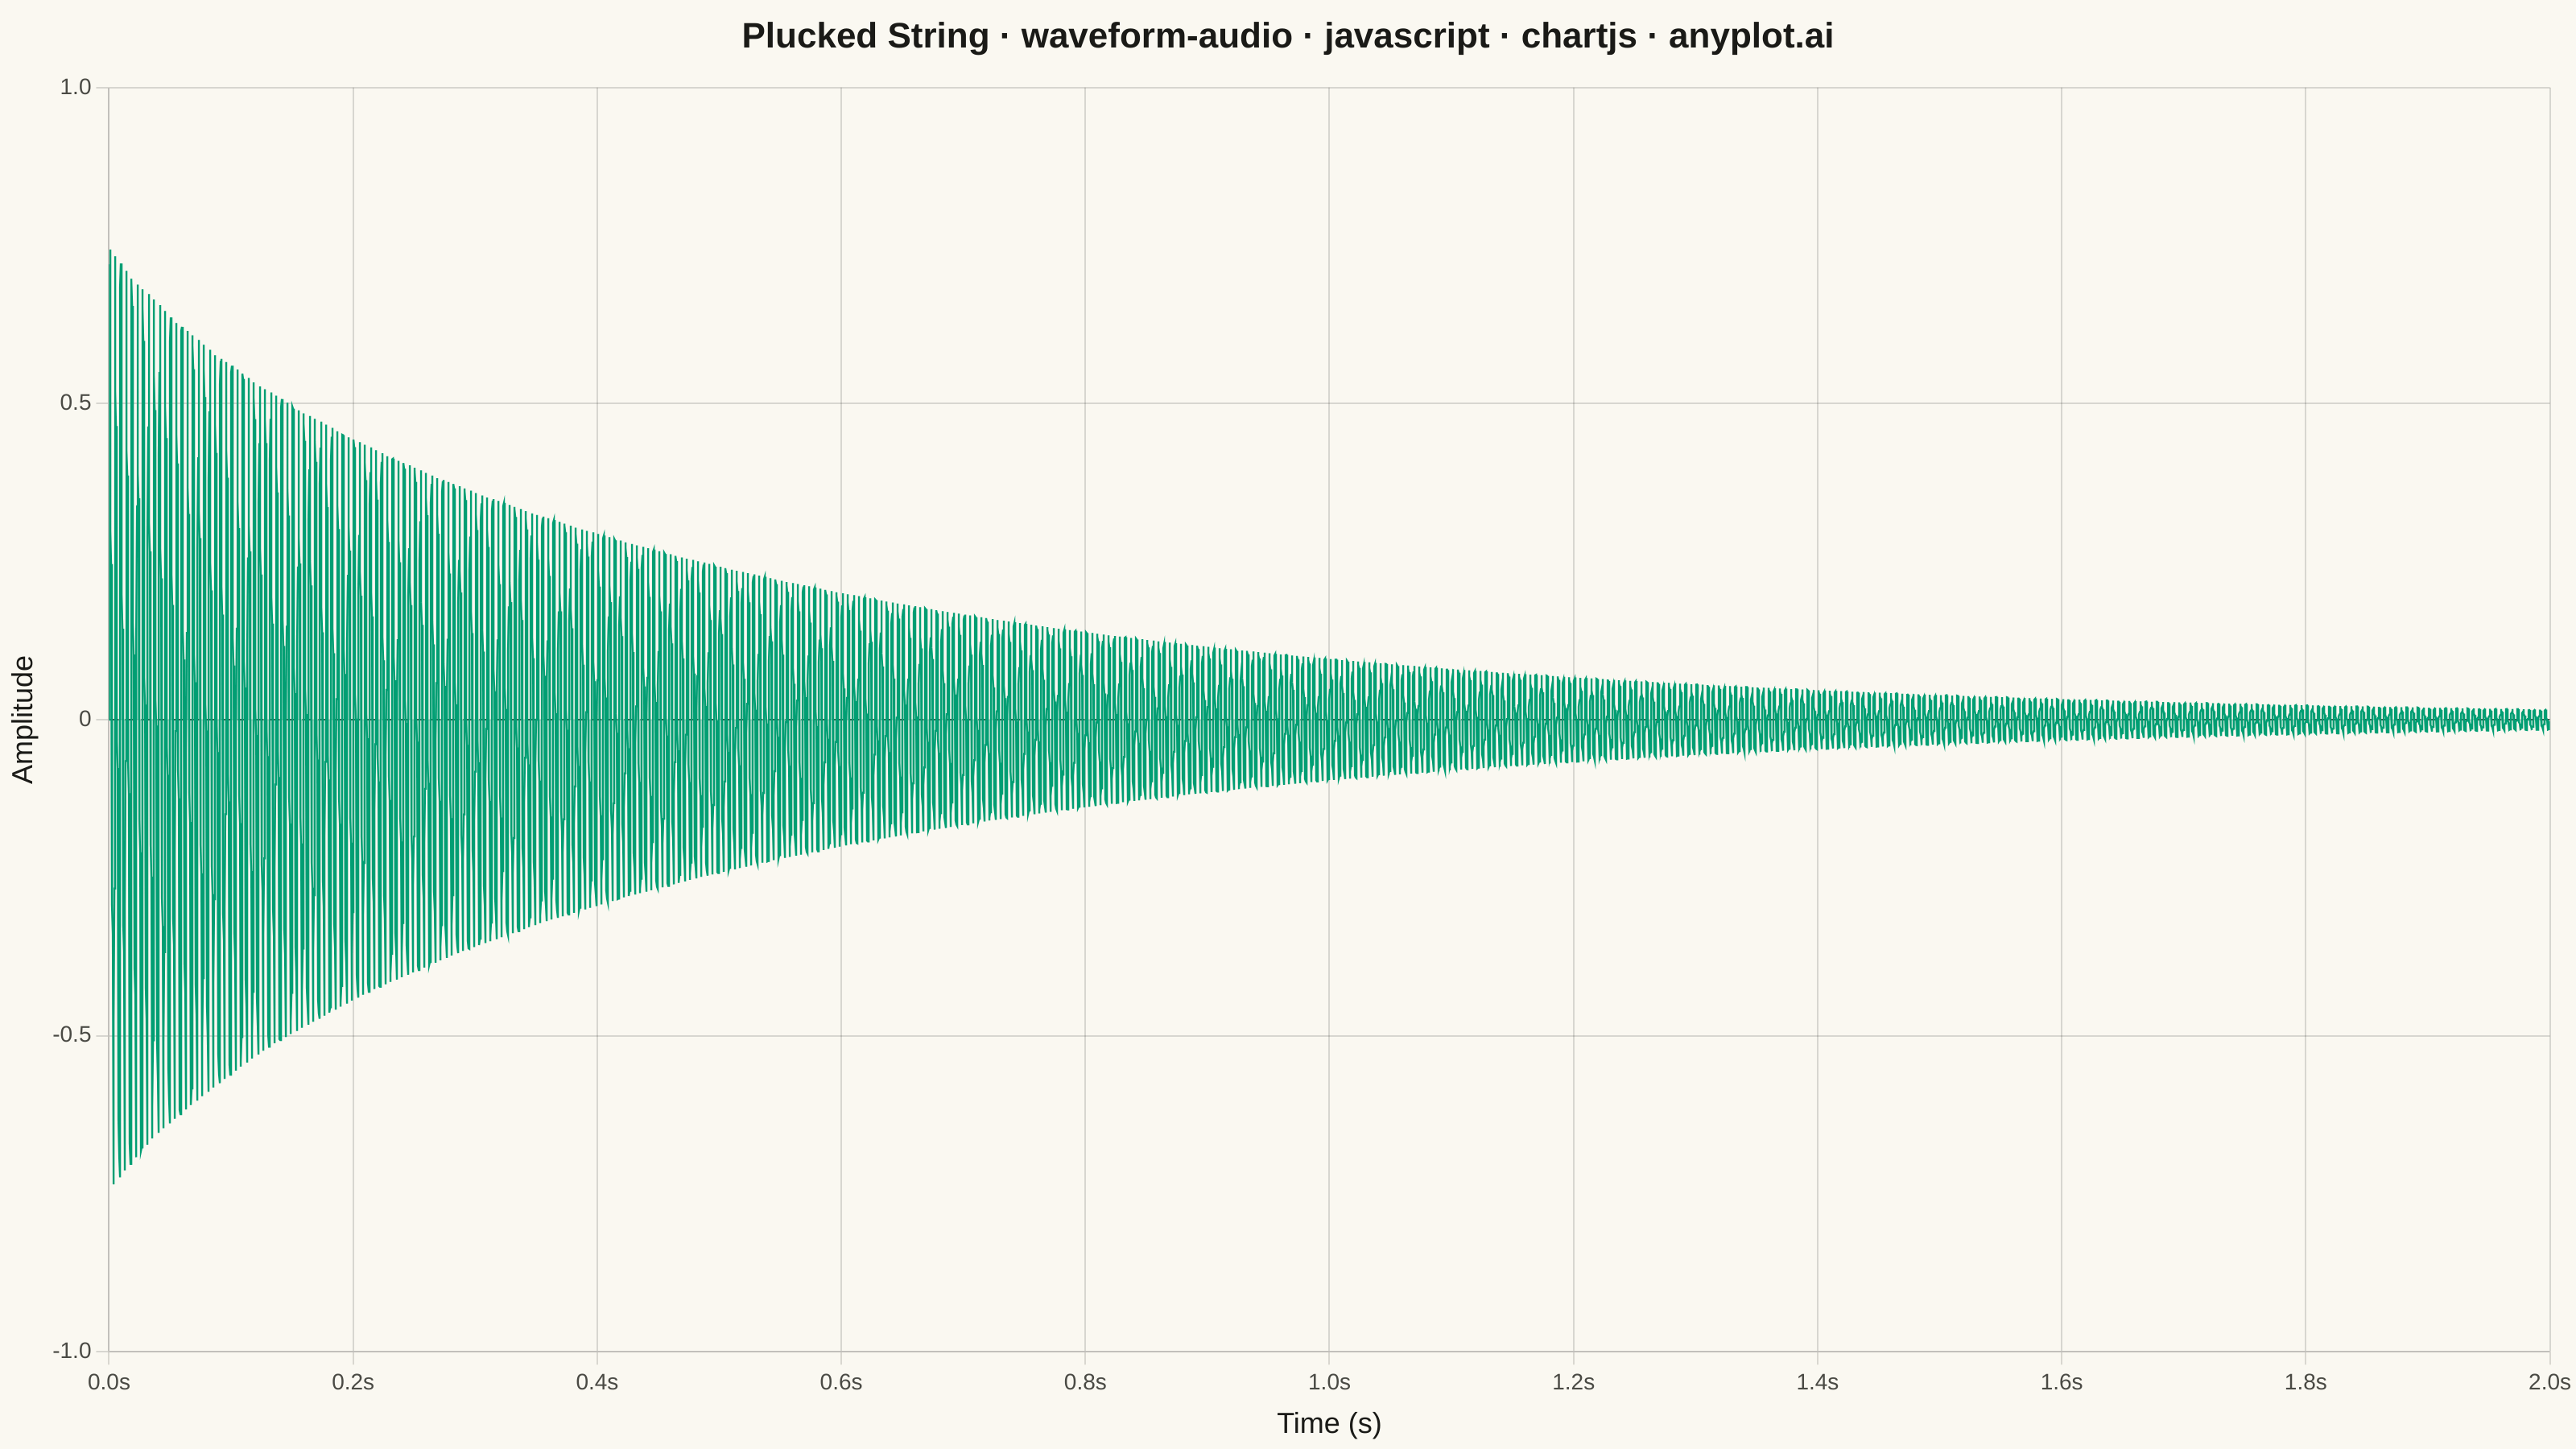
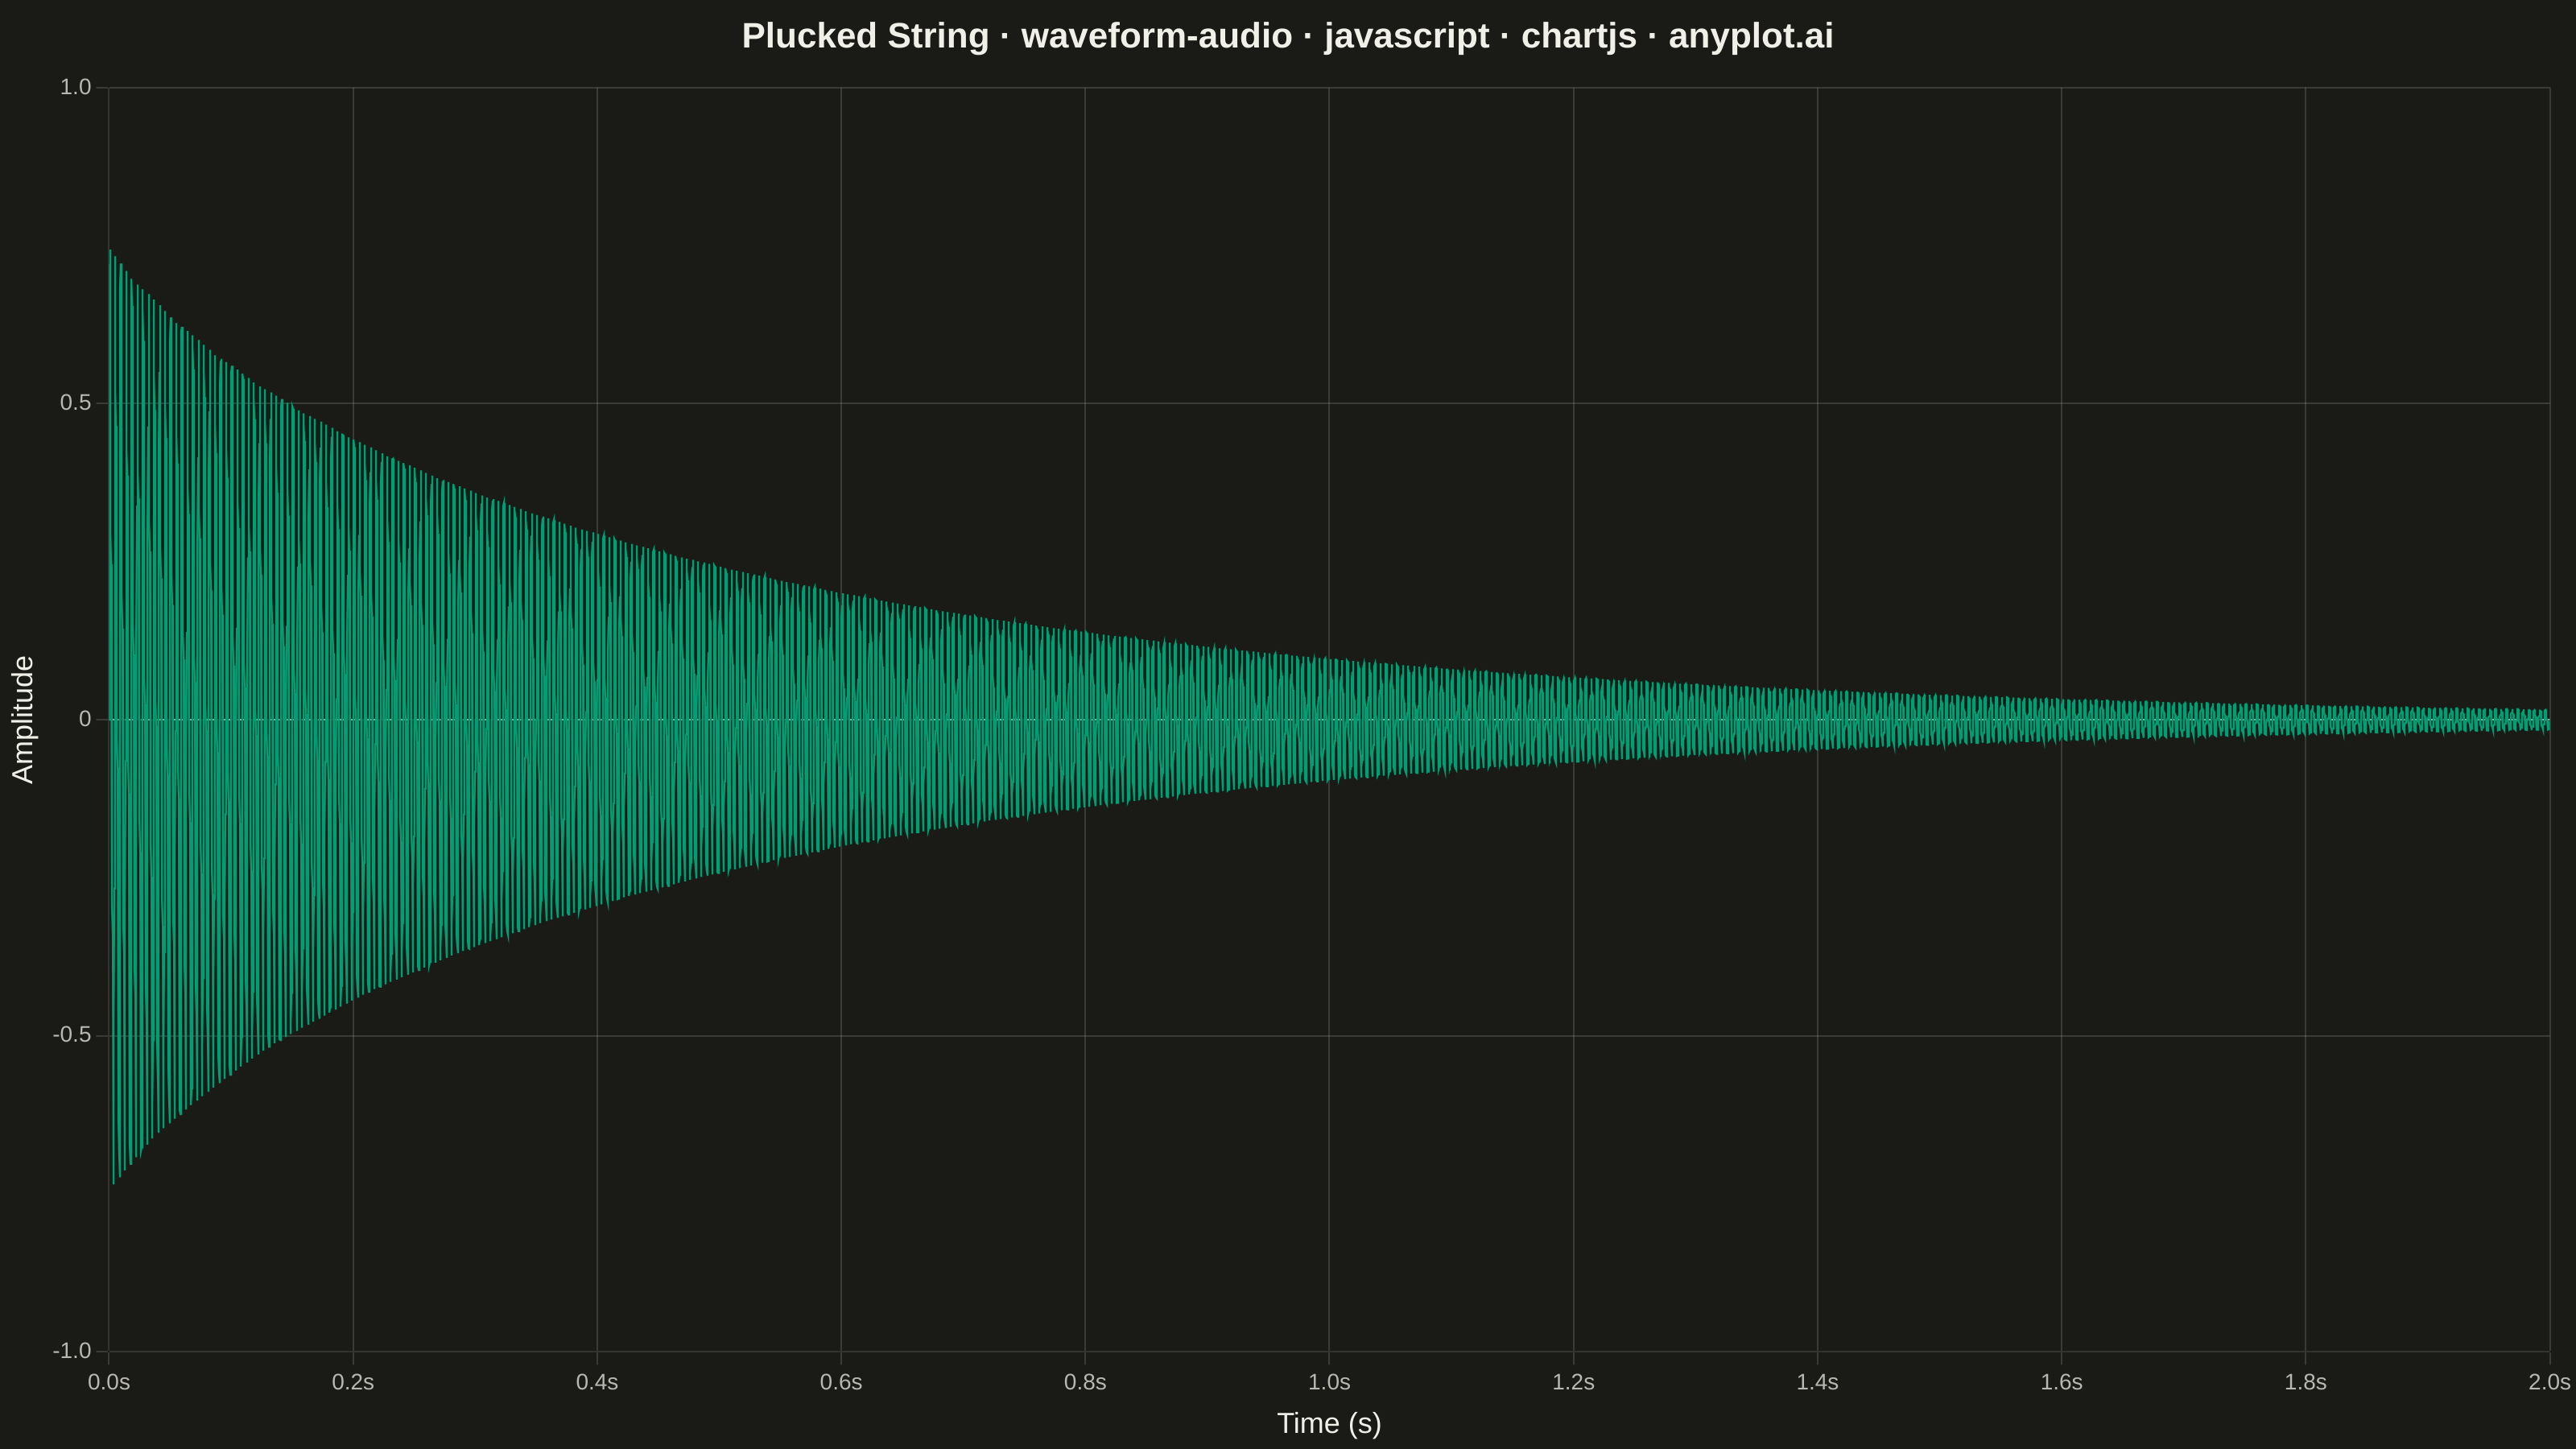
A time-domain visualization of audio amplitude that displays the raw waveform shape as seen in digital audio workstations (DAWs). The plot shows positive and negative amplitude symmetrically around a zero baseline, with time on the x-axis and normalized amplitude (-1 to +1) on the y-axis. This is the fundamental representation for inspecting audio signals, revealing dynamics, clipping, silence, and transient characteristics at a glance.
// anyplot.ai
// waveform-audio: Audio Waveform Plot
// Library: chartjs 4.4.7 | JavaScript 22.22.3
// Quality: 92/100 | Created: 2026-06-03
//# anyplot-orientation: landscape

const t = window.ANYPLOT_TOKENS;

// --- Data (deterministic in-memory) ------------------------------------------
// Plucked-string model: overlapping harmonics with frequency-proportional decay
const sampleRate = 8820;
const duration = 2.0;
const f0 = 220; // A3 note — 220 cycles over 2 s gives a dense DAW-style view
const totalSamples = sampleRate * duration;
const waveData = new Array(totalSamples);

for (let i = 0; i < totalSamples; i++) {
    const s = i / sampleRate;
    const y =
        0.58 * Math.exp(-s * 1.8) * Math.sin(2 * Math.PI * f0 * s) +
        0.25 * Math.exp(-s * 4.0) * Math.sin(2 * Math.PI * f0 * 2 * s) +
        0.12 * Math.exp(-s * 7.5) * Math.sin(2 * Math.PI * f0 * 3 * s) +
        0.05 * Math.exp(-s * 13.0) * Math.sin(2 * Math.PI * f0 * 4 * s);
    waveData[i] = { x: s, y };
}

const zeroLine = [{ x: 0, y: 0 }, { x: duration, y: 0 }];

// --- Mount -------------------------------------------------------------------
document.getElementById("container").style.backgroundColor = t.pageBg;
const canvas = document.createElement("canvas");
document.getElementById("container").appendChild(canvas);

// --- Chart -------------------------------------------------------------------
const chartTitle = "Plucked String · waveform-audio · javascript · chartjs · anyplot.ai";

// Decompose palette[0] (#009E73) into rgba for semi-transparent fill
const hex = t.palette[0];
const rgb = [
    parseInt(hex.slice(1, 3), 16),
    parseInt(hex.slice(3, 5), 16),
    parseInt(hex.slice(5, 7), 16),
].join(", ");

new Chart(canvas, {
    type: "line",
    data: {
        datasets: [
            {
                label: "Amplitude",
                data: waveData,
                parsing: false,
                normalized: true,
                borderColor: t.palette[0],
                backgroundColor: `rgba(${rgb}, 0.3)`,
                borderWidth: 1.2,
                pointRadius: 0,
                fill: "origin",
                tension: 0,
            },
            {
                label: "Zero",
                data: zeroLine,
                parsing: false,
                borderColor: t.inkSoft,
                borderDash: [6, 4],
                borderWidth: 1,
                pointRadius: 0,
                fill: false,
                tension: 0,
            },
        ],
    },
    options: {
        responsive: true,
        maintainAspectRatio: false,
        animation: false,
        plugins: {
            title: {
                display: true,
                text: chartTitle,
                color: t.ink,
                font: { size: 22, weight: "600" },
                padding: { top: 10, bottom: 18 },
            },
            legend: { display: false },
        },
        scales: {
            x: {
                type: "linear",
                min: 0,
                max: duration,
                title: {
                    display: true,
                    text: "Time (s)",
                    color: t.ink,
                    font: { size: 18 },
                },
                ticks: {
                    color: t.inkSoft,
                    font: { size: 14 },
                    callback: (v) => `${v.toFixed(1)}s`,
                },
                grid: { color: t.grid },
            },
            y: {
                min: -1.0,
                max: 1.0,
                title: {
                    display: true,
                    text: "Amplitude",
                    color: t.ink,
                    font: { size: 18 },
                },
                ticks: {
                    color: t.inkSoft,
                    font: { size: 14 },
                    stepSize: 0.5,
                },
                grid: { color: t.grid },
            },
        },
    },
});
Runnable source as JSON, for any HTTP client: https://api.anyplot.ai/specs/waveform-audio/chartjs/code. Any spec id and library id listed in llms-full.txt fit the same URL shape; every URL below is complete and callable.
{
  "spec_id": "waveform-audio",
  "language": "javascript",
  "library": "chartjs",
  "page": "https://anyplot.ai/waveform-audio/javascript/chartjs",
  "hub": "https://anyplot.ai/waveform-audio",
  "code_json": "https://api.anyplot.ai/specs/waveform-audio/chartjs/code",
  "spec_json": "https://api.anyplot.ai/specs/waveform-audio",
  "render_light_png": "https://storage.googleapis.com/anyplot-images/plots/waveform-audio/javascript/chartjs/plot-light.png",
  "render_dark_png": "https://storage.googleapis.com/anyplot-images/plots/waveform-audio/javascript/chartjs/plot-dark.png",
  "interactive_light_html": "https://storage.googleapis.com/anyplot-images/plots/waveform-audio/javascript/chartjs/plot-light.html",
  "interactive_dark_html": "https://storage.googleapis.com/anyplot-images/plots/waveform-audio/javascript/chartjs/plot-dark.html",
  "quality_score": 92.0,
  "license": "MIT",
  "guide": "https://anyplot.ai/llms.txt"
}
Part of Audio Waveform Plot on anyplot.ai.