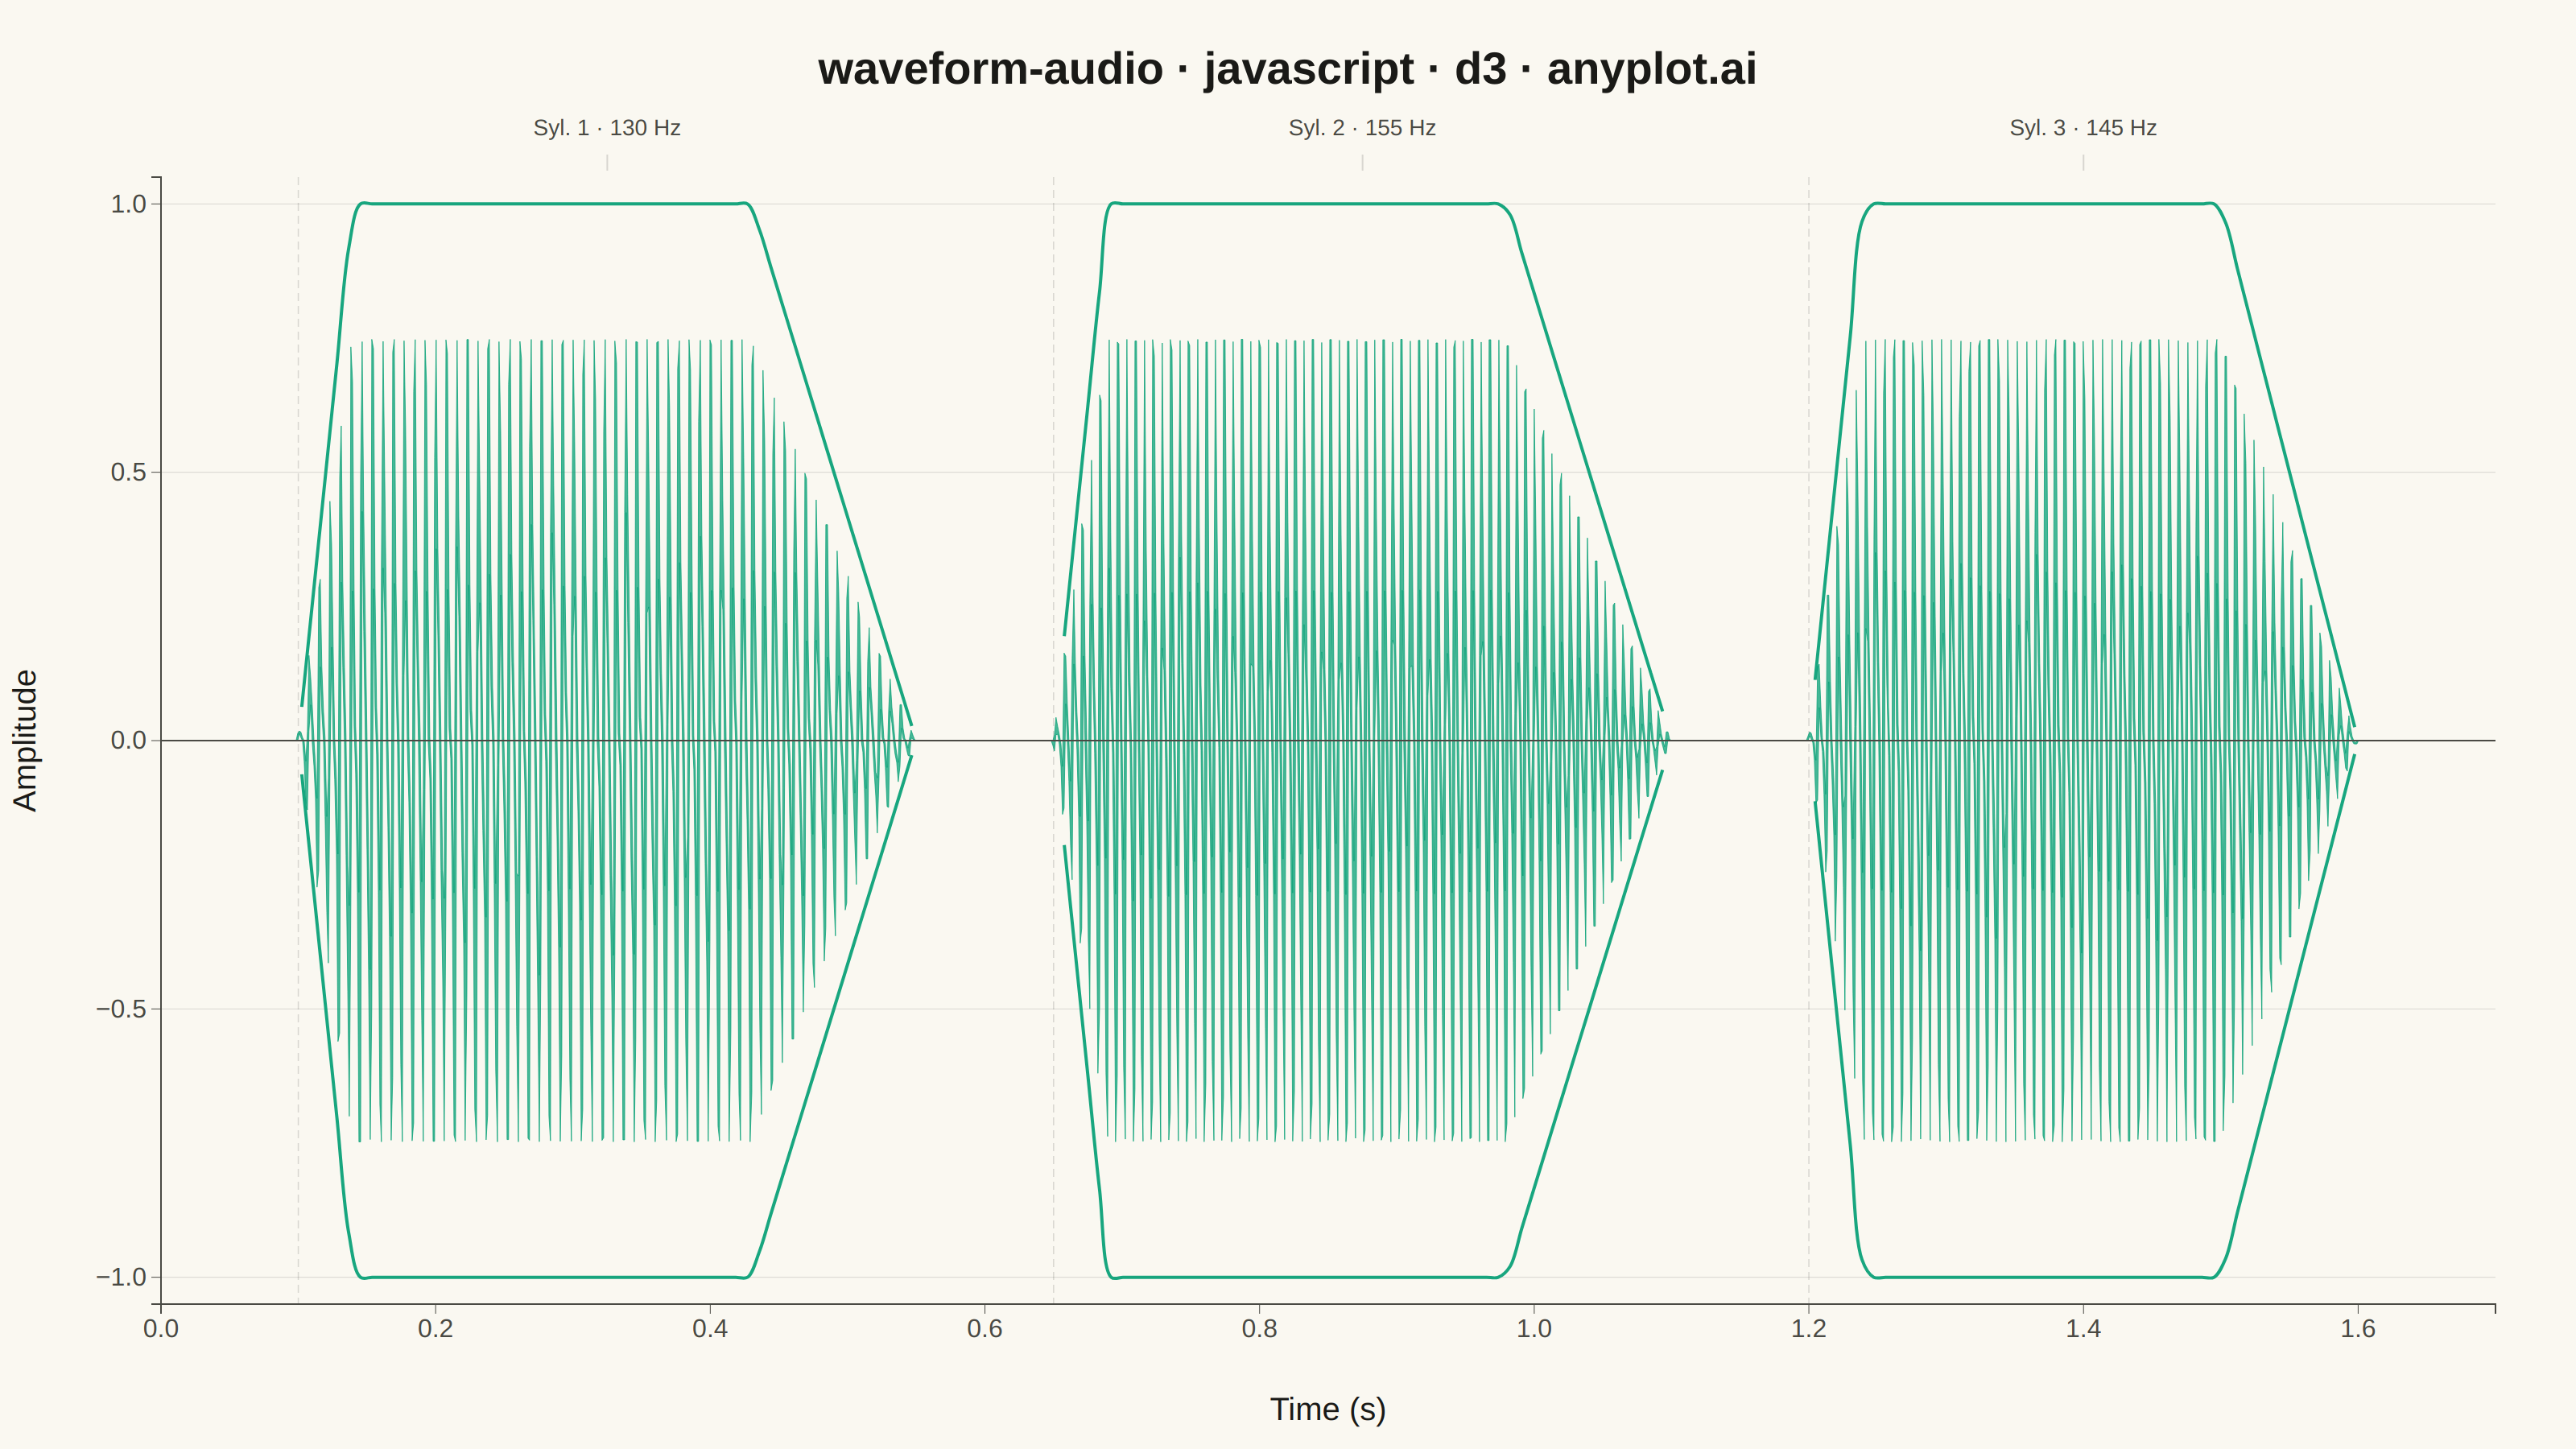
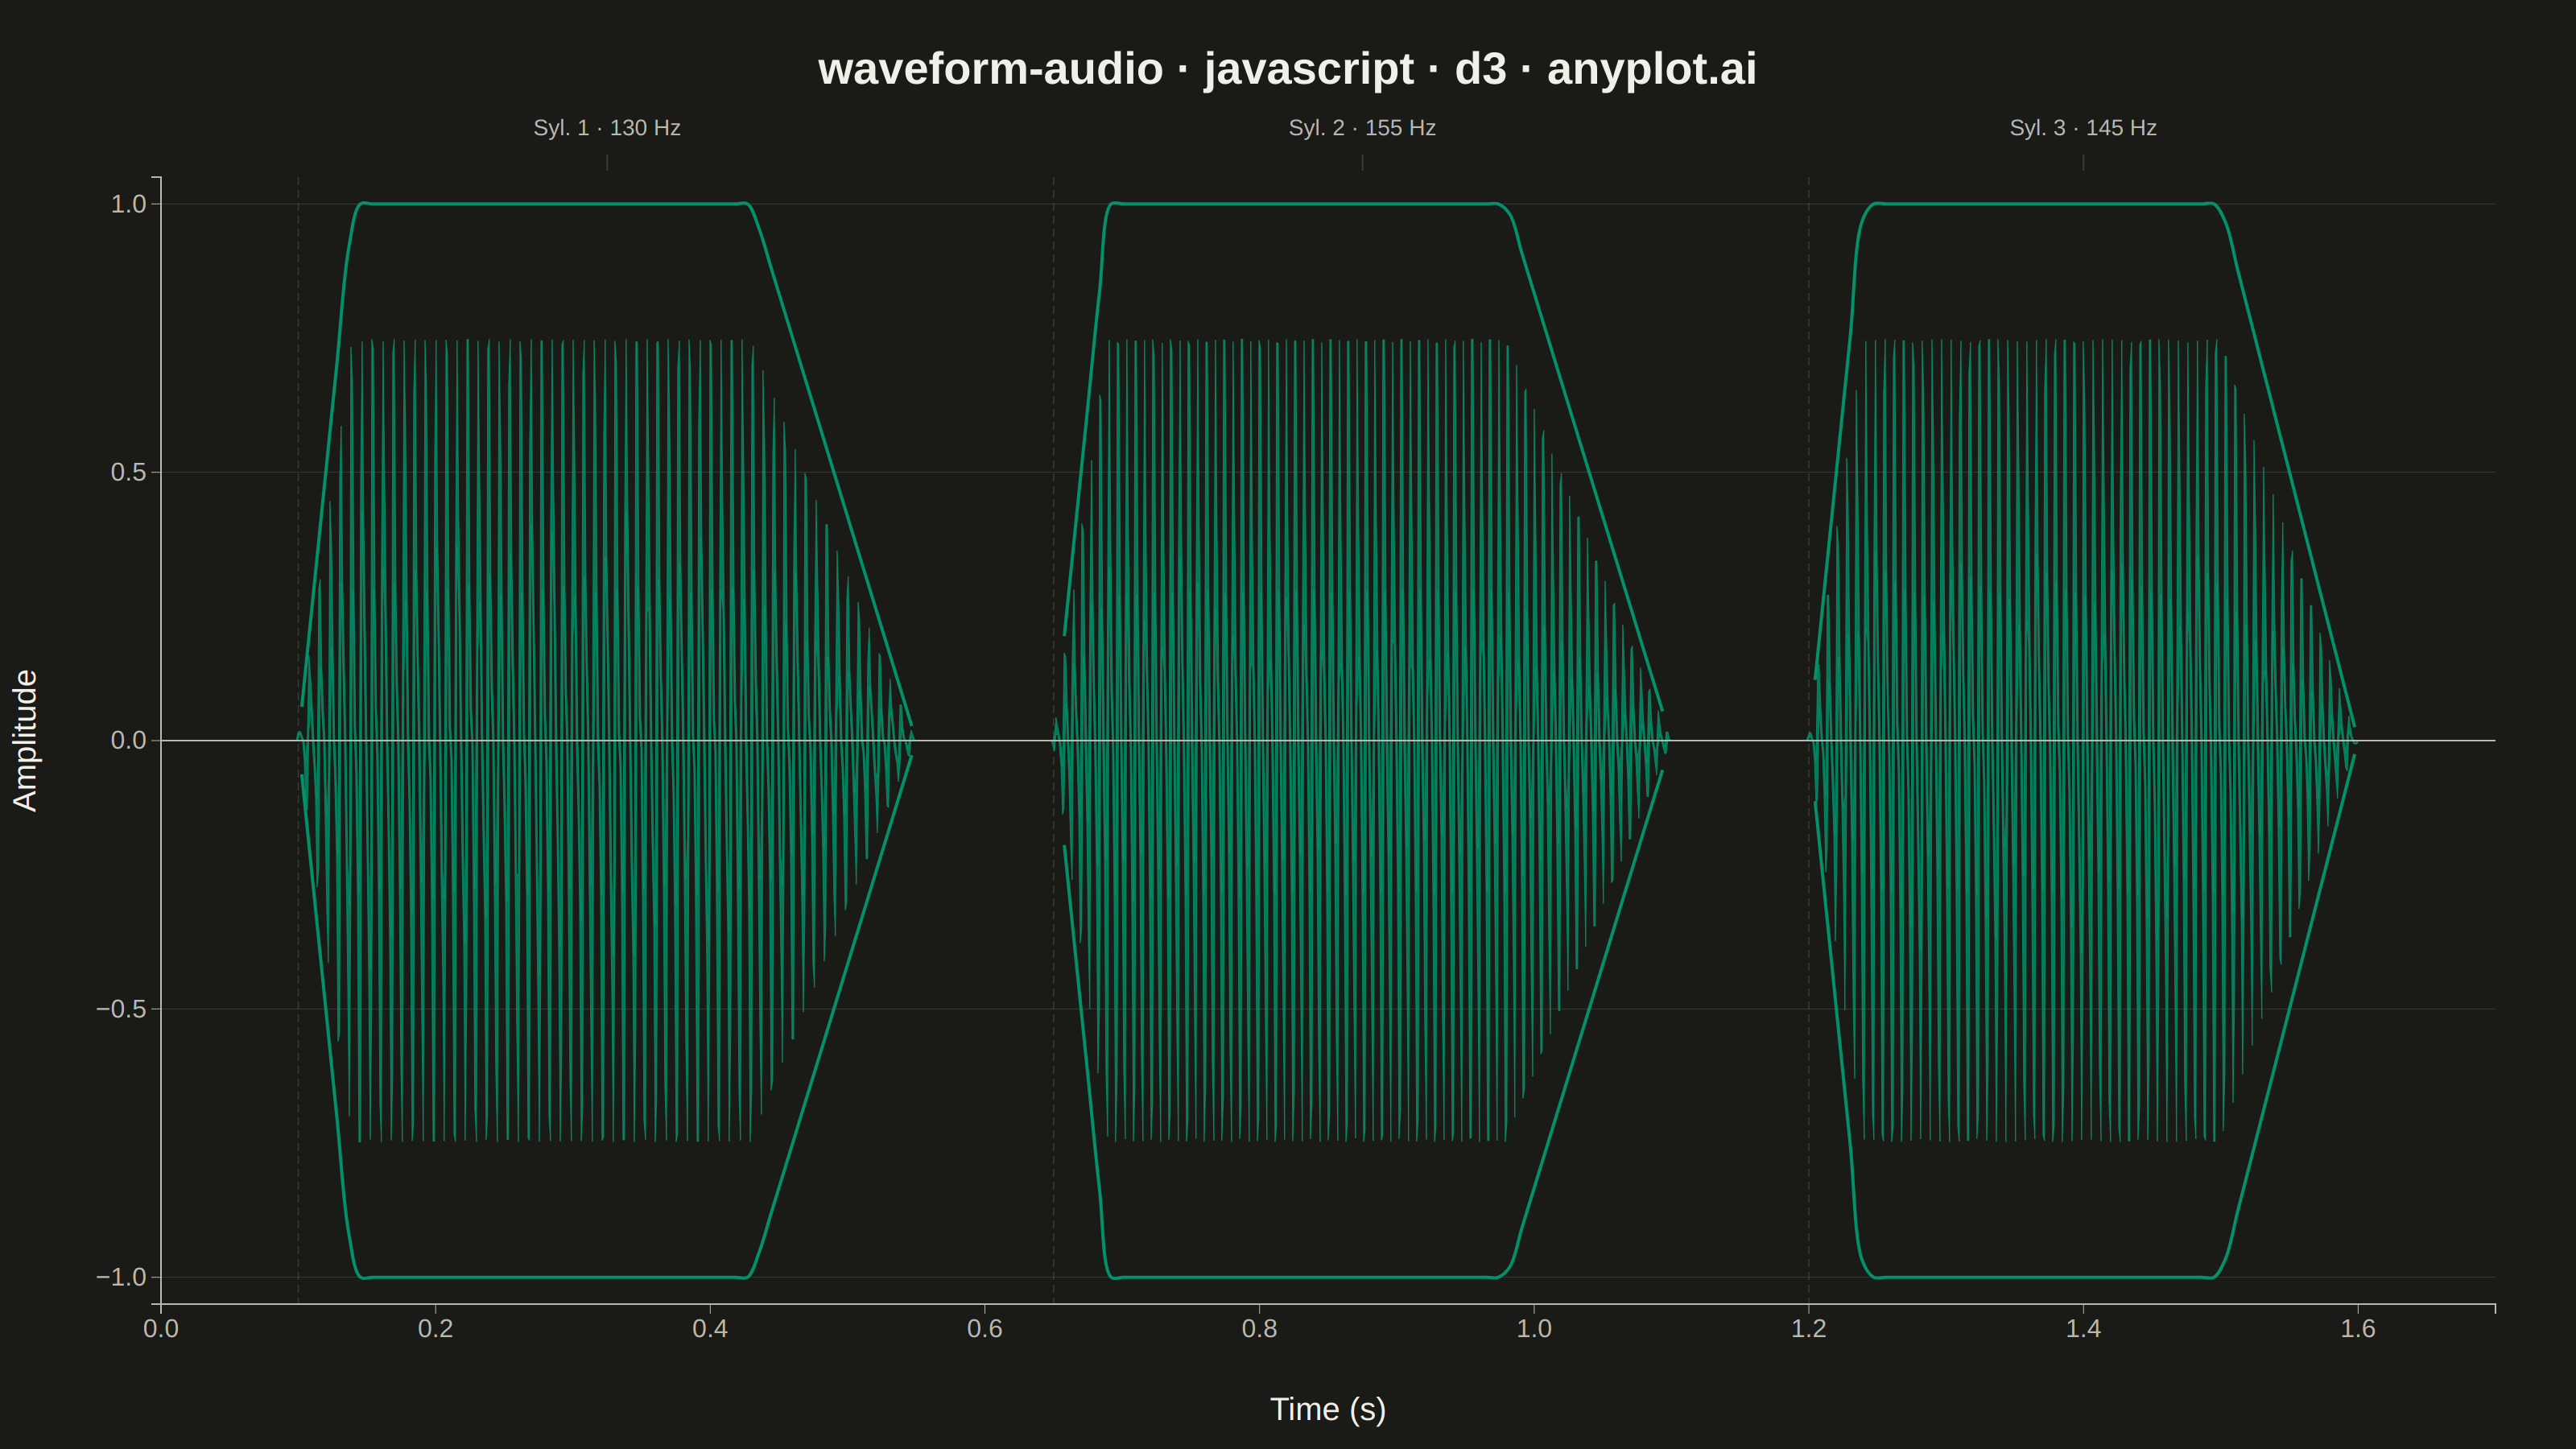
The same plot in 14 other libraries — JavaScript: Chart.js, Apache ECharts, Highcharts, MUI X Charts; Python: Altair, Bokeh, lets-plot, Matplotlib, Plotly, plotnine, Pygal, Seaborn; R: ggplot2; Julia: Makie.jl. Compare all 15 side by side: Audio Waveform Plot in Python, R, Julia and JavaScript.
A time-domain visualization of audio amplitude that displays the raw waveform shape as seen in digital audio workstations (DAWs). The plot shows positive and negative amplitude symmetrically around a zero baseline, with time on the x-axis and normalized amplitude (-1 to +1) on the y-axis. This is the fundamental representation for inspecting audio signals, revealing dynamics, clipping, silence, and transient characteristics at a glance.
// anyplot.ai
// waveform-audio: Audio Waveform Plot
// Library: d3 7.9.0 | JavaScript 22.22.3
// Quality: 88/100 | Created: 2026-06-03

const t = window.ANYPLOT_TOKENS;
const { width, height } = window.ANYPLOT_SIZE;
const margin = { top: 110, right: 50, bottom: 90, left: 100 };
const iw = width - margin.left - margin.right;
const ih = height - margin.top - margin.bottom;

const SR = 8000;
const DUR = 1.7;
const N = Math.ceil(SR * DUR);

const SYLS = [
  { start: 0.10, end: 0.55, f0: 130, atk: 0.04, rel: 0.12, label: 'Syl. 1' },
  { start: 0.65, end: 1.10, f0: 155, atk: 0.04, rel: 0.12, label: 'Syl. 2' },
  { start: 1.20, end: 1.60, f0: 145, atk: 0.04, rel: 0.10, label: 'Syl. 3' },
];

// 4-harmonic vocal synthesis with per-syllable trapezoidal amplitude envelope
const rawAmp = new Float32Array(N);
for (let i = 0; i < N; i++) {
  const time = i / SR;
  let s = 0;
  for (const syl of SYLS) {
    const tl = time - syl.start;
    const dur = syl.end - syl.start;
    if (tl < 0 || tl >= dur) continue;
    let env;
    if (tl < syl.atk) env = tl / syl.atk;
    else if (dur - tl < syl.rel) env = (dur - tl) / syl.rel;
    else env = 1;
    const tau = 2 * Math.PI * time;
    s += env * (
      0.45 * Math.sin(syl.f0 * tau) +
      0.28 * Math.sin(2 * syl.f0 * tau) +
      0.16 * Math.sin(3 * syl.f0 * tau) +
      0.11 * Math.sin(4 * syl.f0 * tau)
    );
  }
  rawAmp[i] = s;
}

// Downsample to display-width bins: min/max envelope per pixel column
const nBins = Math.round(iw);
const bSz = N / nBins;
const waveData = Array.from({ length: nBins }, (_, b) => {
  const s0 = Math.floor(b * bSz);
  const e0 = Math.min(Math.ceil((b + 1) * bSz), N);
  let lo = Infinity, hi = -Infinity;
  for (let j = s0; j < e0; j++) {
    if (rawAmp[j] < lo) lo = rawAmp[j];
    if (rawAmp[j] > hi) hi = rawAmp[j];
  }
  return { tPos: s0 / SR, lo, hi };
});

// Smooth amplitude envelope (200 pts) for overlay curves
const envCurve = Array.from({ length: 200 }, (_, i) => {
  const tv = i / 199 * DUR;
  let peak = 0;
  for (const syl of SYLS) {
    const tl = tv - syl.start;
    const dur = syl.end - syl.start;
    if (tl < 0 || tl >= dur) continue;
    let env;
    if (tl < syl.atk) env = tl / syl.atk;
    else if (dur - tl < syl.rel) env = (dur - tl) / syl.rel;
    else env = 1;
    peak = Math.max(peak, env);
  }
  return { t: tv, env: peak };
});

// --- SVG mount ---
const svg = d3.select("#container").append("svg")
  .attr("width", width).attr("height", height);
const g = svg.append("g").attr("transform", `translate(${margin.left},${margin.top})`);

// --- Scales ---
const xScale = d3.scaleLinear().domain([0, DUR]).range([0, iw]);
const yScale = d3.scaleLinear().domain([-1.05, 1.05]).range([ih, 0]);

// --- Horizontal gridlines ---
g.selectAll(".hg").data([-1, -0.5, 0, 0.5, 1]).join("line")
  .attr("class", "hg")
  .attr("x1", 0).attr("x2", iw)
  .attr("y1", d => yScale(d)).attr("y2", d => yScale(d))
  .attr("stroke", t.grid)
  .attr("stroke-width", 0.5);

// --- Syllable onset markers (dashed verticals at each syllable start) ---
g.selectAll(".sg").data(SYLS).join("line")
  .attr("class", "sg")
  .attr("x1", syl => xScale(syl.start)).attr("x2", syl => xScale(syl.start))
  .attr("y1", 0).attr("y2", ih)
  .attr("stroke", t.grid)
  .attr("stroke-width", 0.75)
  .attr("stroke-dasharray", "5,3");

// --- Waveform filled area (min/max envelope per pixel column) ---
g.append("path")
  .datum(waveData)
  .attr("d", d3.area()
    .x(d => xScale(d.tPos))
    .y0(d => yScale(d.lo))
    .y1(d => yScale(d.hi)))
  .attr("fill", t.palette[0])
  .attr("fill-opacity", 0.72)
  .attr("stroke", t.palette[0])
  .attr("stroke-width", 0.4)
  .attr("stroke-opacity", 0.9);

// --- Amplitude envelope overlay — positive and negative arms ---
for (const sign of [1, -1]) {
  g.append("path")
    .datum(envCurve)
    .attr("d", d3.line()
      .defined(d => d.env > 0.001)
      .x(d => xScale(d.t))
      .y(d => yScale(sign * d.env))
      .curve(d3.curveCatmullRom.alpha(0.5)))
    .attr("fill", "none")
    .attr("stroke", t.palette[0])
    .attr("stroke-width", 2)
    .attr("stroke-opacity", 0.9);
}

// --- Zero reference line ---
g.append("line")
  .attr("x1", 0).attr("x2", iw)
  .attr("y1", yScale(0)).attr("y2", yScale(0))
  .attr("stroke", t.inkSoft)
  .attr("stroke-width", 1);

// --- Axes ---
const xAxis = g.append("g")
  .attr("transform", `translate(0,${ih})`)
  .call(d3.axisBottom(xScale).ticks(9).tickFormat(d => d.toFixed(1)));
const yAxis = g.append("g")
  .call(d3.axisLeft(yScale).tickValues([-1, -0.5, 0, 0.5, 1]));
for (const ax of [xAxis, yAxis]) {
  ax.selectAll("text").attr("fill", t.inkSoft).style("font-size", "16px");
  ax.selectAll("line").attr("stroke", t.inkSoft).attr("stroke-width", 0.5);
  ax.select(".domain").attr("stroke", t.inkSoft);
}

// --- Syllable labels (mid-margin above chart, with small tick connectors) ---
g.selectAll(".syl-lbl").data(SYLS).join("text")
  .attr("class", "syl-lbl")
  .attr("x", syl => xScale((syl.start + syl.end) / 2))
  .attr("y", -26)
  .attr("text-anchor", "middle")
  .attr("fill", t.inkSoft)
  .style("font-size", "14px")
  .text(syl => `${syl.label} · ${syl.f0} Hz`);
g.selectAll(".syl-tick").data(SYLS).join("line")
  .attr("class", "syl-tick")
  .attr("x1", syl => xScale((syl.start + syl.end) / 2))
  .attr("x2", syl => xScale((syl.start + syl.end) / 2))
  .attr("y1", -14).attr("y2", -4)
  .attr("stroke", t.grid)
  .attr("stroke-width", 1);

// --- Axis labels ---
svg.append("text")
  .attr("x", margin.left + iw / 2)
  .attr("y", height - 18)
  .attr("text-anchor", "middle")
  .attr("fill", t.ink)
  .style("font-size", "20px")
  .text("Time (s)");
svg.append("text")
  .attr("transform", `translate(22, ${margin.top + ih / 2}) rotate(-90)`)
  .attr("text-anchor", "middle")
  .attr("fill", t.ink)
  .style("font-size", "20px")
  .text("Amplitude");

// --- Title ---
svg.append("text")
  .attr("x", width / 2).attr("y", 52)
  .attr("text-anchor", "middle")
  .attr("fill", t.ink)
  .style("font-size", "28px")
  .style("font-weight", "600")
  .text("waveform-audio · javascript · d3 · anyplot.ai");
Runnable source as JSON, for any HTTP client: https://api.anyplot.ai/specs/waveform-audio/d3/code. Any spec id and library id listed in llms-full.txt fit the same URL shape; every URL below is complete and callable.
{
  "spec_id": "waveform-audio",
  "language": "javascript",
  "library": "d3",
  "page": "https://anyplot.ai/waveform-audio/javascript/d3",
  "hub": "https://anyplot.ai/waveform-audio",
  "code_json": "https://api.anyplot.ai/specs/waveform-audio/d3/code",
  "spec_json": "https://api.anyplot.ai/specs/waveform-audio",
  "render_light_png": "https://storage.googleapis.com/anyplot-images/plots/waveform-audio/javascript/d3/plot-light.png",
  "render_dark_png": "https://storage.googleapis.com/anyplot-images/plots/waveform-audio/javascript/d3/plot-dark.png",
  "interactive_light_html": "https://storage.googleapis.com/anyplot-images/plots/waveform-audio/javascript/d3/plot-light.html",
  "interactive_dark_html": "https://storage.googleapis.com/anyplot-images/plots/waveform-audio/javascript/d3/plot-dark.html",
  "quality_score": 88.0,
  "license": "MIT",
  "guide": "https://anyplot.ai/llms.txt"
}
Part of Audio Waveform Plot on anyplot.ai.