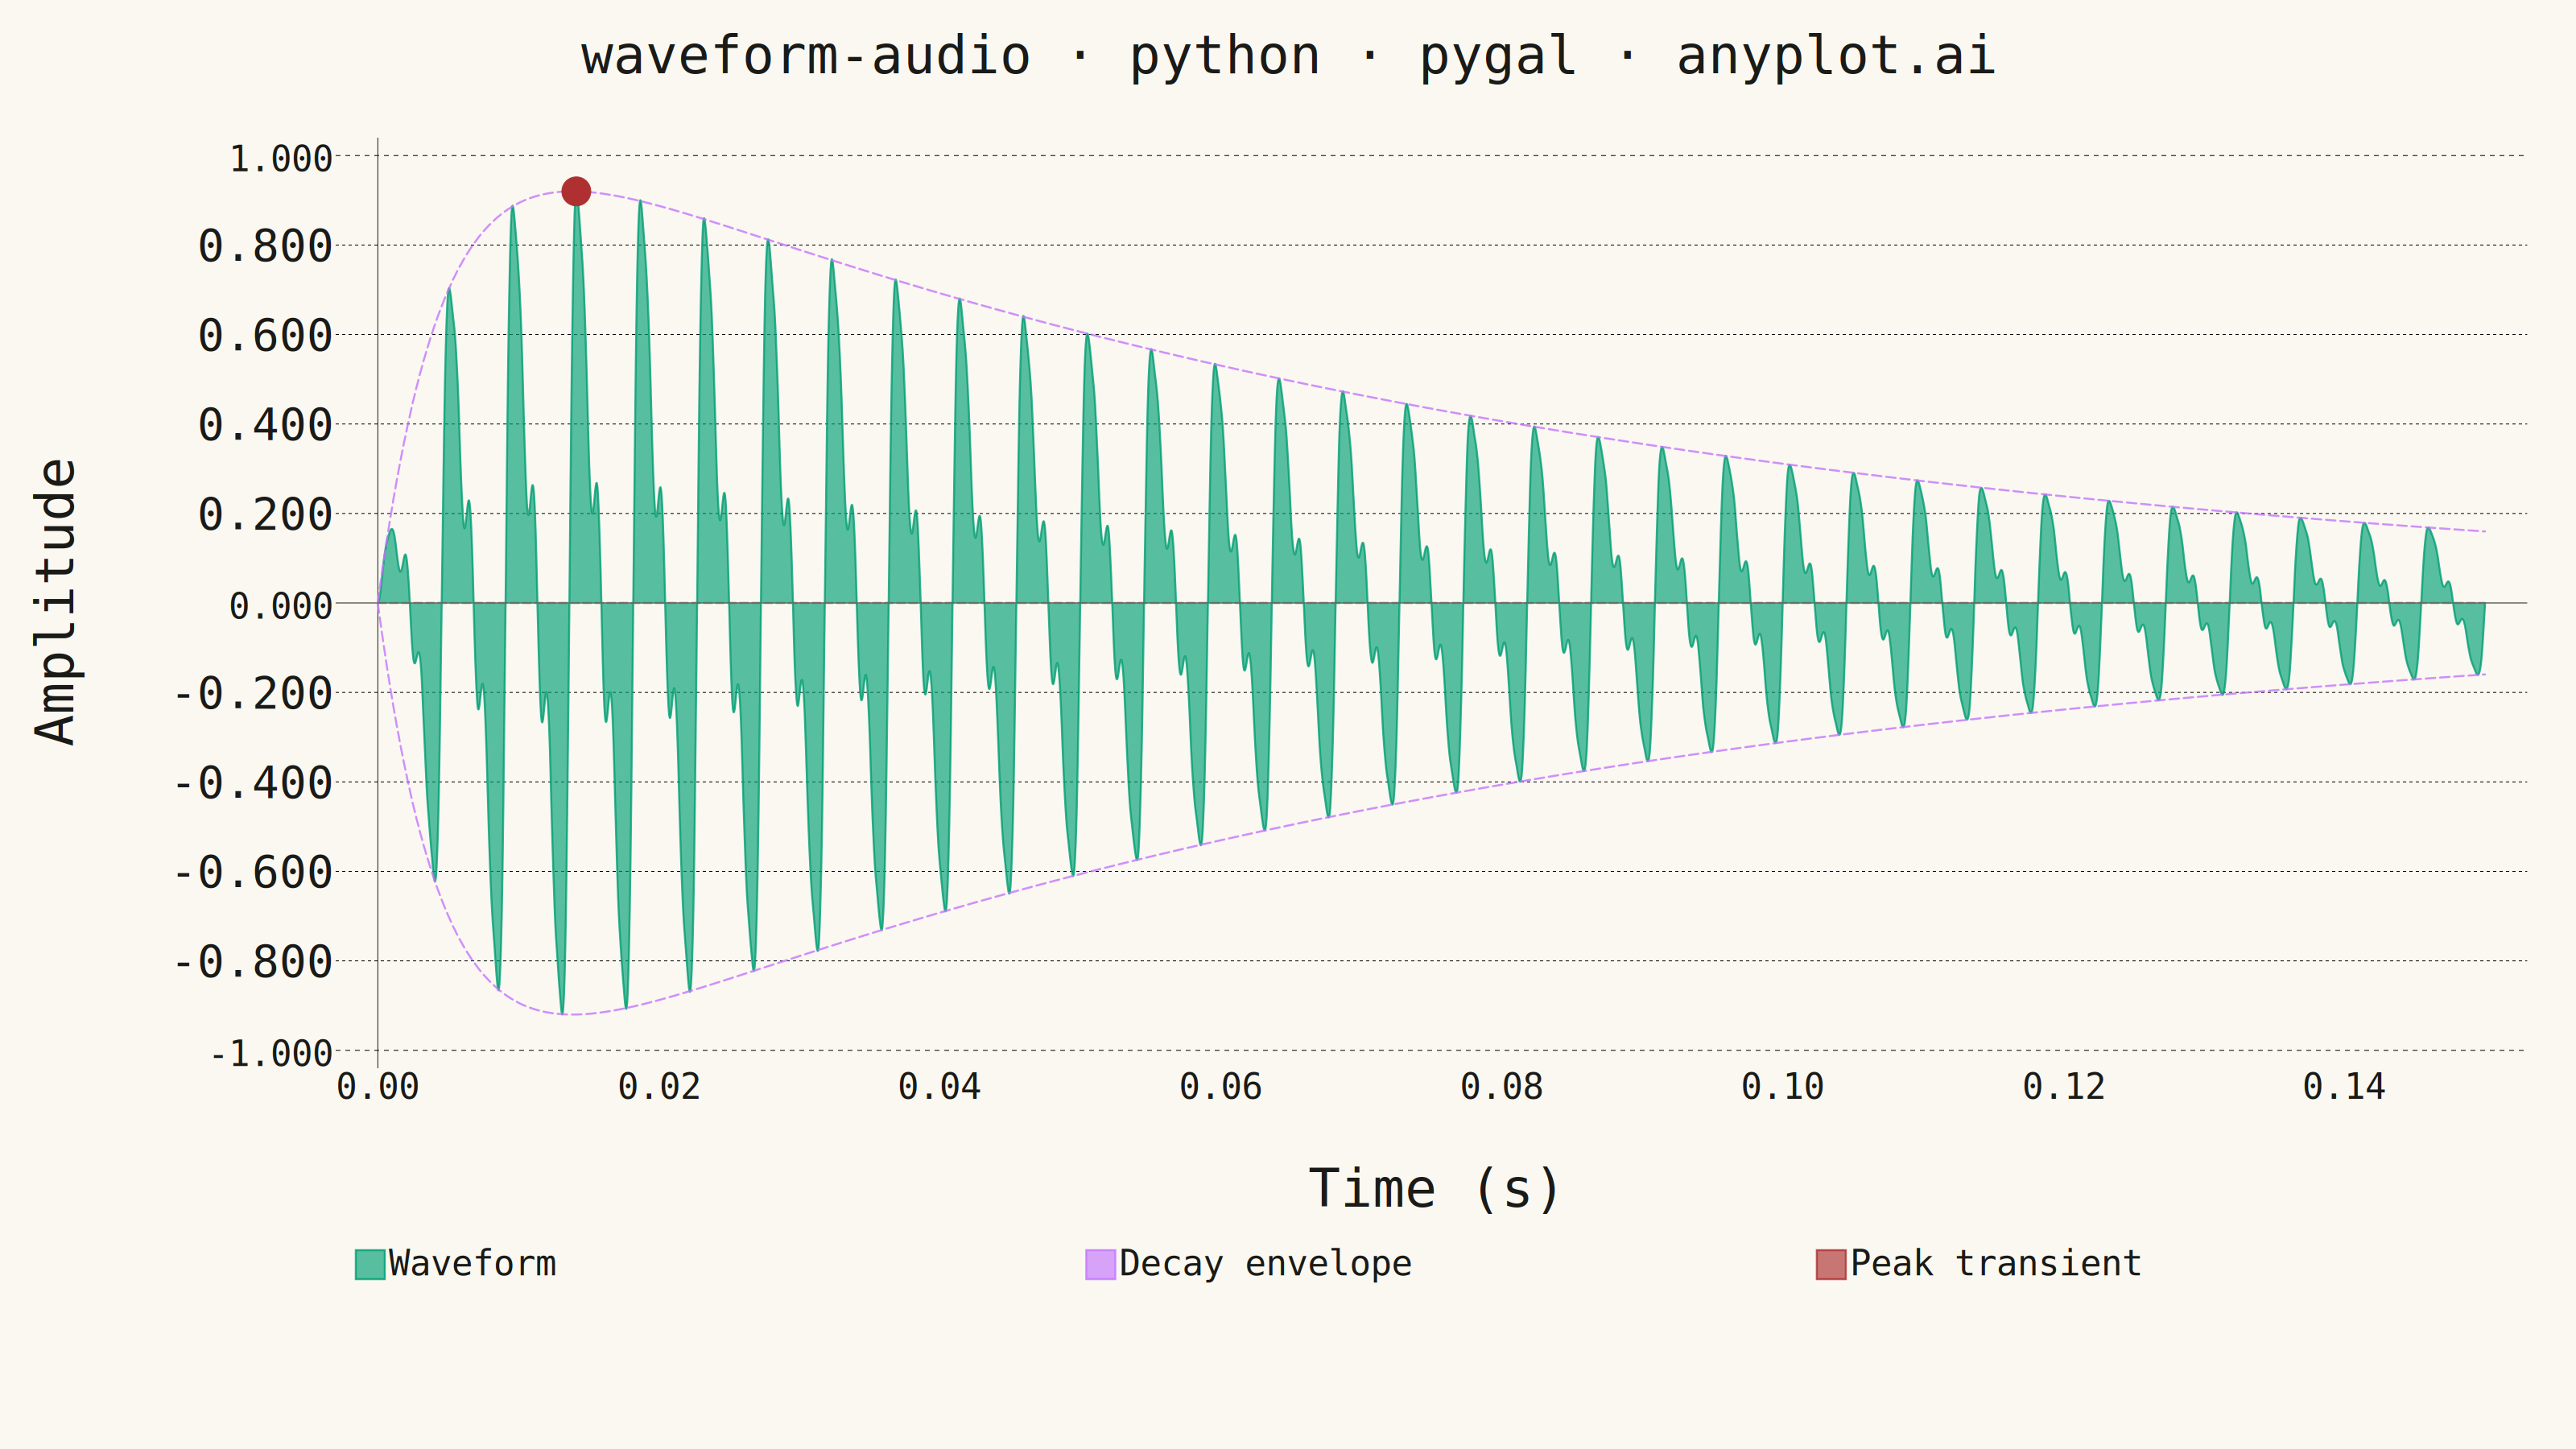
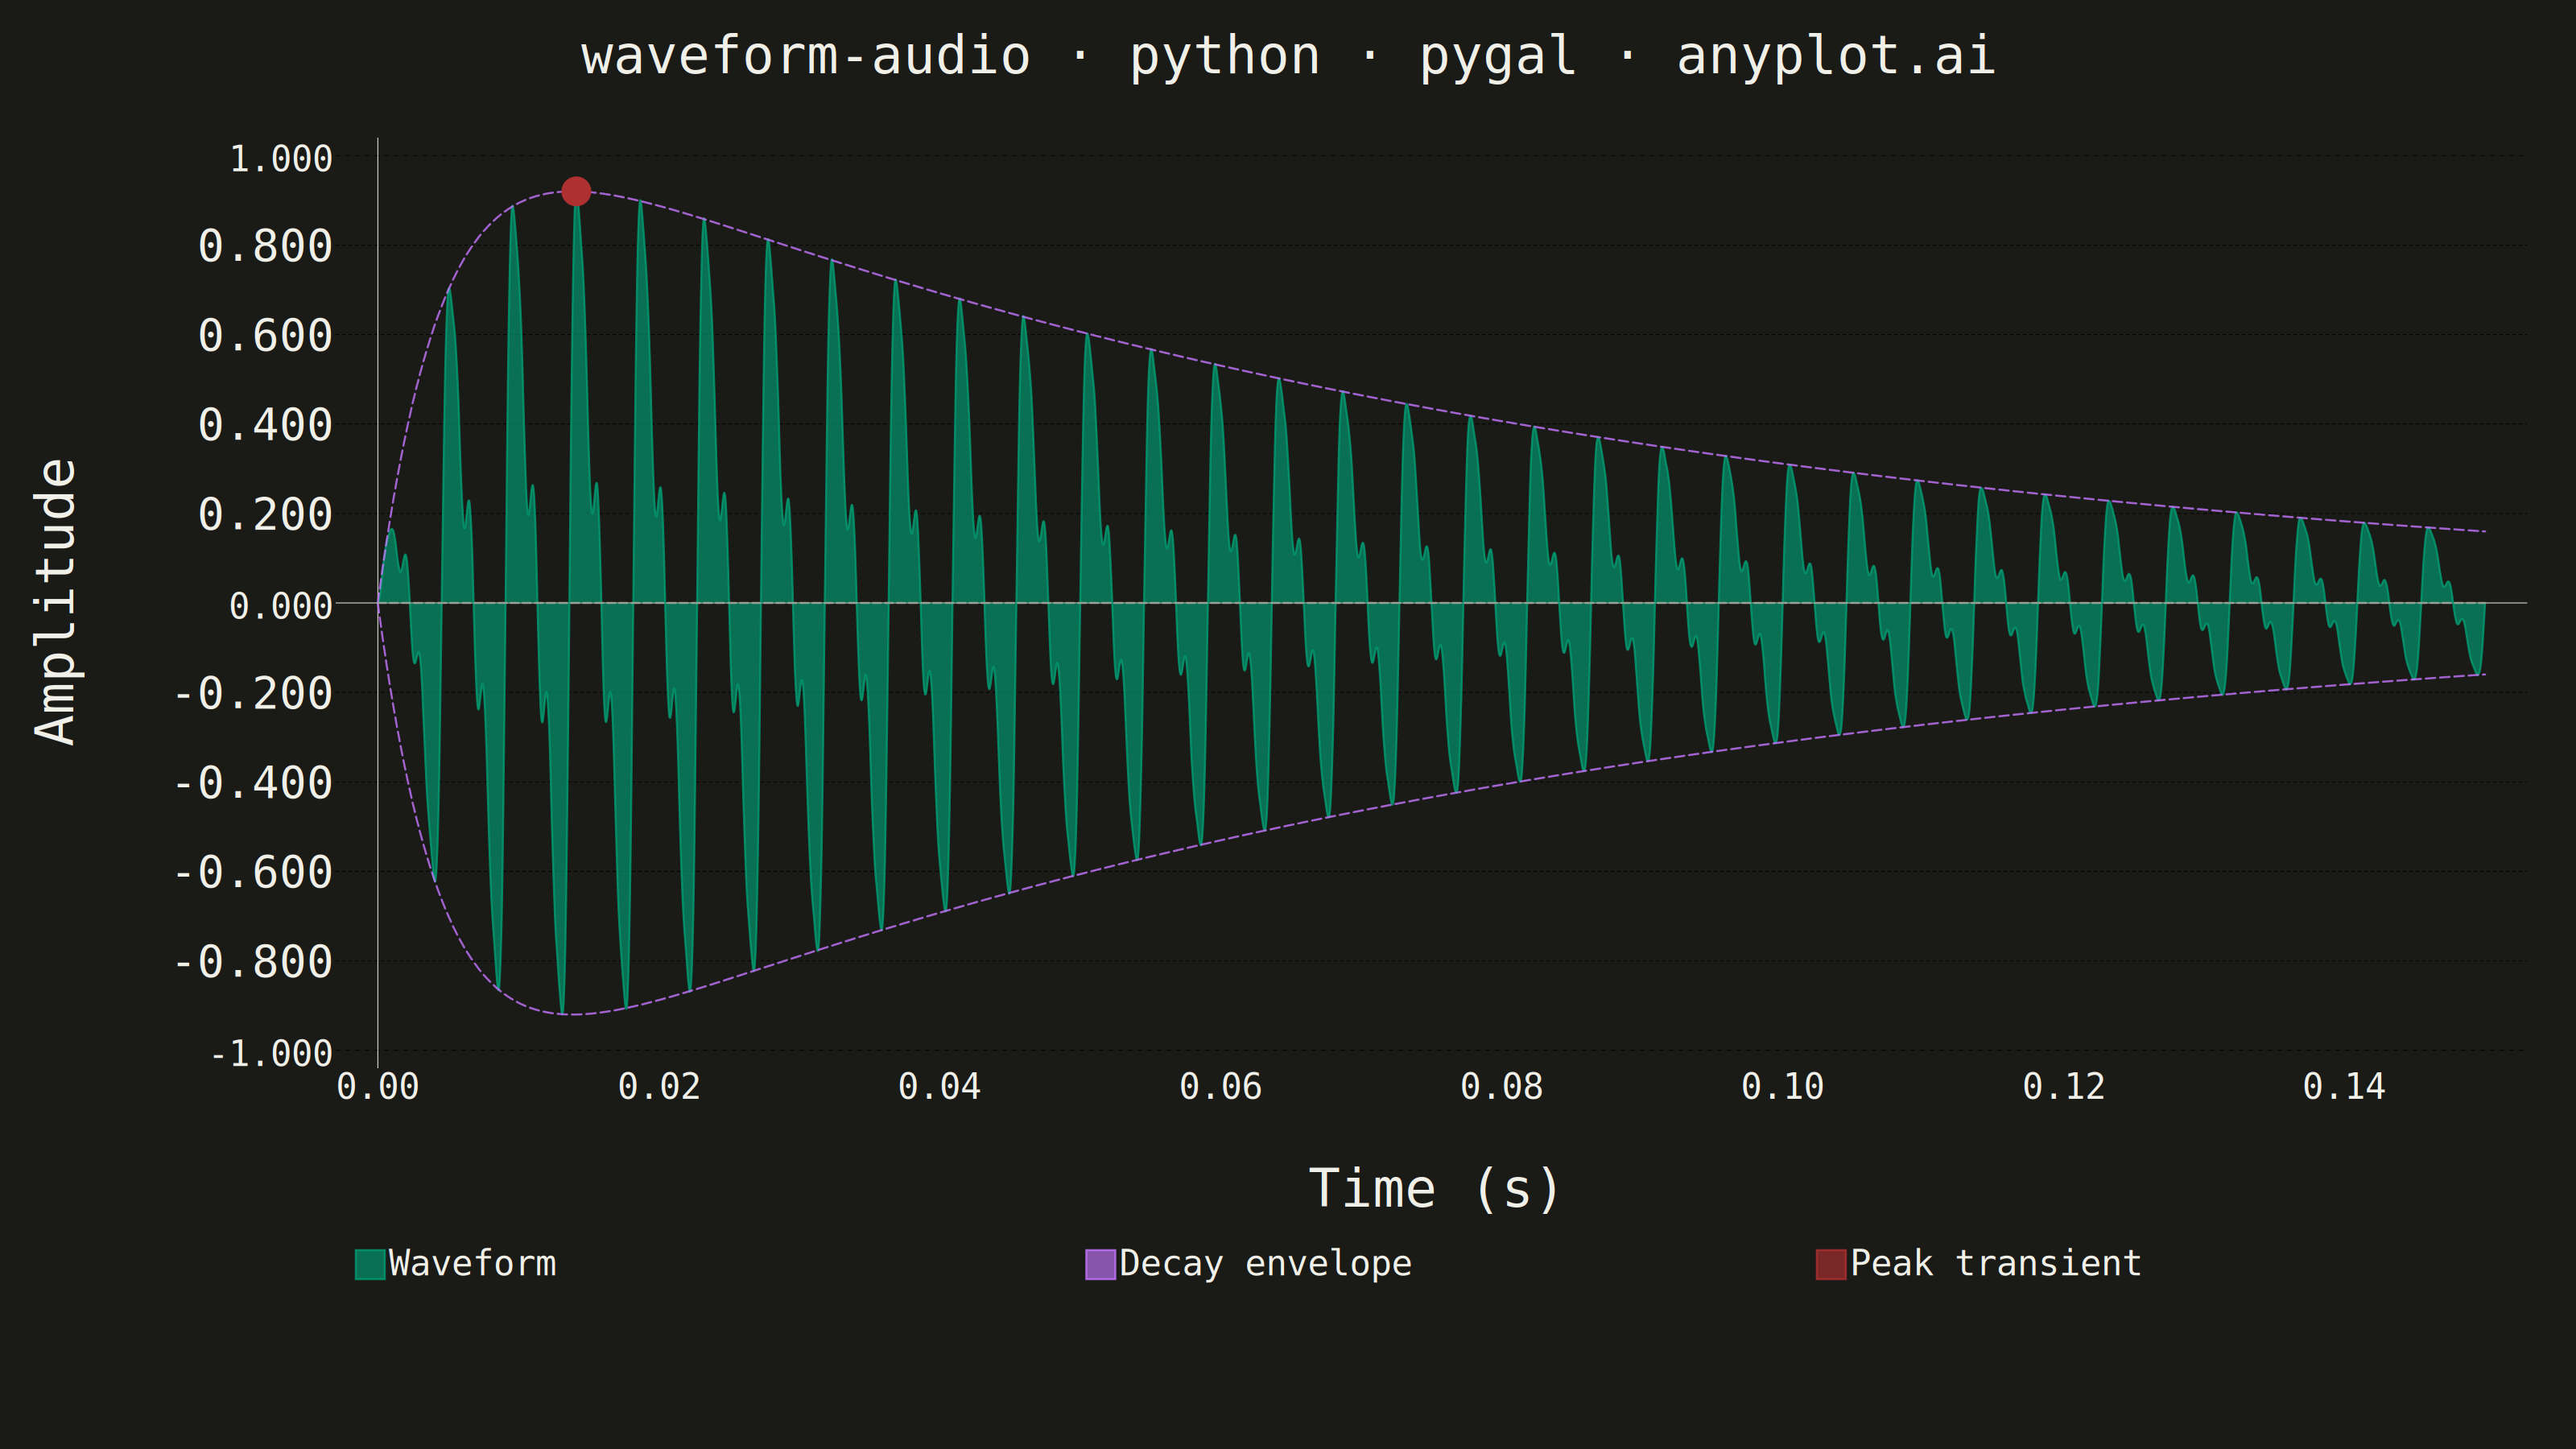
A time-domain visualization of audio amplitude that displays the raw waveform shape as seen in digital audio workstations (DAWs). The plot shows positive and negative amplitude symmetrically around a zero baseline, with time on the x-axis and normalized amplitude (-1 to +1) on the y-axis. This is the fundamental representation for inspecting audio signals, revealing dynamics, clipping, silence, and transient characteristics at a glance.
""" anyplot.ai
waveform-audio: Audio Waveform Plot
Library: pygal 3.1.0 | Python 3.13.13
Quality: 87/100 | Updated: 2026-06-03
"""

import importlib.util
import os
import sys

import numpy as np


# Prevent this file (pygal.py) from shadowing the installed pygal package
_pygal_spec = importlib.util.find_spec("pygal")
if _pygal_spec and _pygal_spec.origin != __file__:
    import pygal
    from pygal.style import Style
else:
    _cwd = sys.path.pop(0)
    import pygal
    from pygal.style import Style

    sys.path.insert(0, _cwd)

# Theme tokens
THEME = os.getenv("ANYPLOT_THEME", "light")
PAGE_BG = "#FAF8F1" if THEME == "light" else "#1A1A17"
INK = "#1A1A17" if THEME == "light" else "#F0EFE8"
INK_MUTED = "#6B6A63" if THEME == "light" else "#A8A79F"

# Series colors — Imprint palette position 1 for waveform; position 2 for envelope
# (lower envelope duplicates position 2 for visual continuity); semantic red for peak peak;
# neutral muted for zero reference line
CHART_COLORS = (
    "#009E73",  # Waveform — Imprint position 1
    "#C475FD",  # Decay envelope upper — Imprint position 2
    "#C475FD",  # Decay envelope lower — matches upper for visual continuity
    "#AE3030",  # Peak transient — semantic red (maximum amplitude marker)
    INK_MUTED,  # Zero reference line — neutral chrome
)

# Data - synthesized A3 note (220 Hz) with harmonics and decay envelope
np.random.seed(42)
sample_rate = 44100
duration = 0.15
t = np.linspace(0, duration, int(sample_rate * duration))

fundamental = 220
attack_time = 0.005
envelope = np.exp(-2.0 * t / duration) * (1.0 - np.exp(-t / attack_time))
signal = (
    np.sin(2 * np.pi * fundamental * t)
    + 0.5 * np.sin(2 * np.pi * 2 * fundamental * t)
    + 0.25 * np.sin(2 * np.pi * 3 * fundamental * t)
    + 0.12 * np.sin(2 * np.pi * 5 * fundamental * t)
)
signal = signal / np.max(np.abs(signal))
amplitude = signal * envelope
amplitude = amplitude / np.max(np.abs(amplitude)) * 0.92

# Downsample for pygal SVG rendering — enough points for smooth waveform shape
n_points = 1200
indices = np.linspace(0, len(t) - 1, n_points, dtype=int)
t_down = t[indices]
amp_down = amplitude[indices]
env_down = envelope[indices] / np.max(np.abs(envelope)) * 0.92

# Per-point dict format for rich interactive tooltips — pygal-distinctive feature
waveform_data = [
    {
        "value": (round(float(t_down[i]), 5), round(float(amp_down[i]), 4)),
        "label": f"t={float(t_down[i]):.4f}s  amp={float(amp_down[i]):.3f}",
    }
    for i in range(n_points)
]

envelope_upper = [
    {
        "value": (round(float(t_down[i]), 5), round(float(env_down[i]), 4)),
        "label": f"envelope: +{float(env_down[i]):.3f}",
    }
    for i in range(n_points)
]
envelope_lower = [
    {
        "value": (round(float(t_down[i]), 5), round(float(-env_down[i]), 4)),
        "label": f"envelope: {float(-env_down[i]):.3f}",
    }
    for i in range(n_points)
]

# Peak amplitude marker — highlights the attack transient
peak_idx = int(np.argmax(np.abs(amp_down)))
peak_marker = [
    {
        "value": (round(float(t_down[peak_idx]), 5), round(float(amp_down[peak_idx]), 4)),
        "label": f"Peak: {float(amp_down[peak_idx]):.3f} at {float(t_down[peak_idx]):.4f}s",
    }
]

# Zero reference line
zero_line = [
    {"value": (0.0, 0.0), "label": "zero baseline"},
    {"value": (round(float(t_down[-1]), 5), 0.0), "label": "zero baseline"},
]

# Title — 44 chars, under 67-char baseline, so default font size applies
title = "waveform-audio · python · pygal · anyplot.ai"

custom_style = Style(
    background=PAGE_BG,
    plot_background=PAGE_BG,
    foreground=INK,
    foreground_strong=INK,
    foreground_subtle=INK_MUTED,
    colors=CHART_COLORS,
    title_font_size=66,
    label_font_size=56,
    major_label_font_size=44,
    legend_font_size=44,
    value_font_size=36,
    stroke_width=2.5,
    opacity=0.65,
    opacity_hover=0.95,
    transition="200ms ease-in",
)

x_labels = [round(i * 0.02, 2) for i in range(8)]

chart = pygal.XY(
    width=3200,
    height=1800,
    style=custom_style,
    title=title,
    x_title="Time (s)",
    y_title="Amplitude",
    show_dots=False,
    fill=True,
    stroke_style={"width": 2.5},
    show_legend=True,
    legend_at_bottom=True,
    legend_box_size=36,
    range=(-1.0, 1.0),
    show_x_guides=False,
    show_y_guides=True,
    x_labels=x_labels,
    x_labels_major_every=1,
    x_value_formatter=lambda x: f"{x:.2f}",
    value_formatter=lambda x: f"{x:.3f}",
    print_values=False,
    margin_top=80,
    margin_bottom=100,
    margin_left=100,
    margin_right=60,
    spacing=25,
    show_minor_x_labels=False,
    explicit_size=True,
    js=[],
    interpolate="cubic",
)

chart.add("Waveform", waveform_data)
chart.add(
    "Decay envelope",
    envelope_upper,
    stroke_style={"width": 4.5, "dasharray": "12,6", "linecap": "round"},
    show_dots=False,
    fill=False,
)
chart.add(
    None,
    envelope_lower,
    stroke_style={"width": 4.5, "dasharray": "12,6", "linecap": "round"},
    show_dots=False,
    fill=False,
)
# Peak transient — larger dot (18) for visibility against dense waveform
chart.add("Peak transient", peak_marker, stroke_style={"width": 0}, dots_size=18, show_dots=True, fill=False)
chart.add(
    None, zero_line, stroke_style={"width": 3.0, "dasharray": "10,5", "linecap": "round"}, show_dots=False, fill=False
)

# Save
chart.render_to_png(f"plot-{THEME}.png")

with open(f"plot-{THEME}.html", "wb") as f:
    f.write(chart.render())
Runnable source as JSON, for any HTTP client: https://api.anyplot.ai/specs/waveform-audio/pygal/code. Any spec id and library id listed in llms-full.txt fit the same URL shape; every URL below is complete and callable.
{
  "spec_id": "waveform-audio",
  "language": "python",
  "library": "pygal",
  "page": "https://anyplot.ai/waveform-audio/python/pygal",
  "hub": "https://anyplot.ai/waveform-audio",
  "code_json": "https://api.anyplot.ai/specs/waveform-audio/pygal/code",
  "spec_json": "https://api.anyplot.ai/specs/waveform-audio",
  "render_light_png": "https://storage.googleapis.com/anyplot-images/plots/waveform-audio/python/pygal/plot-light.png",
  "render_dark_png": "https://storage.googleapis.com/anyplot-images/plots/waveform-audio/python/pygal/plot-dark.png",
  "interactive_light_html": "https://storage.googleapis.com/anyplot-images/plots/waveform-audio/python/pygal/plot-light.html",
  "interactive_dark_html": "https://storage.googleapis.com/anyplot-images/plots/waveform-audio/python/pygal/plot-dark.html",
  "quality_score": 87.0,
  "license": "MIT",
  "guide": "https://anyplot.ai/llms.txt"
}
Part of Audio Waveform Plot on anyplot.ai.