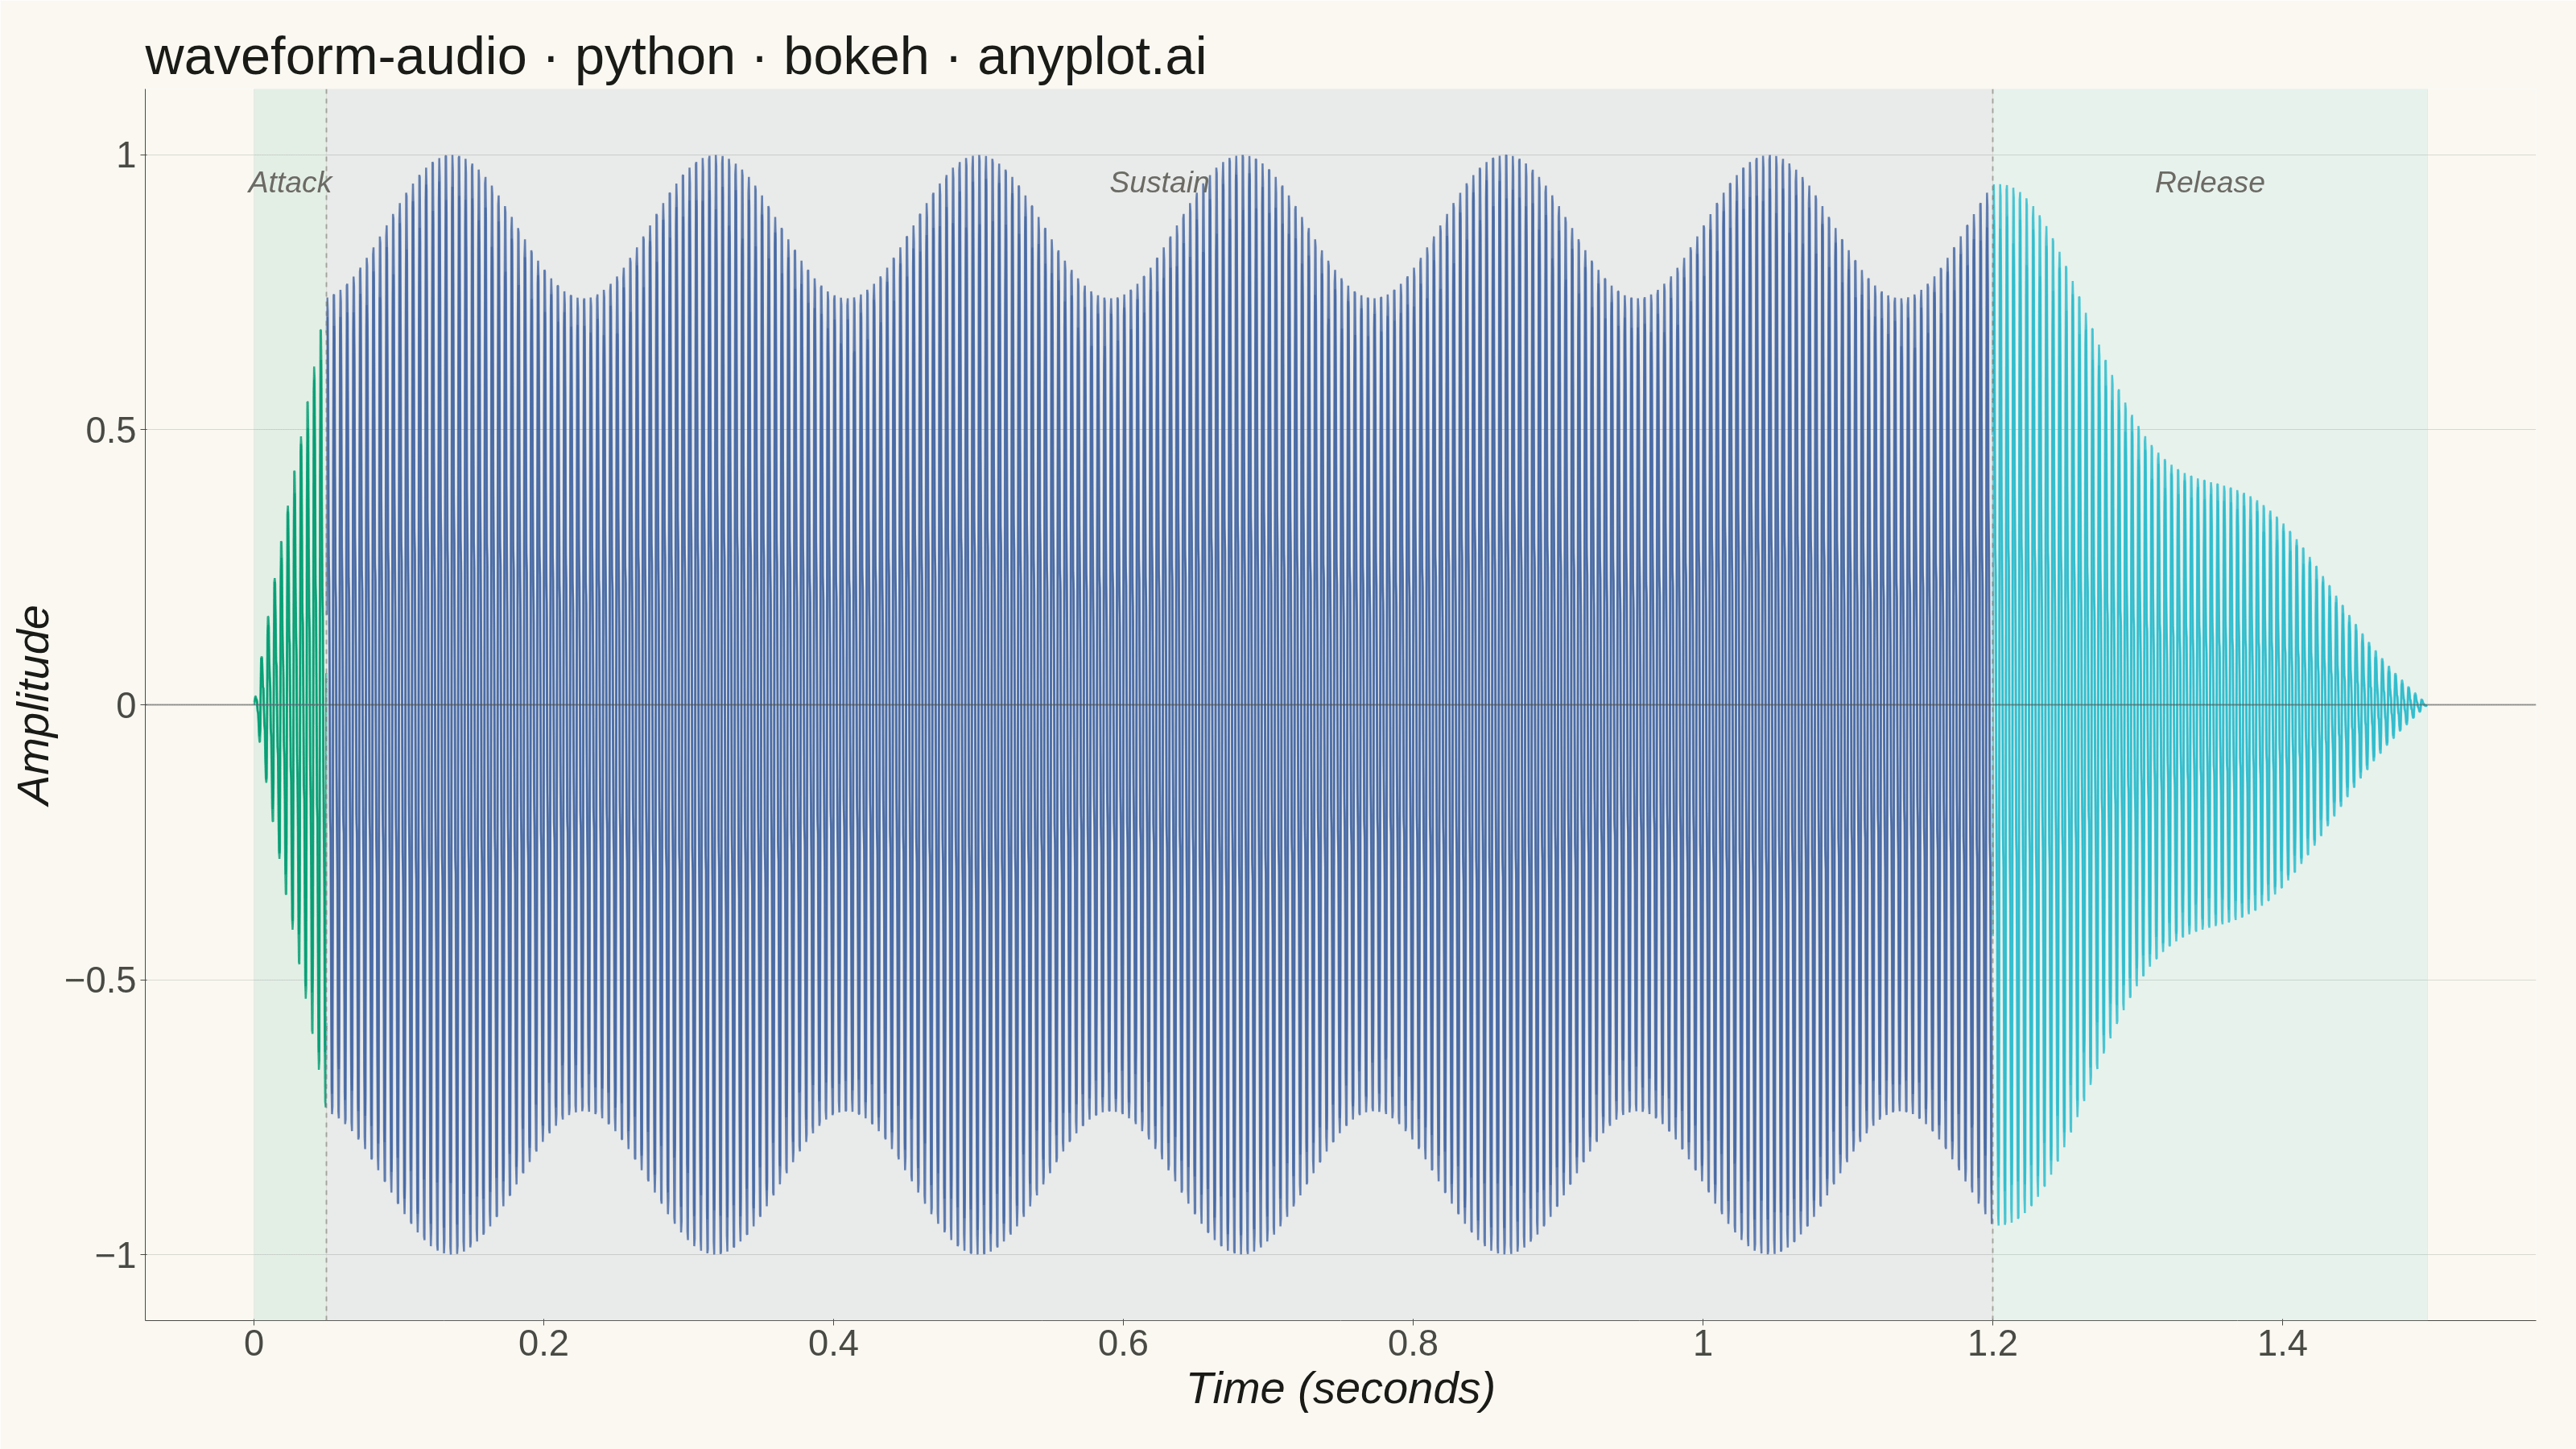
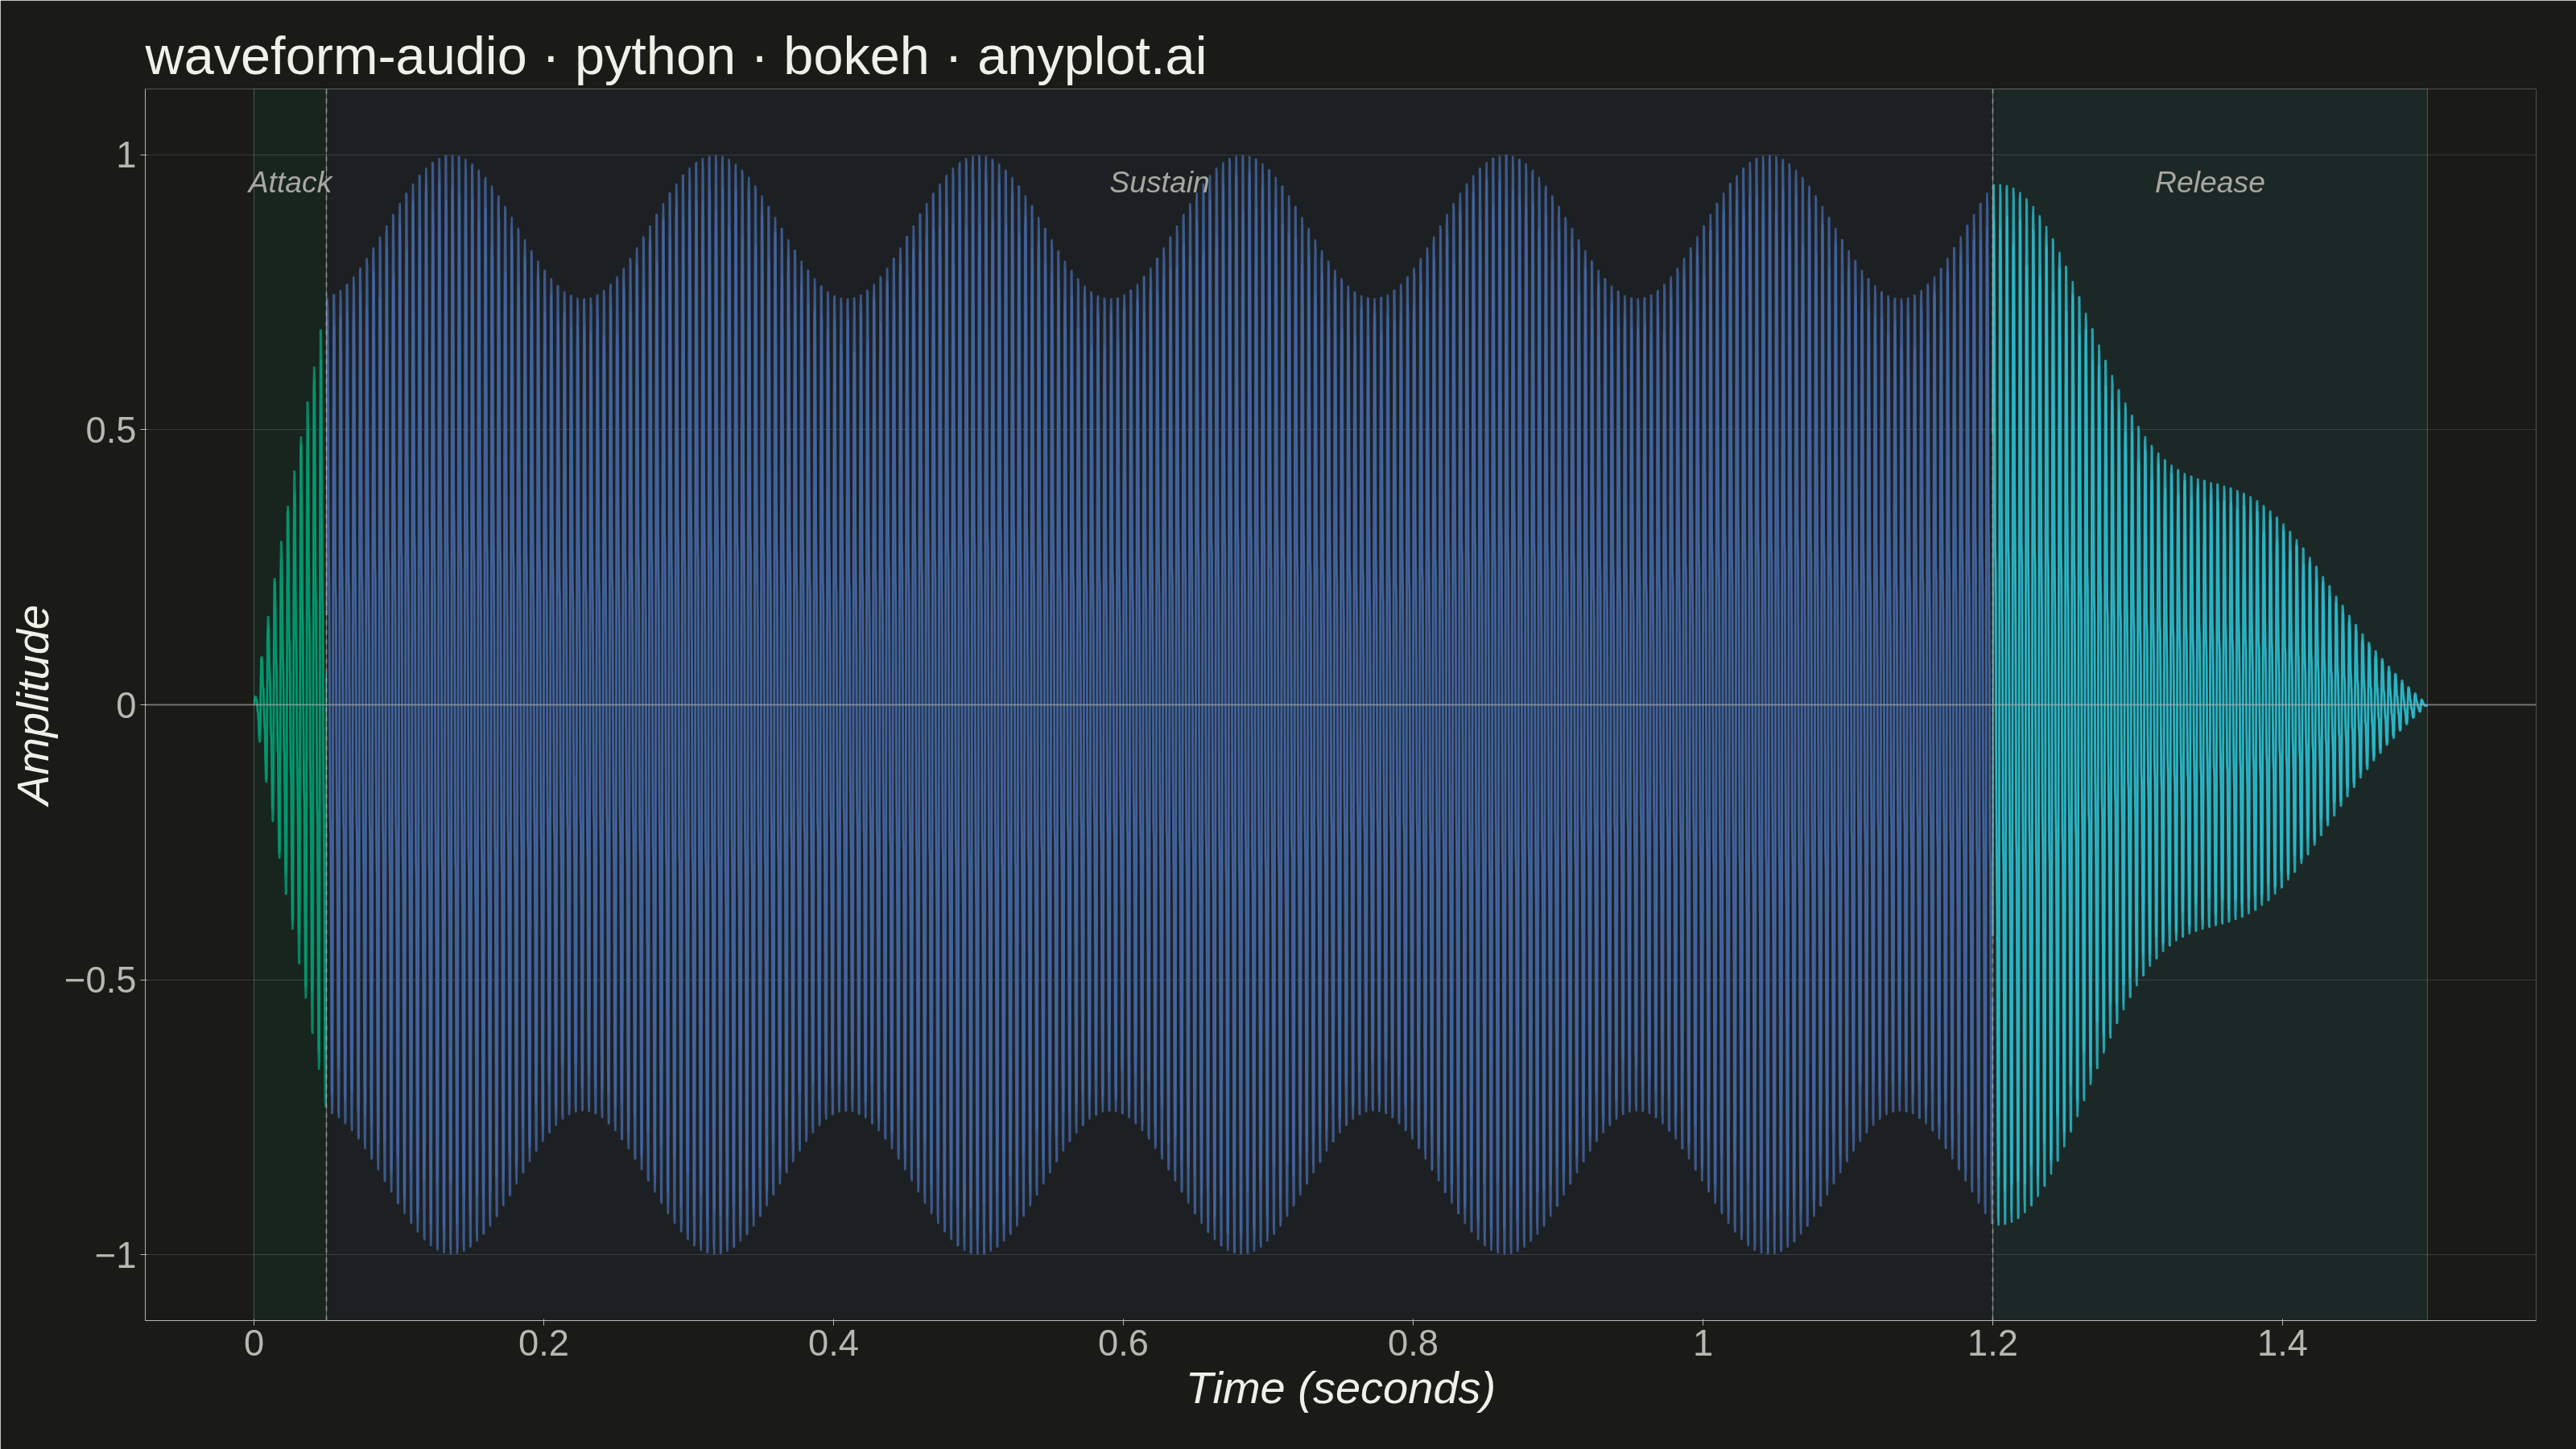
A time-domain visualization of audio amplitude that displays the raw waveform shape as seen in digital audio workstations (DAWs). The plot shows positive and negative amplitude symmetrically around a zero baseline, with time on the x-axis and normalized amplitude (-1 to +1) on the y-axis. This is the fundamental representation for inspecting audio signals, revealing dynamics, clipping, silence, and transient characteristics at a glance.
""" anyplot.ai
waveform-audio: Audio Waveform Plot
Library: bokeh 3.9.0 | Python 3.13.13
Quality: 90/100 | Updated: 2026-06-03
"""

import os
import sys
import time
from pathlib import Path


# Prevent this file (bokeh.py) from shadowing the installed bokeh package on direct invocation
_impl_dir = os.path.abspath(os.path.dirname(__file__))
sys.path = [p for p in sys.path if os.path.abspath(p or ".") != _impl_dir]

import numpy as np
from bokeh.io import output_file, save
from bokeh.models import BoxAnnotation, ColumnDataSource, Label, Range1d, Span
from bokeh.plotting import figure
from PIL import Image
from selenium import webdriver
from selenium.webdriver.chrome.options import Options


# Theme tokens
THEME = os.getenv("ANYPLOT_THEME", "light")
PAGE_BG = "#FAF8F1" if THEME == "light" else "#1A1A17"
INK = "#1A1A17" if THEME == "light" else "#F0EFE8"
INK_SOFT = "#4A4A44" if THEME == "light" else "#B8B7B0"
INK_MUTED = "#6B6A63" if THEME == "light" else "#A8A79F"

# Imprint palette phase colors (green → blue → cyan: cohesive cool progression)
COLOR_ATTACK = "#009E73"  # Imprint position 1, brand green
COLOR_SUSTAIN = "#4467A3"  # Imprint position 3, blue
COLOR_RELEASE = "#2ABCCD"  # Imprint position 6, cyan

# Data
np.random.seed(42)
sample_rate = 22050
duration = 1.5
num_samples = int(sample_rate * duration)
t = np.linspace(0, duration, num_samples)

# Synthesize audio: fundamental + harmonics with amplitude envelope
fundamental = 220
signal = (
    0.6 * np.sin(2 * np.pi * fundamental * t)
    + 0.25 * np.sin(2 * np.pi * fundamental * 2 * t)
    + 0.1 * np.sin(2 * np.pi * fundamental * 3 * t)
    + 0.05 * np.sin(2 * np.pi * fundamental * 5 * t)
)

# Amplitude envelope: attack-sustain-release shape
envelope = np.ones(num_samples)
attack_samples = int(0.05 * sample_rate)
release_samples = int(0.3 * sample_rate)
envelope[:attack_samples] = np.linspace(0, 1, attack_samples)
envelope[-release_samples:] = np.linspace(1, 0, release_samples)

# Phase boundaries (in seconds)
attack_end = 0.05
sustain_end = duration - 0.3

# Add tremolo modulation
tremolo = 1.0 - 0.15 * np.sin(2 * np.pi * 5.5 * t)
amplitude = signal * envelope * tremolo
amplitude = amplitude / np.max(np.abs(amplitude))

# Min/max envelope rendering (downsampled to avoid aliasing)
chunk_size = 8
num_chunks = num_samples // chunk_size
t_chunked = t[: num_chunks * chunk_size].reshape(num_chunks, chunk_size)
amp_chunked = amplitude[: num_chunks * chunk_size].reshape(num_chunks, chunk_size)

env_time = t_chunked.mean(axis=1)
env_max = amp_chunked.max(axis=1)
env_min = amp_chunked.min(axis=1)

# Split into attack / sustain / release segments
attack_mask = env_time <= attack_end
sustain_mask = (env_time > attack_end) & (env_time <= sustain_end)
release_mask = env_time > sustain_end

source_attack = ColumnDataSource(
    data={"x": env_time[attack_mask], "y1": env_min[attack_mask], "y2": env_max[attack_mask]}
)
source_sustain = ColumnDataSource(
    data={"x": env_time[sustain_mask], "y1": env_min[sustain_mask], "y2": env_max[sustain_mask]}
)
source_release = ColumnDataSource(
    data={"x": env_time[release_mask], "y1": env_min[release_mask], "y2": env_max[release_mask]}
)

# Plot
title = "waveform-audio · python · bokeh · anyplot.ai"
p = figure(
    width=3200,
    height=1800,
    title=title,
    x_axis_label="Time (seconds)",
    y_axis_label="Amplitude",
    y_range=Range1d(-1.12, 1.12),
    background_fill_color=PAGE_BG,
    toolbar_location=None,
    min_border_bottom=160,
    min_border_left=180,
    min_border_top=110,
    min_border_right=50,
)

# Phase region shading with BoxAnnotation
phase_alpha = 0.09
p.add_layout(BoxAnnotation(left=0, right=attack_end, fill_color=COLOR_ATTACK, fill_alpha=phase_alpha))
p.add_layout(BoxAnnotation(left=attack_end, right=sustain_end, fill_color=COLOR_SUSTAIN, fill_alpha=phase_alpha))
p.add_layout(BoxAnnotation(left=sustain_end, right=duration, fill_color=COLOR_RELEASE, fill_alpha=phase_alpha))

# Filled waveform using varea (idiomatic Bokeh)
p.varea(x="x", y1="y1", y2="y2", source=source_attack, fill_color=COLOR_ATTACK, fill_alpha=0.45)
p.varea(x="x", y1="y1", y2="y2", source=source_sustain, fill_color=COLOR_SUSTAIN, fill_alpha=0.40)
p.varea(x="x", y1="y1", y2="y2", source=source_release, fill_color=COLOR_RELEASE, fill_alpha=0.45)

# Waveform outline edges
for src, color in [(source_attack, COLOR_ATTACK), (source_sustain, COLOR_SUSTAIN), (source_release, COLOR_RELEASE)]:
    p.line("x", "y2", source=src, line_color=color, line_width=2.5, line_alpha=0.8)
    p.line("x", "y1", source=src, line_color=color, line_width=2.5, line_alpha=0.8)

# Zero baseline
p.add_layout(Span(location=0, dimension="width", line_color=INK_SOFT, line_width=2, line_alpha=0.5))

# Phase labels — 28pt full-alpha, clearly visible over waveform
label_props = {"text_font_size": "28pt", "text_color": INK_MUTED, "text_font_style": "italic", "text_alpha": 1.0}
p.add_layout(Label(x=attack_end / 2, y=0.92, text="Attack", text_align="center", **label_props))
p.add_layout(Label(x=(attack_end + sustain_end) / 2, y=0.92, text="Sustain", text_align="center", **label_props))
p.add_layout(Label(x=(sustain_end + duration) / 2, y=0.92, text="Release", text_align="center", **label_props))

# Phase boundary lines
for boundary in [attack_end, sustain_end]:
    p.add_layout(
        Span(
            location=boundary,
            dimension="height",
            line_color=INK_MUTED,
            line_width=2,
            line_dash="dashed",
            line_alpha=0.5,
        )
    )

# Style
p.title.text_font_size = "50pt"
p.title.text_font_style = "normal"
p.title.text_color = INK
p.xaxis.axis_label_text_font_size = "42pt"
p.yaxis.axis_label_text_font_size = "42pt"
p.xaxis.major_label_text_font_size = "34pt"
p.yaxis.major_label_text_font_size = "34pt"
p.xaxis.axis_label_text_color = INK
p.yaxis.axis_label_text_color = INK
p.xaxis.major_label_text_color = INK_SOFT
p.yaxis.major_label_text_color = INK_SOFT
p.xaxis.axis_line_color = INK_SOFT
p.yaxis.axis_line_color = INK_SOFT
p.xaxis.major_tick_line_color = INK_SOFT
p.yaxis.major_tick_line_color = INK_SOFT
p.xaxis.minor_tick_line_color = None
p.yaxis.minor_tick_line_color = None
p.outline_line_color = None
p.border_fill_color = PAGE_BG

p.xgrid.grid_line_color = None
p.ygrid.grid_line_color = INK
p.ygrid.grid_line_alpha = 0.15

p.yaxis.ticker = [-1.0, -0.5, 0.0, 0.5, 1.0]

# Save HTML
output_file(f"plot-{THEME}.html")
save(p)

# Screenshot with headless Chrome (Selenium)
# Window must exceed figure size so the full 3200×1800 canvas fits in the viewport
W, H = 3200, 1800
W_WIN, H_WIN = W + 200, H + 200
opts = Options()
for arg in (
    "--headless=new",
    "--no-sandbox",
    "--disable-dev-shm-usage",
    "--disable-gpu",
    f"--window-size={W_WIN},{H_WIN}",
    "--hide-scrollbars",
):
    opts.add_argument(arg)
driver = webdriver.Chrome(options=opts)
driver.set_window_size(W_WIN, H_WIN)
driver.get(f"file://{Path(f'plot-{THEME}.html').resolve()}")
time.sleep(3)
driver.save_screenshot(f"plot-{THEME}.png")
driver.quit()

# Crop to exact figure dimensions (window was oversized to avoid viewport clipping)
img = Image.open(f"plot-{THEME}.png")
img.crop((0, 0, W, H)).save(f"plot-{THEME}.png")
Runnable source as JSON, for any HTTP client: https://api.anyplot.ai/specs/waveform-audio/bokeh/code. Any spec id and library id listed in llms-full.txt fit the same URL shape; every URL below is complete and callable.
{
  "spec_id": "waveform-audio",
  "language": "python",
  "library": "bokeh",
  "page": "https://anyplot.ai/waveform-audio/python/bokeh",
  "hub": "https://anyplot.ai/waveform-audio",
  "code_json": "https://api.anyplot.ai/specs/waveform-audio/bokeh/code",
  "spec_json": "https://api.anyplot.ai/specs/waveform-audio",
  "render_light_png": "https://storage.googleapis.com/anyplot-images/plots/waveform-audio/python/bokeh/plot-light.png",
  "render_dark_png": "https://storage.googleapis.com/anyplot-images/plots/waveform-audio/python/bokeh/plot-dark.png",
  "interactive_light_html": "https://storage.googleapis.com/anyplot-images/plots/waveform-audio/python/bokeh/plot-light.html",
  "interactive_dark_html": "https://storage.googleapis.com/anyplot-images/plots/waveform-audio/python/bokeh/plot-dark.html",
  "quality_score": 90.0,
  "license": "MIT",
  "guide": "https://anyplot.ai/llms.txt"
}
Part of Audio Waveform Plot on anyplot.ai.