The same plot in 14 other libraries — JavaScript: D3.js, Apache ECharts, Highcharts, MUI X Charts; Python: Altair, Bokeh, lets-plot, Matplotlib, Plotly, plotnine, Pygal, Seaborn; R: ggplot2; Julia: Makie.jl. Compare all 15 side by side: Basic Arc Diagram in Python, R, Julia and JavaScript.
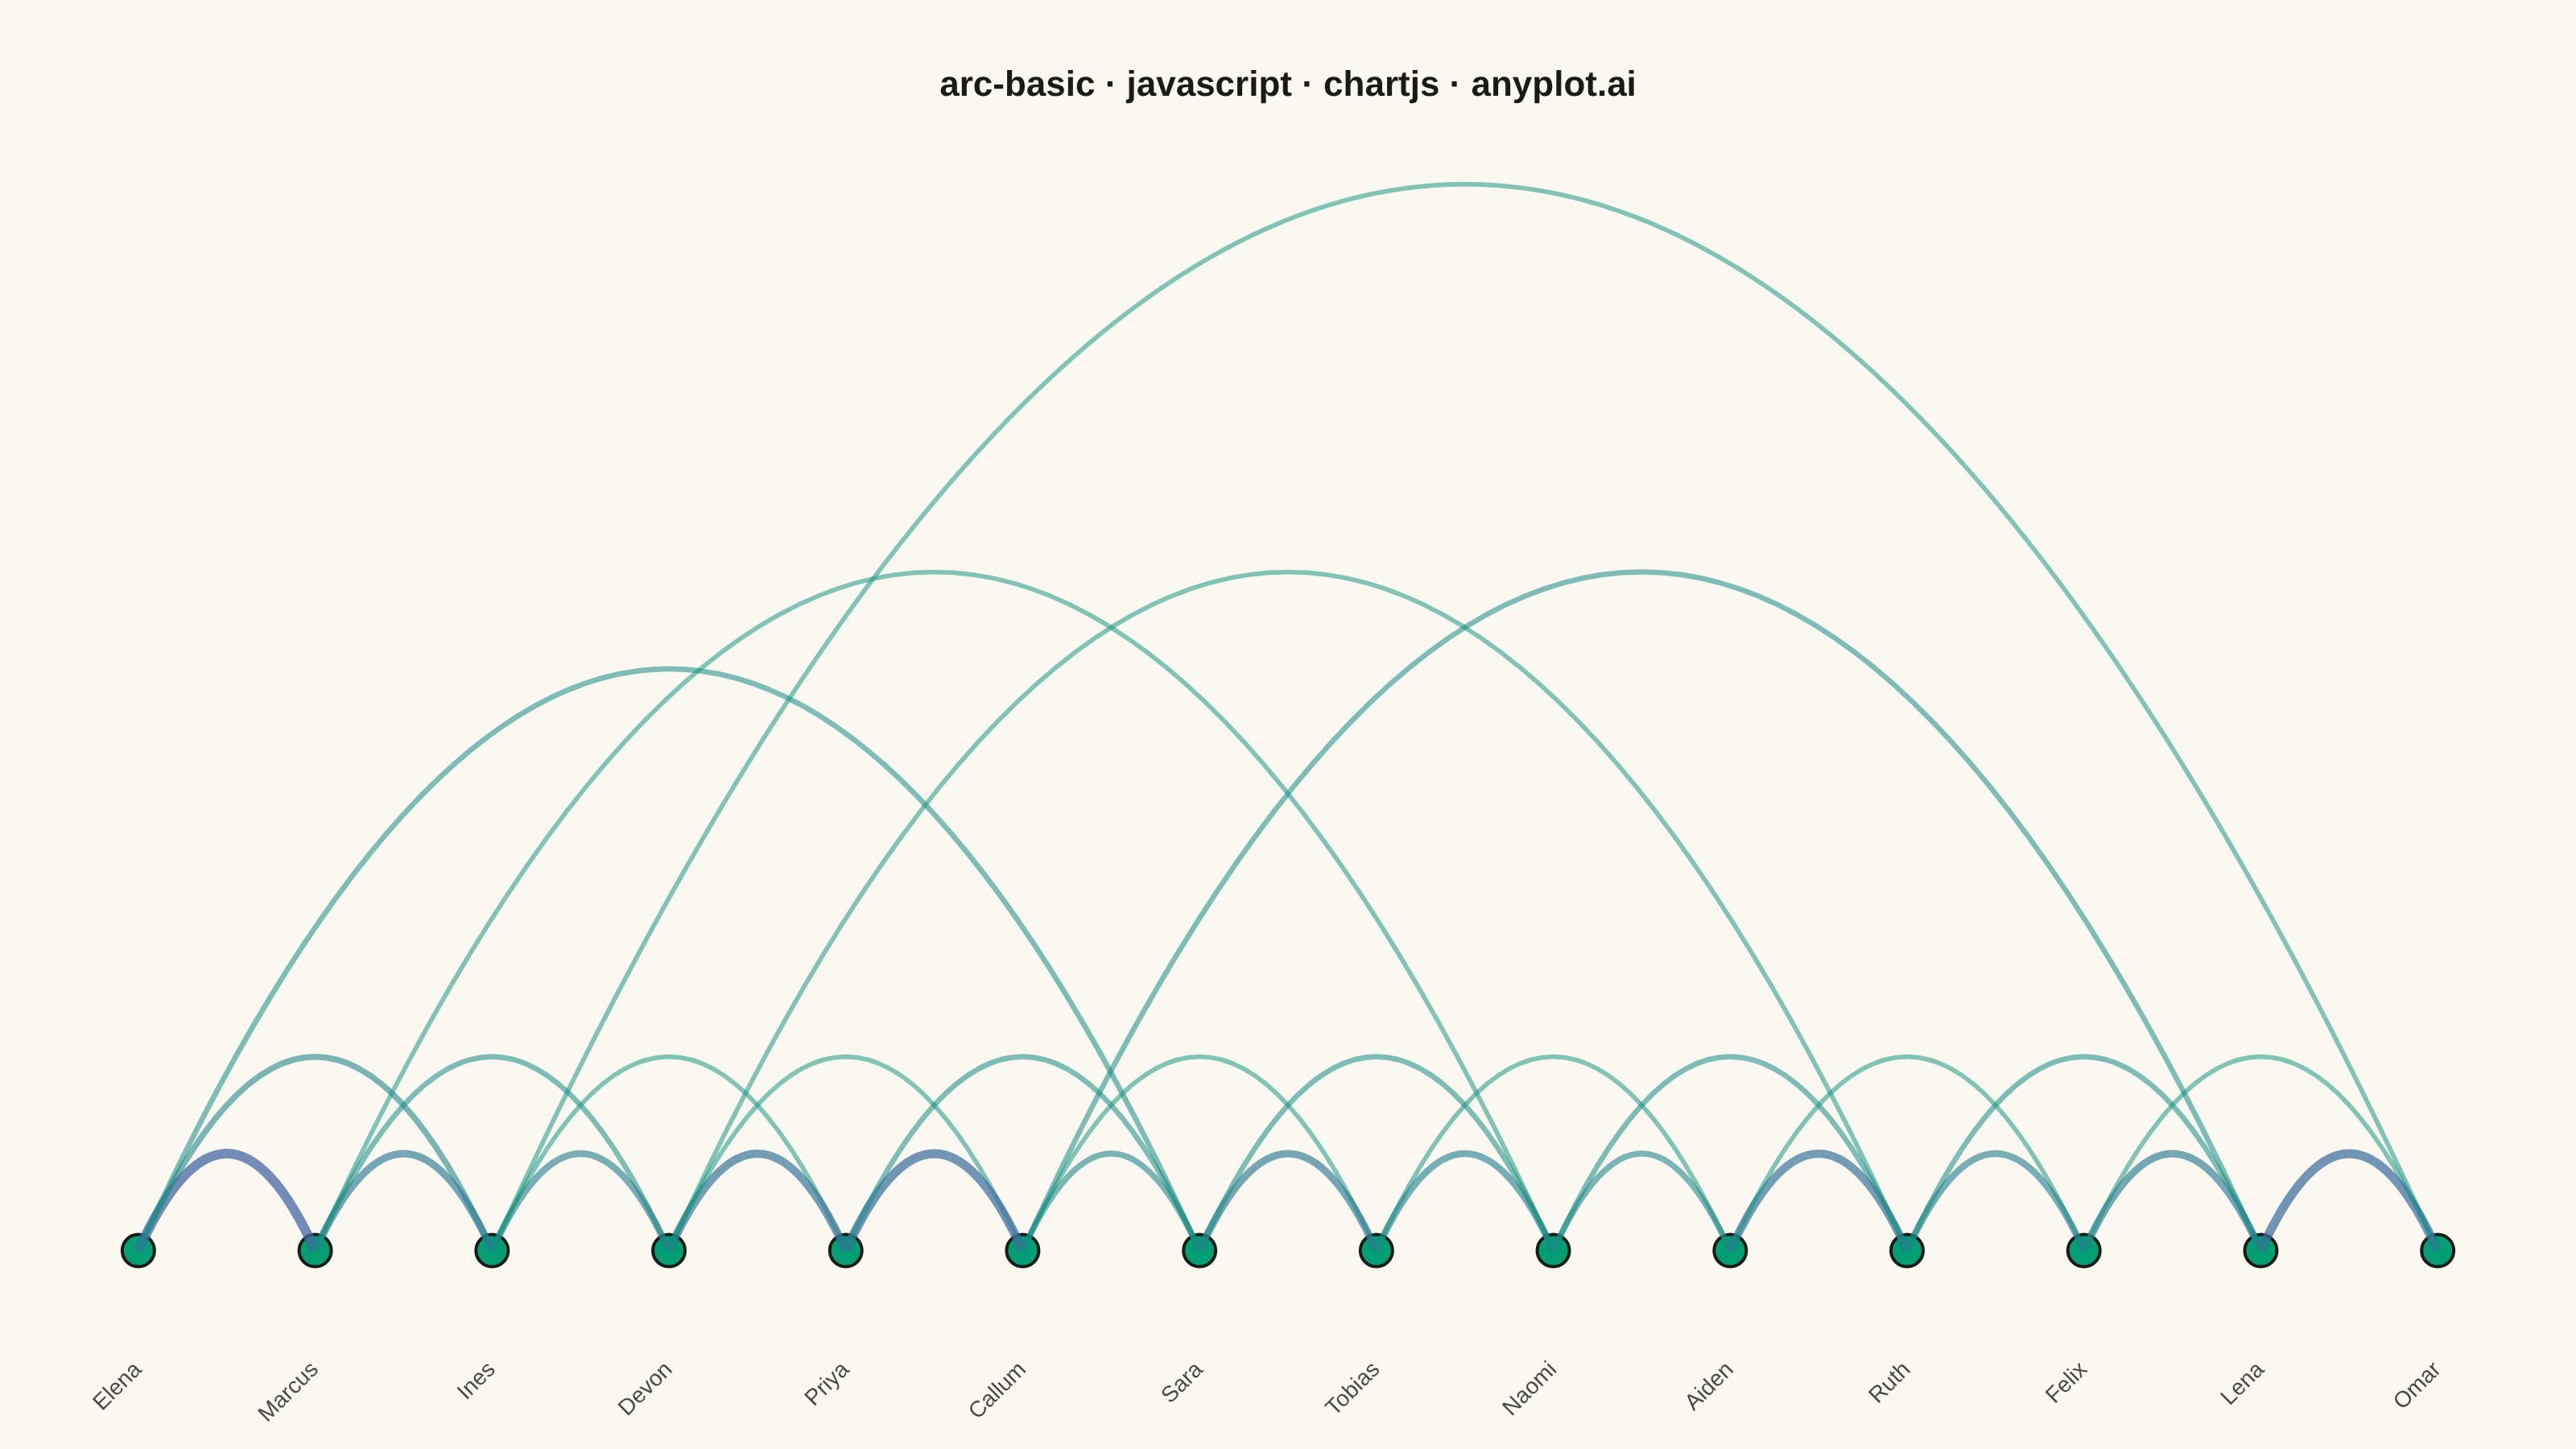
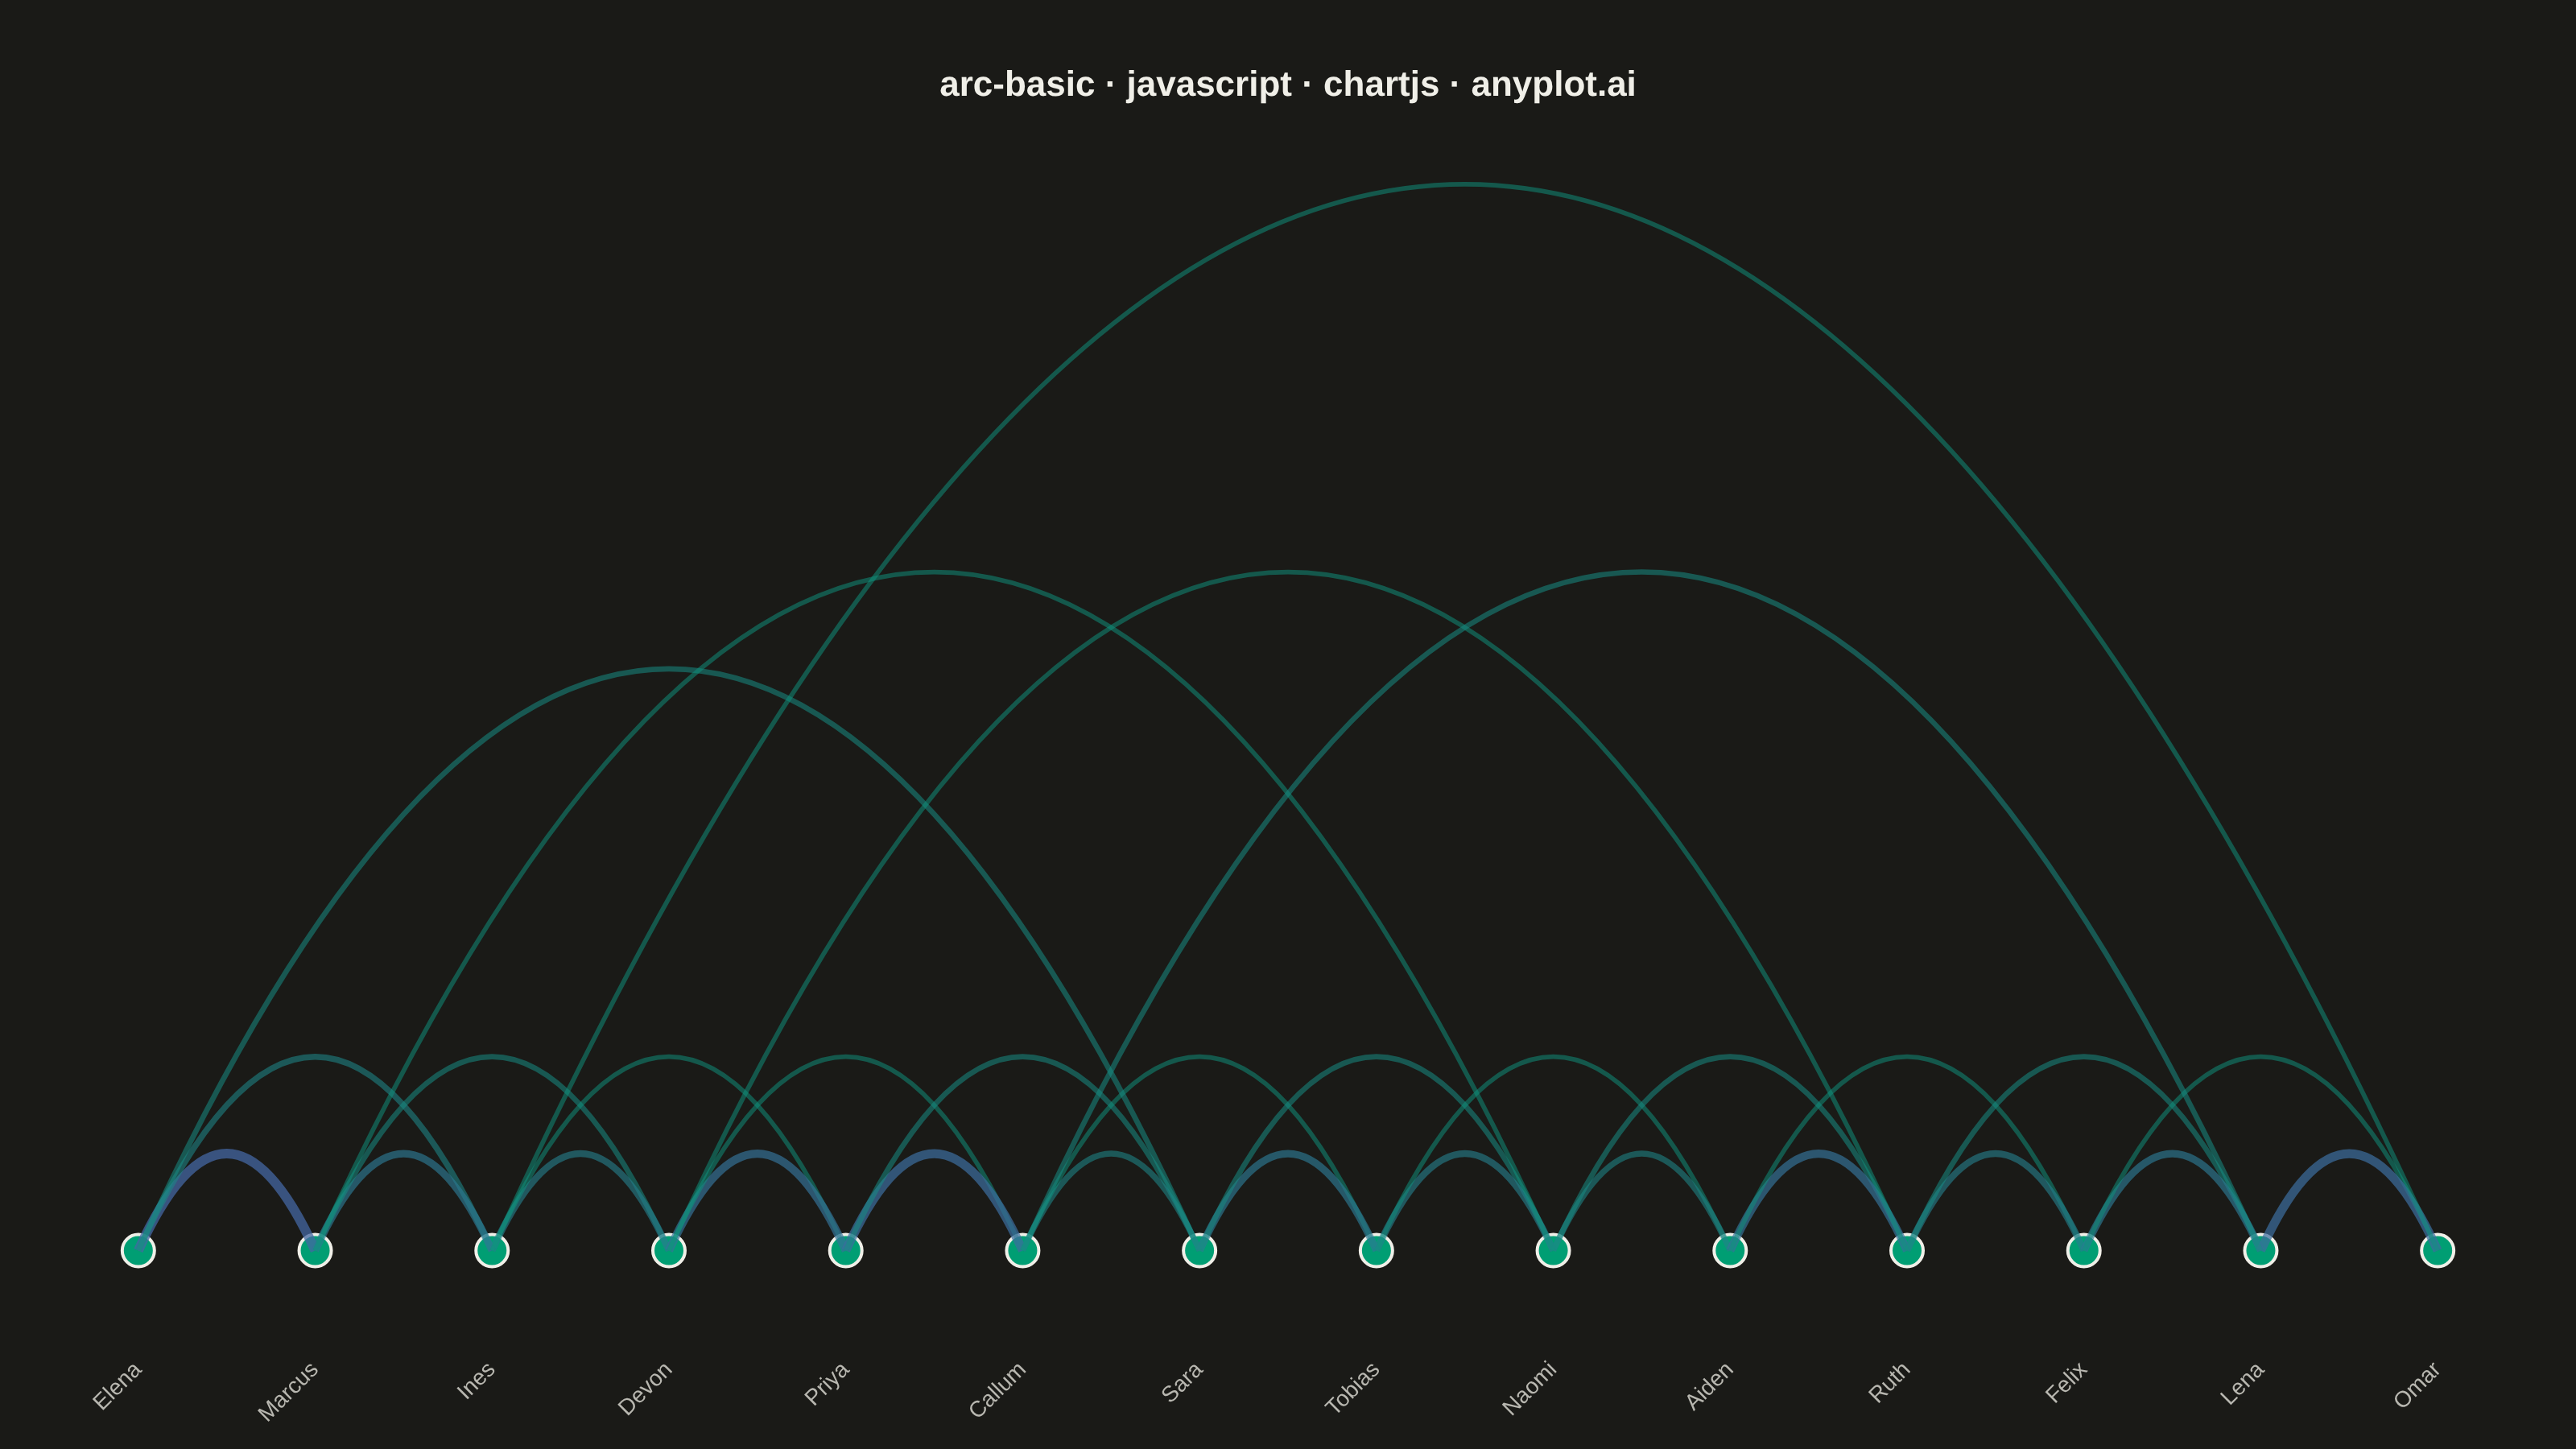
An arc diagram arranges nodes along a single horizontal line and draws connections between them as curved arcs above the line. This layout excels at revealing patterns in sequential or ordered data while minimizing visual clutter compared to force-directed layouts. Arc height typically indicates the distance between connected nodes, making it easy to spot long-range versus short-range connections.
// anyplot.ai
// arc-basic: Basic Arc Diagram
// Library: chartjs 4.4.7 | JavaScript 22.23.2
// Quality: 92/100 | Created: 2026-08-24

const t = window.ANYPLOT_TOKENS;

// --- Data: dialogue exchanges between characters in a novel -----------------
// Nodes are ordered by first appearance; edges are dialogue exchanges with a
// weight (exchange count) that drives arc thickness, opacity and color.
const nodes = [
  "Elena",
  "Marcus",
  "Ines",
  "Devon",
  "Priya",
  "Callum",
  "Sara",
  "Tobias",
  "Naomi",
  "Aiden",
  "Ruth",
  "Felix",
  "Lena",
  "Omar",
];

const edges = [
  [0, 1, 9],
  [0, 2, 4],
  [1, 2, 6],
  [1, 3, 3],
  [2, 3, 5],
  [2, 4, 2],
  [3, 4, 7],
  [3, 5, 2],
  [4, 5, 8],
  [4, 6, 3],
  [5, 6, 4],
  [5, 7, 2],
  [6, 7, 6],
  [6, 8, 3],
  [7, 8, 5],
  [7, 9, 2],
  [8, 9, 4],
  [8, 10, 3],
  [9, 10, 7],
  [9, 11, 2],
  [10, 11, 5],
  [10, 12, 3],
  [11, 12, 6],
  [11, 13, 2],
  [12, 13, 8],
  [0, 6, 3],
  [1, 8, 2],
  [3, 10, 2],
  [5, 12, 3],
  [2, 13, 2],
];

const maxWeight = Math.max(...edges.map((e) => e[2]));
const maxSpan = Math.max(...edges.map(([a, b]) => Math.abs(a - b)));

// --- Color helpers: continuous imprint_seq gradient by edge weight ----------
function hexToRgb(hex) {
  const n = parseInt(hex.slice(1), 16);
  return [(n >> 16) & 255, (n >> 8) & 255, n & 255];
}
function lerpColor(c0, c1, f) {
  const [r0, g0, b0] = hexToRgb(c0);
  const [r1, g1, b1] = hexToRgb(c1);
  const r = Math.round(r0 + (r1 - r0) * f);
  const g = Math.round(g0 + (g1 - g0) * f);
  const b = Math.round(b0 + (b1 - b0) * f);
  return `rgb(${r}, ${g}, ${b})`;
}
function seqColor(f) {
  return lerpColor(t.seq[0], t.seq[1], f);
}

// --- Mount -------------------------------------------------------------------
const canvas = document.createElement("canvas");
document.getElementById("container").appendChild(canvas);

// --- Custom plugin: draws the arcs between nodes -----------------------------
const arcDiagramPlugin = {
  id: "arcDiagram",
  afterDatasetsDraw(chart) {
    const { ctx, chartArea, scales } = chart;
    const xScale = scales.x;
    const yScale = scales.y;
    const baselineY = yScale.getPixelForValue(0);
    const maxAvailable = baselineY - chartArea.top - 24;

    ctx.save();
    edges.forEach(([a, b, weight]) => {
      const span = Math.abs(a - b);
      const x1 = xScale.getPixelForValue(a);
      const x2 = xScale.getPixelForValue(b);
      const xMid = (x1 + x2) / 2;
      const height = (span / maxSpan) * maxAvailable;
      // Quadratic Bezier apex sits halfway to the control point, so the
      // control point must overshoot the desired visual peak by 2x.
      const yPeak = baselineY - height * 2;
      const norm = weight / maxWeight;

      ctx.beginPath();
      ctx.moveTo(x1, baselineY);
      ctx.quadraticCurveTo(xMid, yPeak, x2, baselineY);
      ctx.lineWidth = 2.0 + norm * 4.0;
      ctx.strokeStyle = seqColor(norm);
      ctx.globalAlpha = 0.45 + norm * 0.3;
      ctx.stroke();
    });
    ctx.restore();
  },
};

// --- Chart ---------------------------------------------------------------
new Chart(canvas, {
  type: "scatter",
  data: {
    datasets: [
      {
        label: "Characters",
        data: nodes.map((_, i) => ({ x: i, y: 0 })),
        backgroundColor: t.palette[0],
        borderColor: t.ink,
        borderWidth: 2,
        pointRadius: 10,
        pointHoverRadius: 10,
        order: 0,
      },
    ],
  },
  options: {
    responsive: true,
    maintainAspectRatio: false,
    animation: false,
    layout: {
      padding: { top: 40, bottom: 10, left: 20, right: 20 },
    },
    plugins: {
      title: {
        display: true,
        text: "arc-basic · javascript · chartjs · anyplot.ai",
        color: t.ink,
        font: { size: 22 },
        padding: { bottom: 24 },
      },
      legend: { display: false },
      tooltip: { enabled: false },
    },
    scales: {
      x: {
        type: "linear",
        min: -0.6,
        max: nodes.length - 0.4,
        offset: false,
        grid: { display: false },
        border: { display: false },
        ticks: {
          color: t.inkSoft,
          font: { size: 14 },
          stepSize: 1,
          autoSkip: false,
          maxRotation: 45,
          minRotation: 45,
          callback: (value) => nodes[value] ?? "",
        },
      },
      y: {
        type: "linear",
        min: -0.08,
        max: 1,
        display: false,
      },
    },
  },
  plugins: [arcDiagramPlugin],
});
Runnable source as JSON, for any HTTP client: https://api.anyplot.ai/specs/arc-basic/chartjs/code. Any spec id and library id listed in llms-full.txt fit the same URL shape; every URL below is complete and callable.
{
  "spec_id": "arc-basic",
  "language": "javascript",
  "library": "chartjs",
  "page": "https://anyplot.ai/arc-basic/javascript/chartjs",
  "hub": "https://anyplot.ai/arc-basic",
  "code_json": "https://api.anyplot.ai/specs/arc-basic/chartjs/code",
  "spec_json": "https://api.anyplot.ai/specs/arc-basic",
  "render_light_png": "https://storage.googleapis.com/anyplot-images/plots/arc-basic/javascript/chartjs/plot-light.png",
  "render_dark_png": "https://storage.googleapis.com/anyplot-images/plots/arc-basic/javascript/chartjs/plot-dark.png",
  "interactive_light_html": "https://storage.googleapis.com/anyplot-images/plots/arc-basic/javascript/chartjs/plot-light.html",
  "interactive_dark_html": "https://storage.googleapis.com/anyplot-images/plots/arc-basic/javascript/chartjs/plot-dark.html",
  "quality_score": 92.0,
  "license": "MIT",
  "guide": "https://anyplot.ai/llms.txt"
}
Part of Basic Arc Diagram on anyplot.ai.