The same plot in 14 other libraries — JavaScript: Chart.js, D3.js, Apache ECharts, Highcharts; Python: Altair, Bokeh, lets-plot, Matplotlib, Plotly, plotnine, Pygal, Seaborn; R: ggplot2; Julia: Makie.jl. Compare all 15 side by side: Basic Arc Diagram in Python, R, Julia and JavaScript.
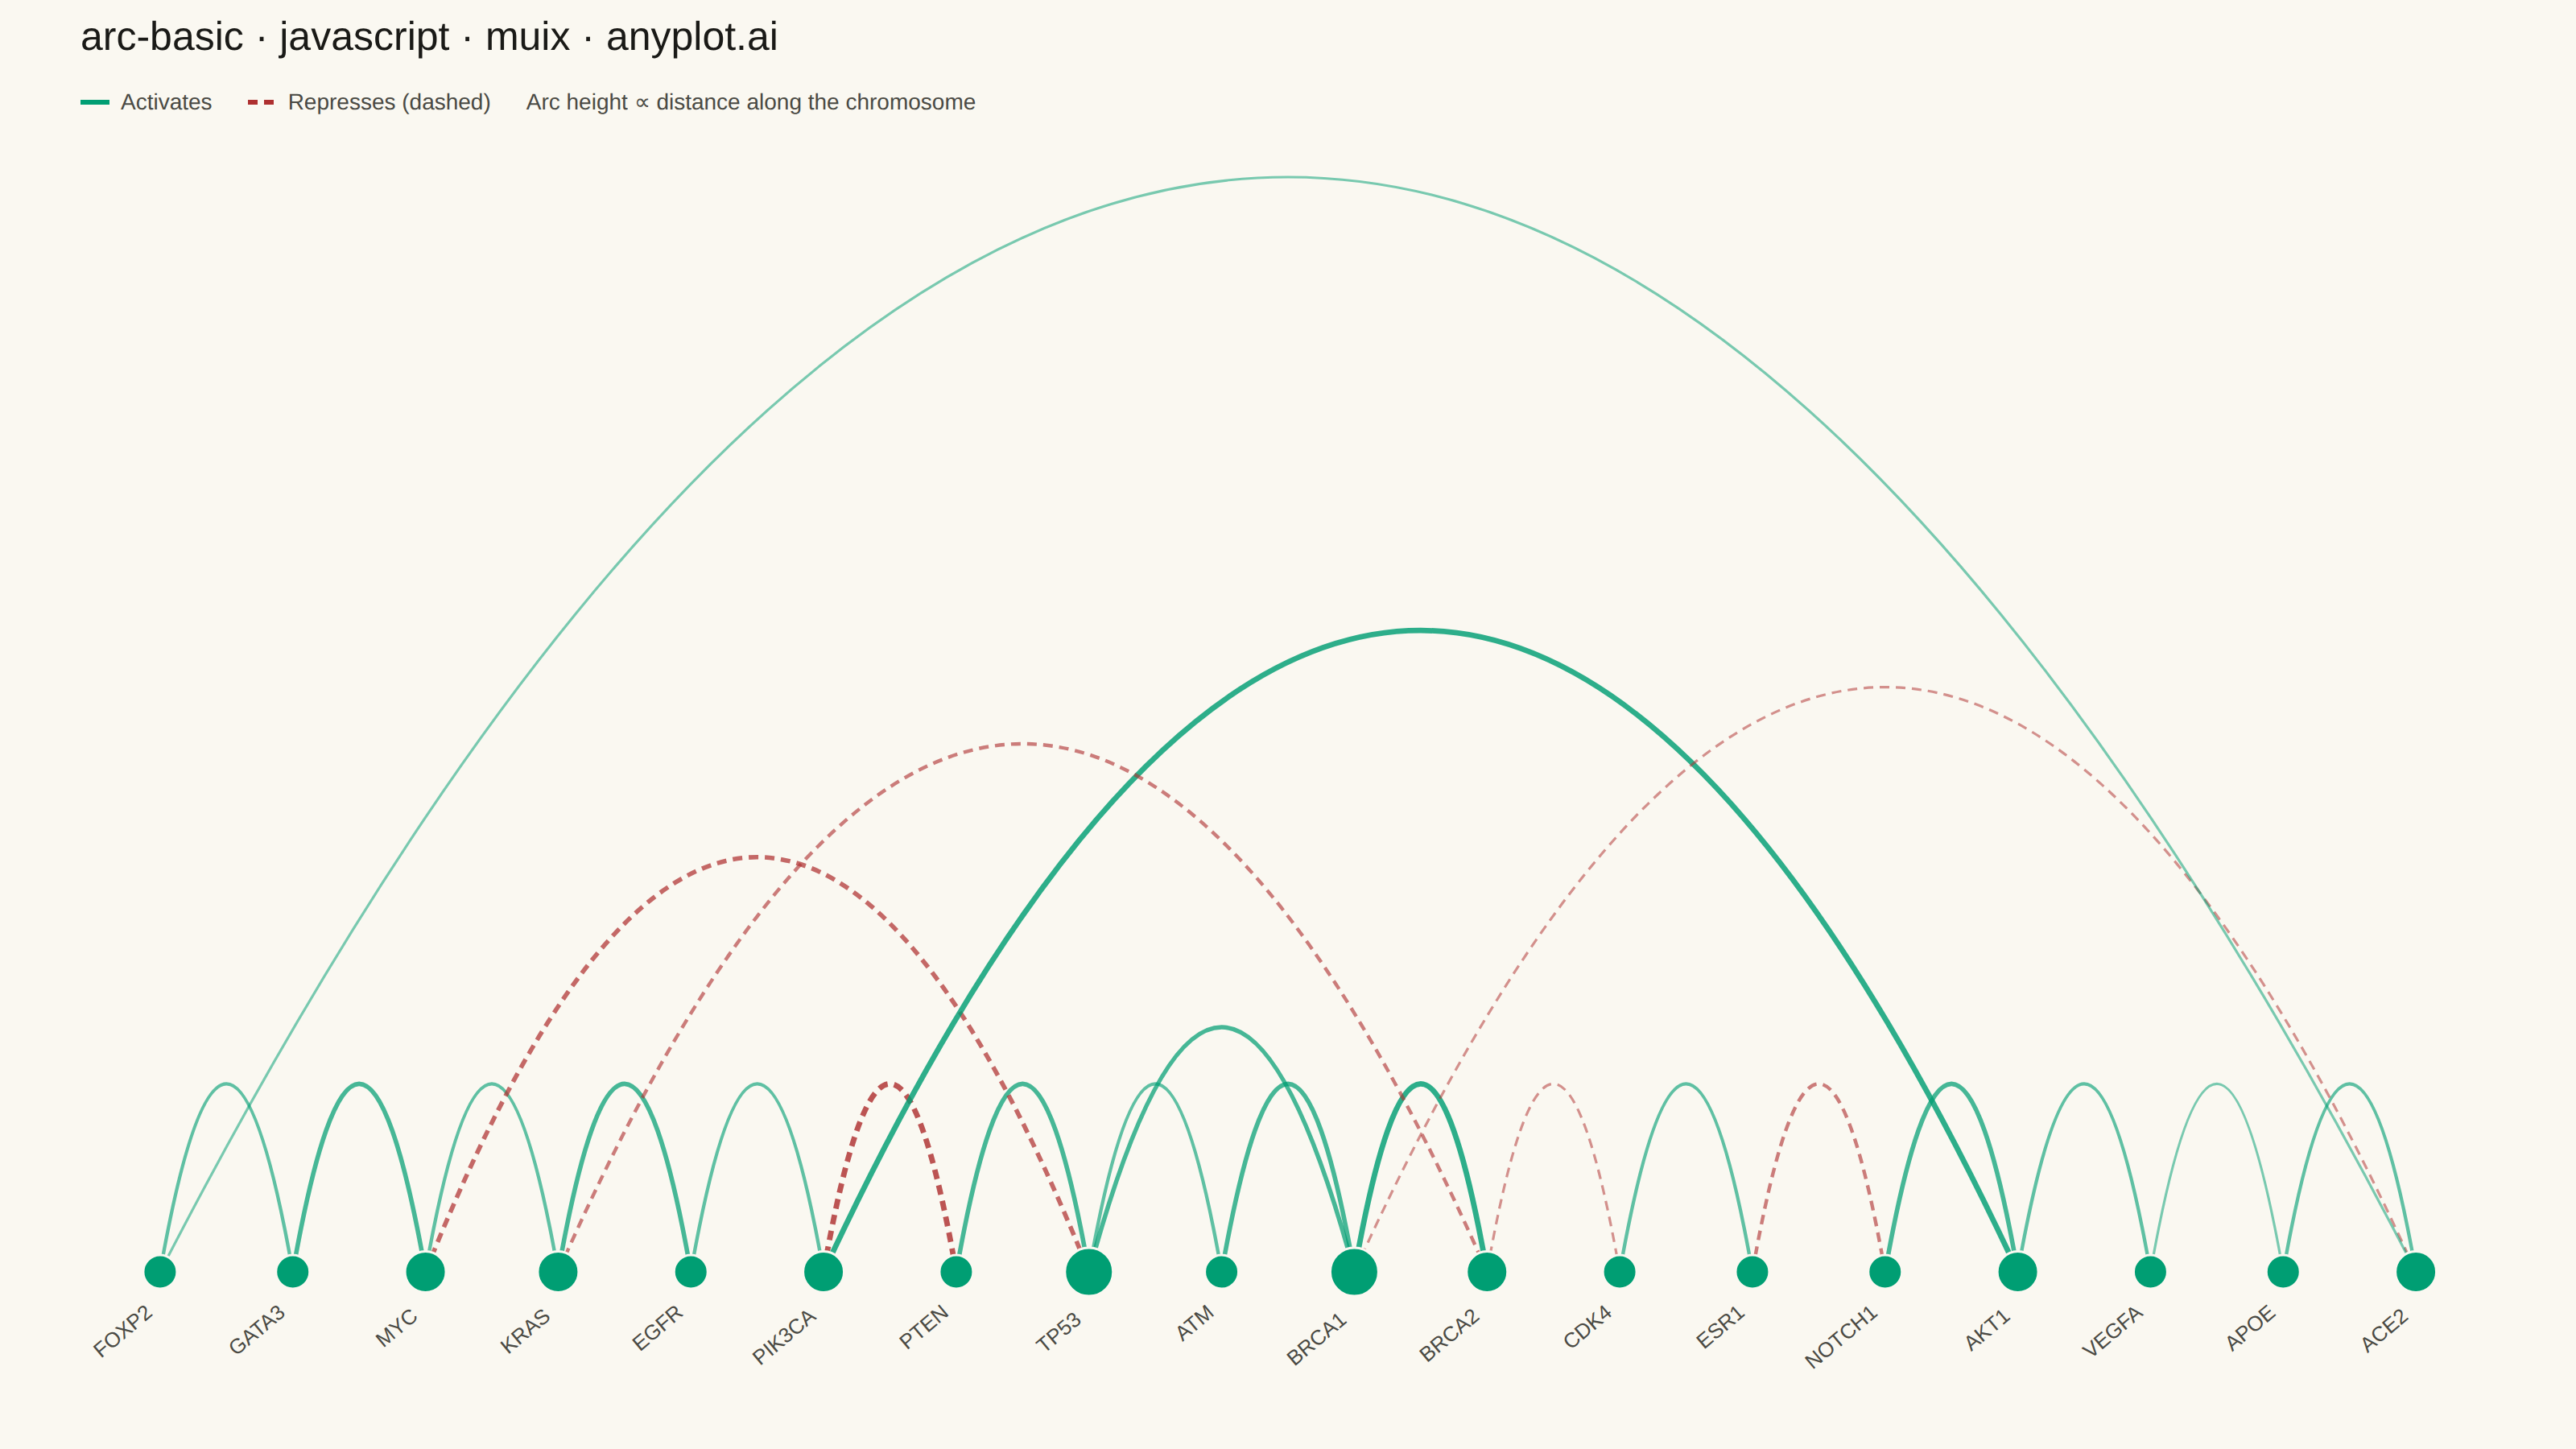
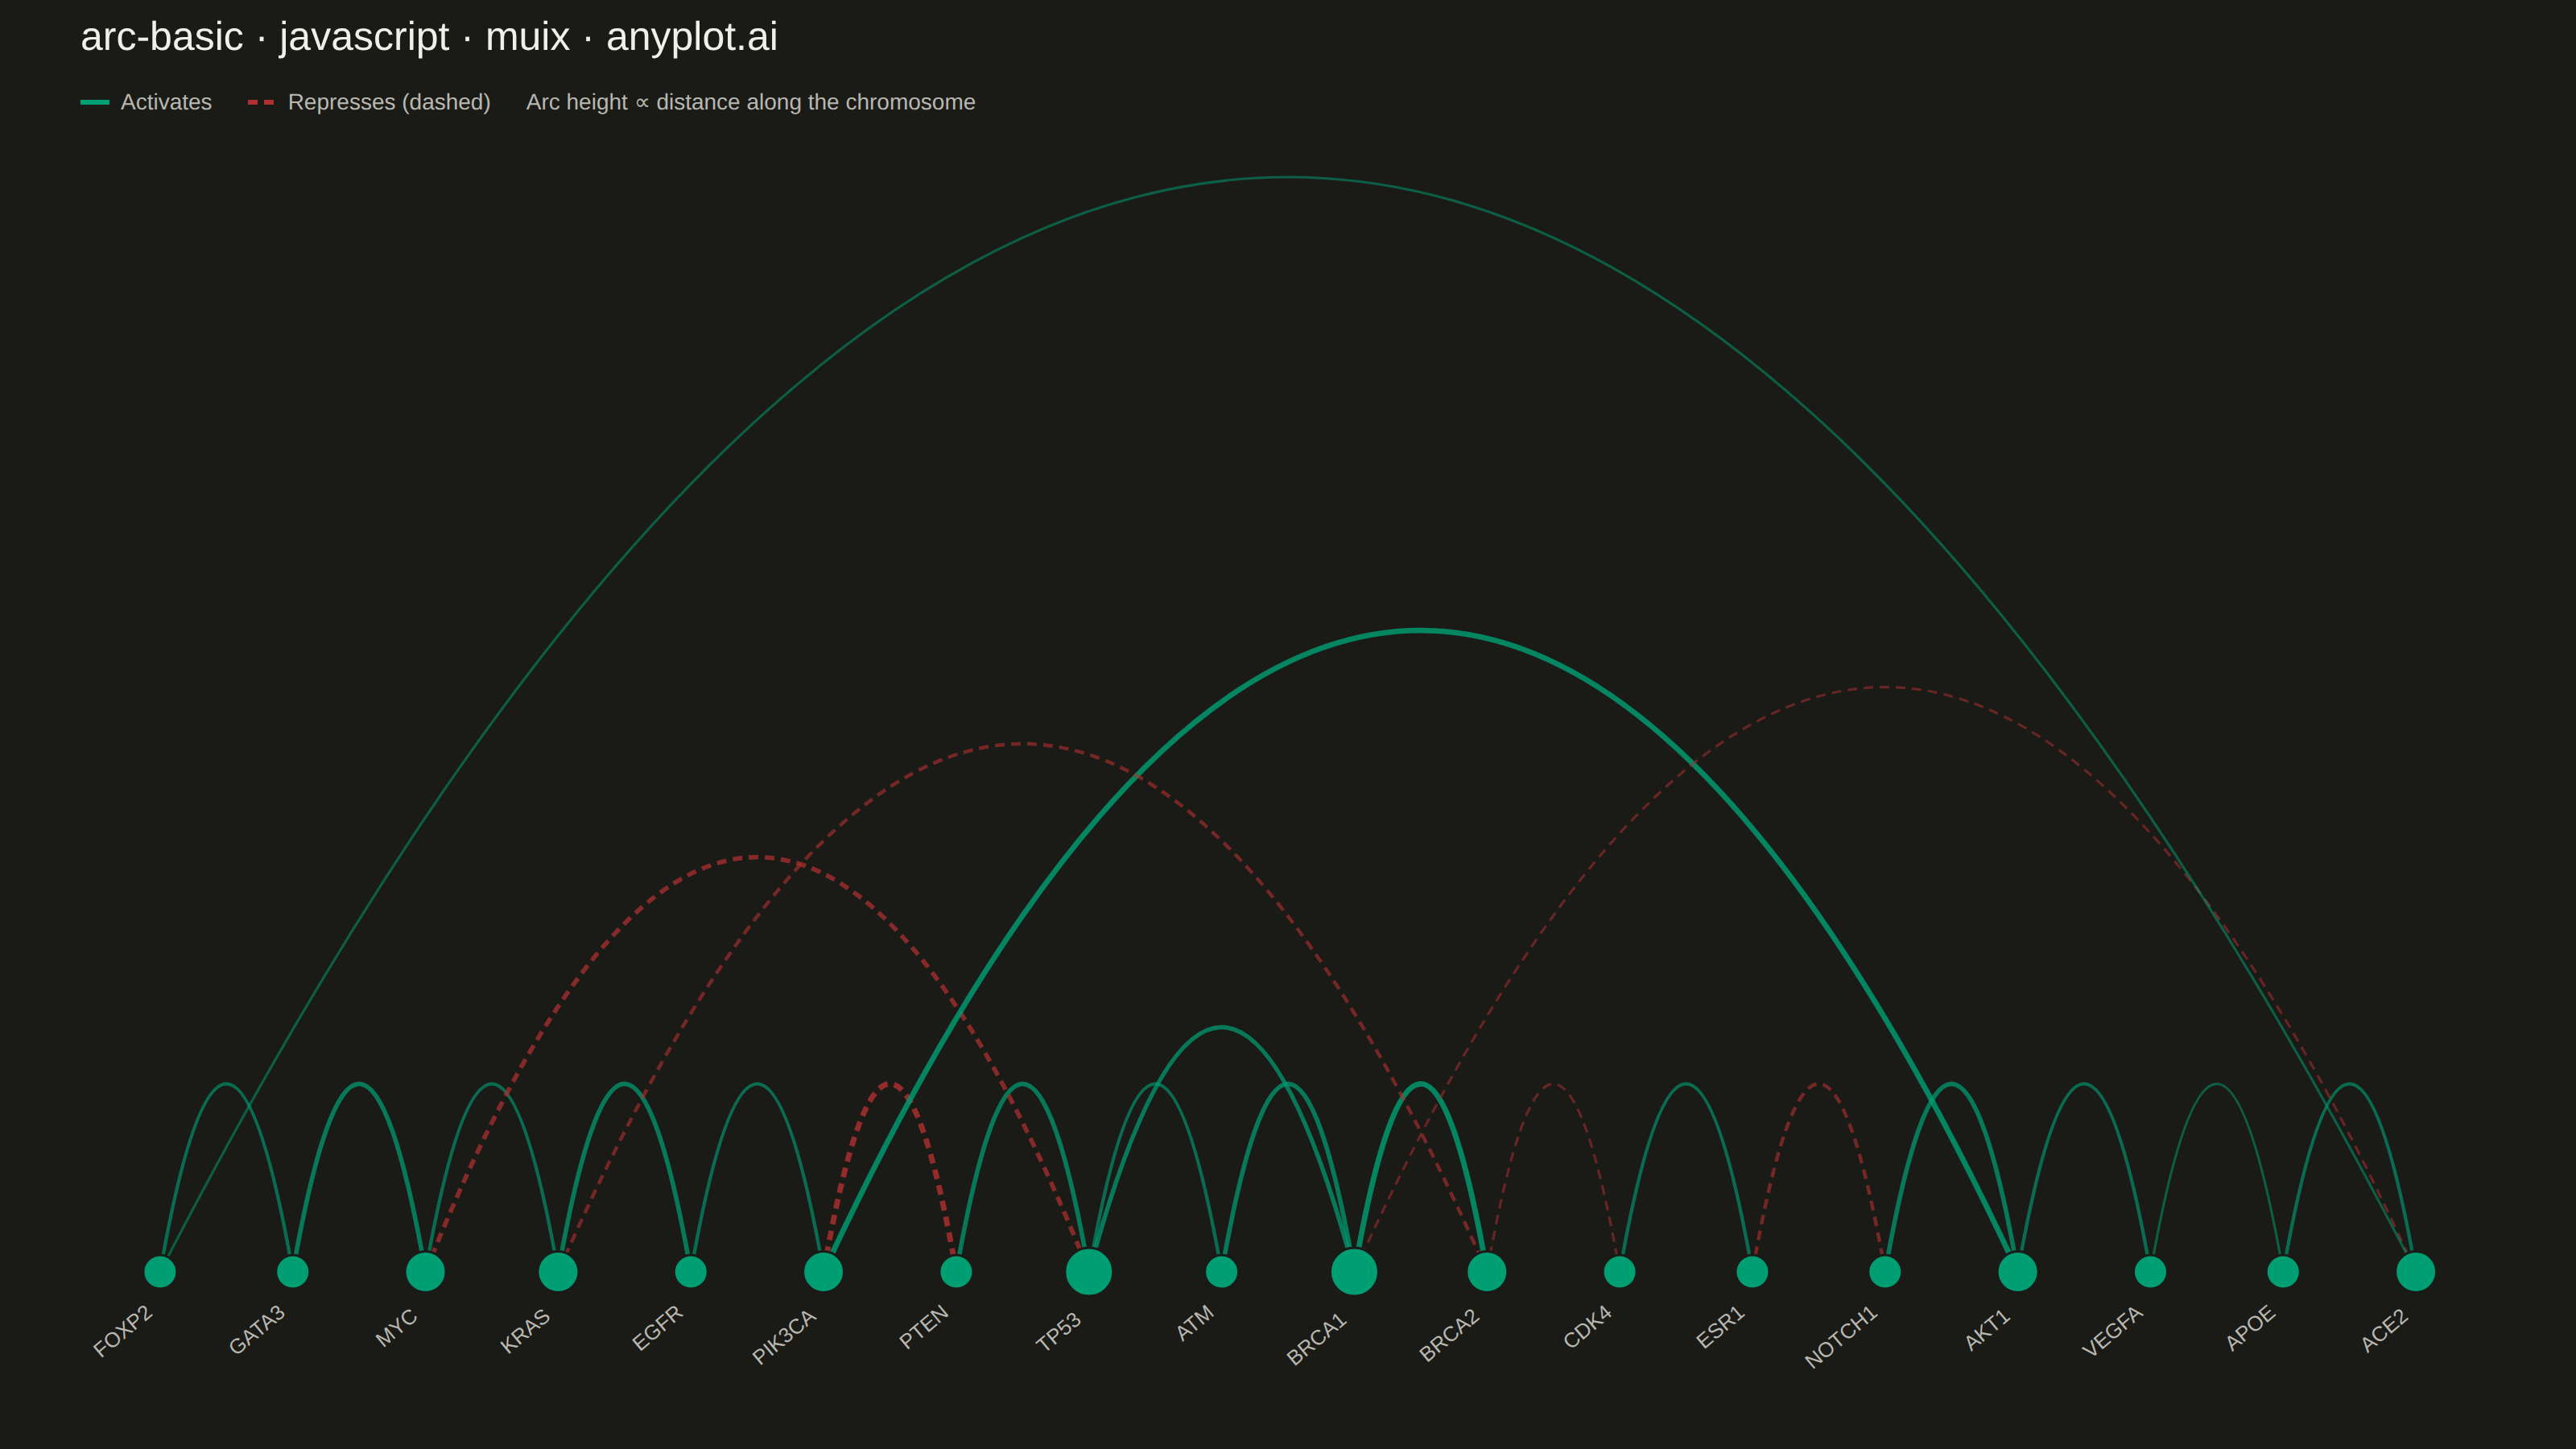
An arc diagram arranges nodes along a single horizontal line and draws connections between them as curved arcs above the line. This layout excels at revealing patterns in sequential or ordered data while minimizing visual clutter compared to force-directed layouts. Arc height typically indicates the distance between connected nodes, making it easy to spot long-range versus short-range connections.
// anyplot.ai
// arc-basic: Basic Arc Diagram
// Library: muix 7.29.1 | JavaScript 22.23.2
// Quality: 93/100 | Created: 2026-08-24
import * as React from "react";
import { ChartContainer } from "@mui/x-charts/ChartContainer";
import { useXScale, useYScale } from "@mui/x-charts/hooks";

const t = window.ANYPLOT_TOKENS;

// --- Data: synthetic gene regulatory network along a chromosome ------------
// Genes are ordered by their (illustrative) position along the chromosome —
// the axis an arc diagram is built to read. Each edge is a regulatory
// interaction: "activate" (up-regulates the target) or "repress"
// (down-regulates it), with a strength in [1, 4].
const GENES = [
  "FOXP2",
  "GATA3",
  "MYC",
  "KRAS",
  "EGFR",
  "PIK3CA",
  "PTEN",
  "TP53",
  "ATM",
  "BRCA1",
  "BRCA2",
  "CDK4",
  "ESR1",
  "NOTCH1",
  "AKT1",
  "VEGFA",
  "APOE",
  "ACE2",
];

// [sourceIndex, targetIndex, strength, kind]
const INTERACTIONS = [
  [0, 1, 2, "activate"],
  [1, 2, 3, "activate"],
  [2, 3, 2, "activate"],
  [3, 4, 3, "activate"],
  [4, 5, 2, "activate"],
  [5, 6, 4, "repress"],
  [6, 7, 3, "activate"],
  [7, 8, 2, "activate"],
  [8, 9, 3, "activate"],
  [9, 10, 4, "activate"],
  [10, 11, 1, "repress"],
  [11, 12, 2, "activate"],
  [12, 13, 2, "repress"],
  [13, 14, 3, "activate"],
  [14, 15, 2, "activate"],
  [15, 16, 1, "activate"],
  [16, 17, 2, "activate"],
  [2, 7, 3, "repress"],
  [5, 14, 4, "activate"],
  [7, 9, 3, "activate"],
  [9, 17, 1, "repress"],
  [0, 17, 1, "activate"],
  [3, 10, 2, "repress"],
];

const degree = new Array(GENES.length).fill(0);
INTERACTIONS.forEach(([a, b]) => {
  degree[a] += 1;
  degree[b] += 1;
});
const maxDegree = Math.max(...degree);
const nodeRadius = (i) => 6 + (degree[i] / maxDegree) * 9;

const maxDistance = GENES.length - 1;
// Arc "height" (normalized 0..1) grows with node distance — the reading a
// basic arc diagram is built around — with a floor so adjacent-gene edges
// stay visible above the baseline.
const archHeight = (dist) => 0.12 + 0.88 * (dist / maxDistance);

// Up-regulation (activate) reads as "gain", down-regulation (repress) as
// "loss" — the same green/red convention as a P&L chart, so brand green
// stays the mandatory first series and matte-red is the deferred semantic
// anchor for the negative case (see default-style-guide "Semantic exception").
const kindColor = (kind) => (kind === "activate" ? t.palette[0] : t.palette[4]);

// --- Custom SVG layers, positioned via the chart's own scales --------------
function ArcEdges() {
  const xScale = useXScale();
  const yScale = useYScale();
  const baselineY = yScale(0);
  return (
    <g data-drawing-container>
      {INTERACTIONS.map(([a, b, strength, kind], i) => {
        const x1 = xScale(a);
        const x2 = xScale(b);
        // A quadratic bezier's apex sits at the *midpoint* between the
        // baseline and the control point (both endpoints are level), so the
        // control point must overshoot by 2x for the rendered apex to land
        // exactly at yScale(archHeight).
        const controlY = baselineY - 2 * (baselineY - yScale(archHeight(Math.abs(b - a))));
        return (
          <path
            key={`edge-${i}`}
            d={`M ${x1} ${baselineY} Q ${(x1 + x2) / 2} ${controlY} ${x2} ${baselineY}`}
            fill="none"
            stroke={kindColor(kind)}
            strokeWidth={1 + strength * 0.6}
            strokeOpacity={0.42 + strength * 0.1}
            strokeDasharray={kind === "repress" ? "6 4" : undefined}
          />
        );
      })}
    </g>
  );
}

function ArcNodes() {
  const xScale = useXScale();
  const yScale = useYScale();
  const baselineY = yScale(0);
  return (
    <g data-drawing-container>
      {GENES.map((name, i) => {
        const x = xScale(i);
        return (
          <React.Fragment key={name}>
            <circle cx={x} cy={baselineY} r={nodeRadius(i)} fill={t.palette[0]} stroke={t.pageBg} strokeWidth={1.5} />
            <text
              x={x - 4}
              y={baselineY + nodeRadius(i) + 16}
              textAnchor="end"
              fontSize={13}
              fill={t.inkSoft}
              transform={`rotate(-40 ${x - 4} ${baselineY + nodeRadius(i) + 16})`}
            >
              {name}
            </text>
          </React.Fragment>
        );
      })}
    </g>
  );
}

// --- Title + legend chrome ---------------------------------------------------
const TITLE = "arc-basic · javascript · muix · anyplot.ai";
const TITLE_FONT_DEFAULT = 25;
const titleFontSize =
  TITLE.length > 67 ? Math.round(TITLE_FONT_DEFAULT * (67 / TITLE.length)) : TITLE_FONT_DEFAULT;
const TITLE_H = 46;
const LEGEND_H = 34;

function Legend() {
  return (
    <div style={{ height: LEGEND_H, display: "flex", alignItems: "center", gap: "22px", flexWrap: "wrap" }}>
      <div style={{ display: "flex", alignItems: "center", gap: "7px" }}>
        <span style={{ width: "18px", height: "3px", backgroundColor: t.palette[0], display: "inline-block" }} />
        <span style={{ fontSize: "14px", color: t.inkSoft }}>Activates</span>
      </div>
      <div style={{ display: "flex", alignItems: "center", gap: "7px" }}>
        <svg width="18" height="3" style={{ display: "inline-block" }}>
          <line x1="0" y1="1.5" x2="18" y2="1.5" stroke={t.palette[4]} strokeWidth="3" strokeDasharray="6 4" />
        </svg>
        <span style={{ fontSize: "14px", color: t.inkSoft }}>Represses (dashed)</span>
      </div>
      <span style={{ fontSize: "14px", color: t.inkSoft }}>Arc height ∝ distance along the chromosome</span>
    </div>
  );
}

// --- Chart (default-exported component — the harness mounts it) ------------
export default function Chart() {
  const { width, height } = window.ANYPLOT_SIZE;
  const chartHeight = height - TITLE_H - LEGEND_H;

  return (
    <div style={{ width, height, display: "flex", flexDirection: "column" }}>
      <div style={{ paddingLeft: "50px" }}>
        <div
          style={{
            height: `${TITLE_H}px`,
            lineHeight: `${TITLE_H}px`,
            fontSize: `${titleFontSize}px`,
            fontWeight: 500,
            color: t.ink,
          }}
        >
          {TITLE}
        </div>
        <Legend />
      </div>
      <ChartContainer
        width={width}
        height={chartHeight}
        series={[]}
        margin={{ top: 30, bottom: 110, left: 50, right: 50 }}
        xAxis={[{ id: "x", scaleType: "linear", min: -0.6, max: GENES.length - 0.4 }]}
        yAxis={[{ id: "y", scaleType: "linear", min: 0, max: 1 }]}
        skipAnimation
      >
        <ArcEdges />
        <ArcNodes />
      </ChartContainer>
    </div>
  );
}
Runnable source as JSON, for any HTTP client: https://api.anyplot.ai/specs/arc-basic/muix/code. Any spec id and library id listed in llms-full.txt fit the same URL shape; every URL below is complete and callable.
{
  "spec_id": "arc-basic",
  "language": "javascript",
  "library": "muix",
  "page": "https://anyplot.ai/arc-basic/javascript/muix",
  "hub": "https://anyplot.ai/arc-basic",
  "code_json": "https://api.anyplot.ai/specs/arc-basic/muix/code",
  "spec_json": "https://api.anyplot.ai/specs/arc-basic",
  "render_light_png": "https://storage.googleapis.com/anyplot-images/plots/arc-basic/javascript/muix/plot-light.png",
  "render_dark_png": "https://storage.googleapis.com/anyplot-images/plots/arc-basic/javascript/muix/plot-dark.png",
  "interactive_light_html": "https://storage.googleapis.com/anyplot-images/plots/arc-basic/javascript/muix/plot-light.html",
  "interactive_dark_html": "https://storage.googleapis.com/anyplot-images/plots/arc-basic/javascript/muix/plot-dark.html",
  "quality_score": 93.0,
  "license": "MIT",
  "guide": "https://anyplot.ai/llms.txt"
}
Part of Basic Arc Diagram on anyplot.ai.