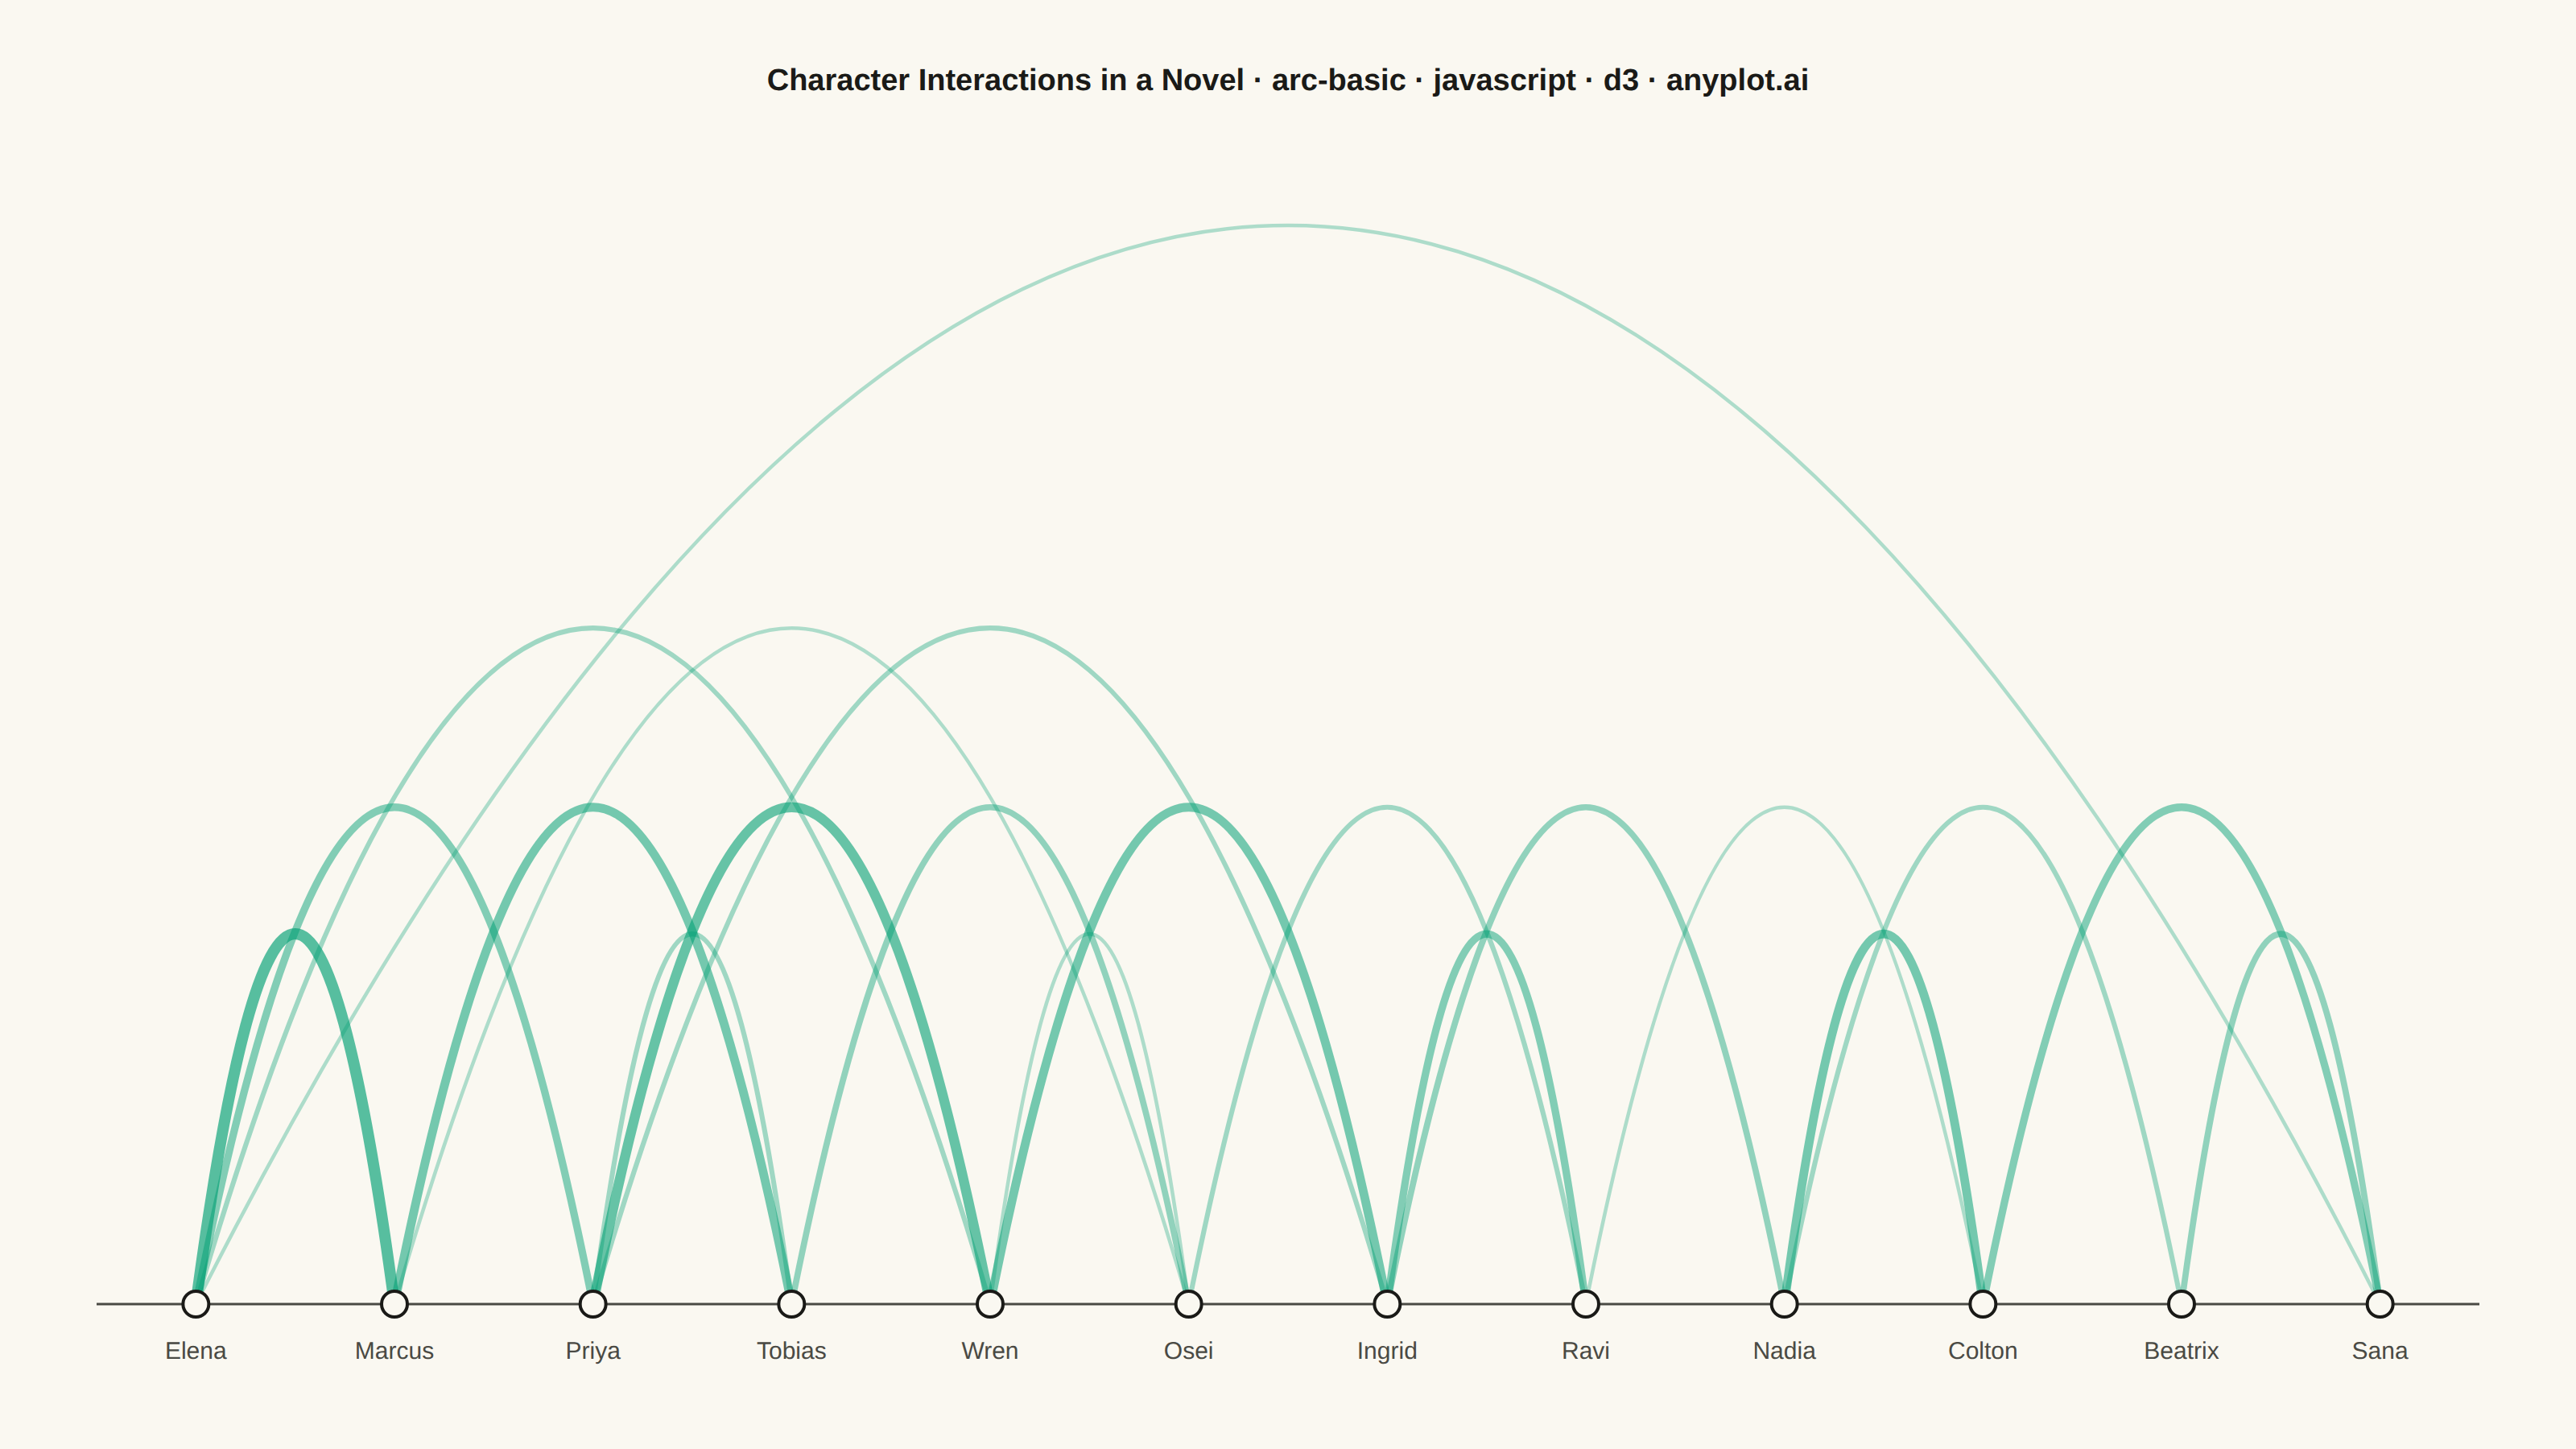
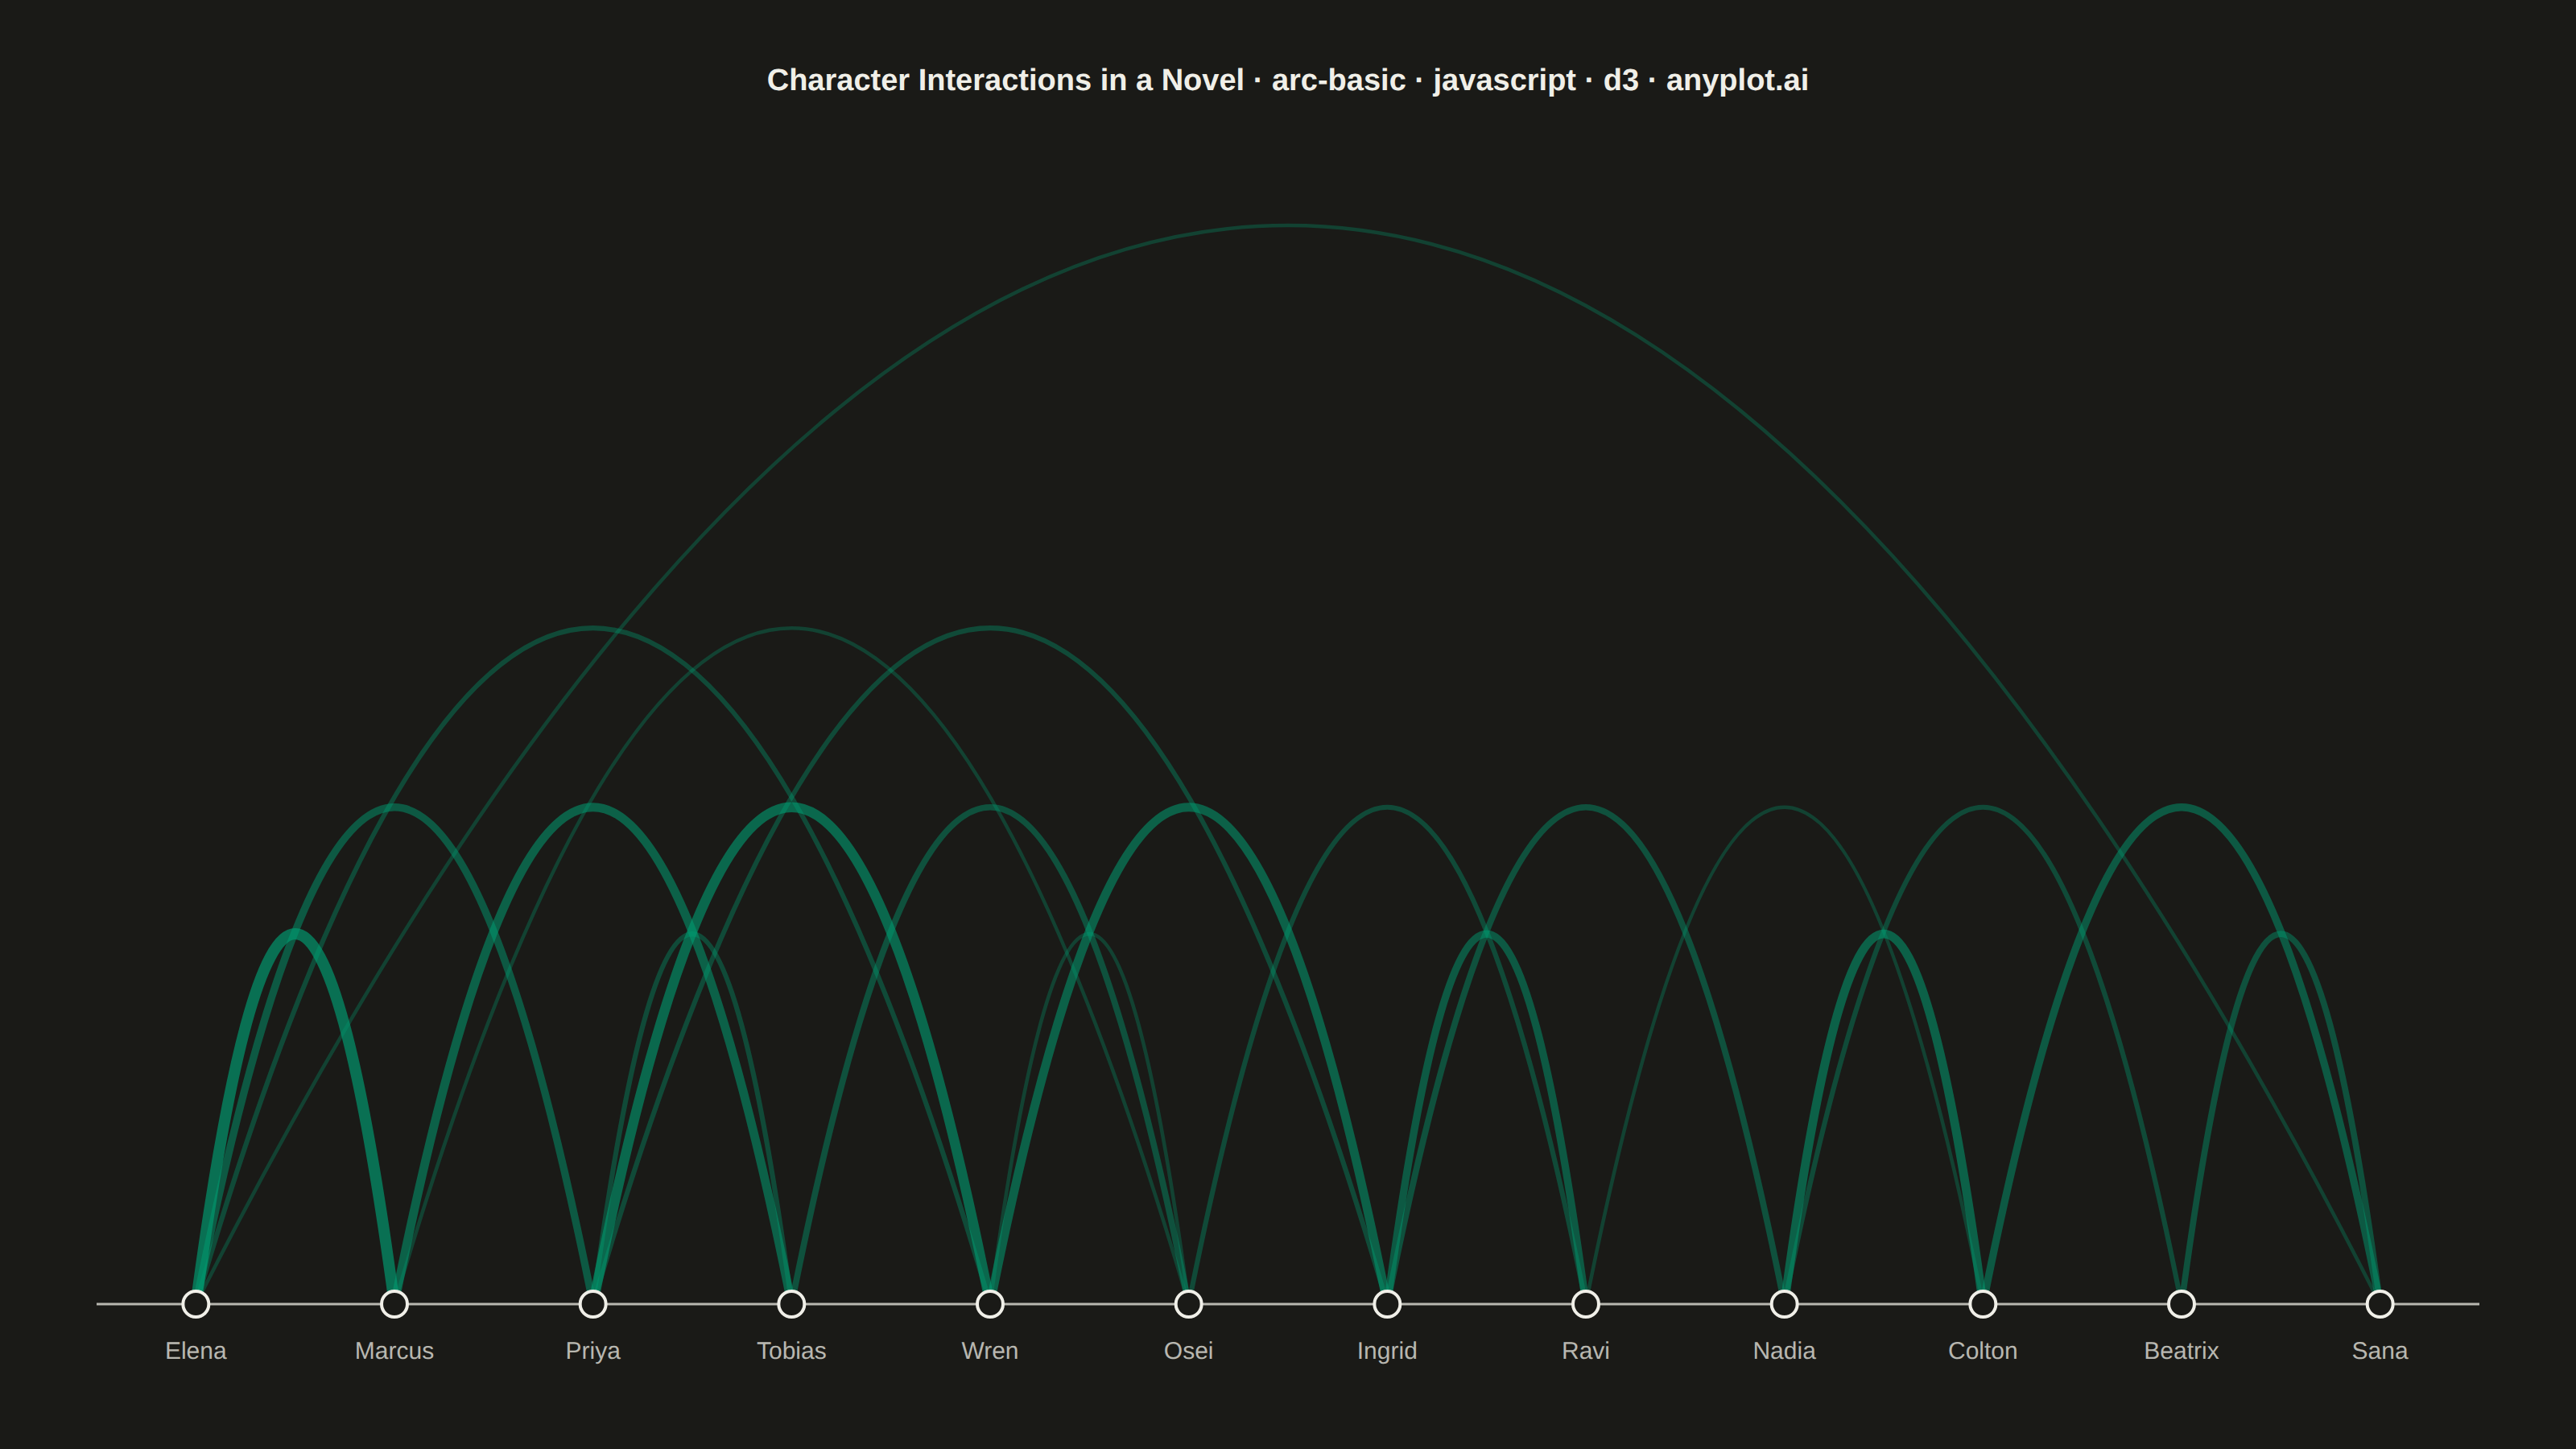
The same plot in 14 other libraries — JavaScript: Chart.js, Apache ECharts, Highcharts, MUI X Charts; Python: Altair, Bokeh, lets-plot, Matplotlib, Plotly, plotnine, Pygal, Seaborn; R: ggplot2; Julia: Makie.jl. Compare all 15 side by side: Basic Arc Diagram in Python, R, Julia and JavaScript.
An arc diagram arranges nodes along a single horizontal line and draws connections between them as curved arcs above the line. This layout excels at revealing patterns in sequential or ordered data while minimizing visual clutter compared to force-directed layouts. Arc height typically indicates the distance between connected nodes, making it easy to spot long-range versus short-range connections.
// anyplot.ai
// arc-basic: Basic Arc Diagram
// Library: d3 7.9.0 | JavaScript 22.23.2
// Quality: 91/100 | Created: 2026-08-24

const t = window.ANYPLOT_TOKENS;
const { width, height } = window.ANYPLOT_SIZE;
const margin = { top: 100, right: 60, bottom: 90, left: 60 };
const iw = width - margin.left - margin.right;

// --- Data (in-memory, deterministic) ----------------------------------------
// Character interactions across chapters of a novel, in order of first appearance.
const characters = [
  "Elena",
  "Marcus",
  "Priya",
  "Tobias",
  "Wren",
  "Osei",
  "Ingrid",
  "Ravi",
  "Nadia",
  "Colton",
  "Beatrix",
  "Sana",
];

const interactions = [
  { source: "Elena", target: "Marcus", weight: 8 },
  { source: "Elena", target: "Priya", weight: 5 },
  { source: "Marcus", target: "Tobias", weight: 6 },
  { source: "Priya", target: "Tobias", weight: 3 },
  { source: "Priya", target: "Wren", weight: 7 },
  { source: "Tobias", target: "Osei", weight: 4 },
  { source: "Wren", target: "Osei", weight: 2 },
  { source: "Wren", target: "Ingrid", weight: 6 },
  { source: "Osei", target: "Ravi", weight: 3 },
  { source: "Ingrid", target: "Ravi", weight: 5 },
  { source: "Ingrid", target: "Nadia", weight: 4 },
  { source: "Ravi", target: "Colton", weight: 2 },
  { source: "Nadia", target: "Colton", weight: 6 },
  { source: "Nadia", target: "Beatrix", weight: 3 },
  { source: "Colton", target: "Sana", weight: 5 },
  { source: "Beatrix", target: "Sana", weight: 4 },
  { source: "Elena", target: "Wren", weight: 3 },
  { source: "Marcus", target: "Osei", weight: 2 },
  { source: "Elena", target: "Sana", weight: 2 },
  { source: "Priya", target: "Ingrid", weight: 3 },
];

// --- SVG mount ----------------------------------------------------------------
const svg = d3.select("#container").append("svg").attr("width", width).attr("height", height);

const axisY = height - margin.bottom;
const x = d3.scalePoint().domain(characters).range([0, iw]).padding(0.5);

const maxWeight = d3.max(interactions, (d) => d.weight);
const strokeWidth = d3.scaleLinear().domain([1, maxWeight]).range([1.5, 7]);
const opacity = d3.scaleLinear().domain([1, maxWeight]).range([0.25, 0.65]);

// Arc height scales with node distance (long-range connections arc higher).
// scaleSqrt (not linear) so the single far-outlier span (Elena-Sana) doesn't
// dominate the domain and compress the other 19 arcs into a thin band -
// ordering is preserved (the long-range arc still reads as tallest) while the
// short/medium arcs fill much more of the available canvas height.
const maxSpan = d3.max(interactions, (d) => Math.abs(x(d.source) - x(d.target)));
const arcHeight = d3.scaleSqrt().domain([0, maxSpan]).range([40, axisY - margin.top - 40]);

const g = svg.append("g").attr("transform", `translate(${margin.left},0)`);

// --- Arcs -----------------------------------------------------------------
g.selectAll("path")
  .data(interactions)
  .join("path")
  .attr("d", (d) => {
    const x1 = x(d.source);
    const x2 = x(d.target);
    const xm = (x1 + x2) / 2;
    const h = arcHeight(Math.abs(x1 - x2));
    return `M ${x1} ${axisY} Q ${xm} ${axisY - h * 2} ${x2} ${axisY}`;
  })
  .attr("fill", "none")
  .attr("stroke", t.palette[0])
  .attr("stroke-width", (d) => strokeWidth(d.weight))
  .attr("stroke-opacity", (d) => opacity(d.weight))
  .attr("stroke-linecap", "round");

// --- Baseline ---------------------------------------------------------------
g.append("line")
  .attr("x1", 0)
  .attr("x2", iw)
  .attr("y1", axisY)
  .attr("y2", axisY)
  .attr("stroke", t.inkSoft)
  .attr("stroke-width", 1.5);

// --- Nodes --------------------------------------------------------------------
g.selectAll("circle")
  .data(characters)
  .join("circle")
  .attr("cx", (d) => x(d))
  .attr("cy", axisY)
  .attr("r", 8)
  .attr("fill", t.pageBg)
  .attr("stroke", t.ink)
  .attr("stroke-width", 2);

// --- Node labels ----------------------------------------------------------
g.selectAll("text.node-label")
  .data(characters)
  .join("text")
  .attr("class", "node-label")
  .attr("x", (d) => x(d))
  .attr("y", axisY + 34)
  .attr("text-anchor", "middle")
  .attr("fill", t.inkSoft)
  .style("font-size", "15px")
  .text((d) => d);

// --- Title ------------------------------------------------------------------
svg.append("text")
  .attr("x", width / 2)
  .attr("y", 56)
  .attr("text-anchor", "middle")
  .attr("fill", t.ink)
  .style("font-size", "19px") // scaled from 22px default: round(22 * 67/76), title is 76 chars
  .style("font-weight", "600")
  .text("Character Interactions in a Novel · arc-basic · javascript · d3 · anyplot.ai");
Runnable source as JSON, for any HTTP client: https://api.anyplot.ai/specs/arc-basic/d3/code. Any spec id and library id listed in llms-full.txt fit the same URL shape; every URL below is complete and callable.
{
  "spec_id": "arc-basic",
  "language": "javascript",
  "library": "d3",
  "page": "https://anyplot.ai/arc-basic/javascript/d3",
  "hub": "https://anyplot.ai/arc-basic",
  "code_json": "https://api.anyplot.ai/specs/arc-basic/d3/code",
  "spec_json": "https://api.anyplot.ai/specs/arc-basic",
  "render_light_png": "https://storage.googleapis.com/anyplot-images/plots/arc-basic/javascript/d3/plot-light.png",
  "render_dark_png": "https://storage.googleapis.com/anyplot-images/plots/arc-basic/javascript/d3/plot-dark.png",
  "interactive_light_html": "https://storage.googleapis.com/anyplot-images/plots/arc-basic/javascript/d3/plot-light.html",
  "interactive_dark_html": "https://storage.googleapis.com/anyplot-images/plots/arc-basic/javascript/d3/plot-dark.html",
  "quality_score": 91.0,
  "license": "MIT",
  "guide": "https://anyplot.ai/llms.txt"
}
Part of Basic Arc Diagram on anyplot.ai.