The same plot in 14 other libraries — JavaScript: Chart.js, D3.js, Highcharts, MUI X Charts; Python: Altair, Bokeh, lets-plot, Matplotlib, Plotly, plotnine, Pygal, Seaborn; R: ggplot2; Julia: Makie.jl. Compare all 15 side by side: Basic Arc Diagram in Python, R, Julia and JavaScript.
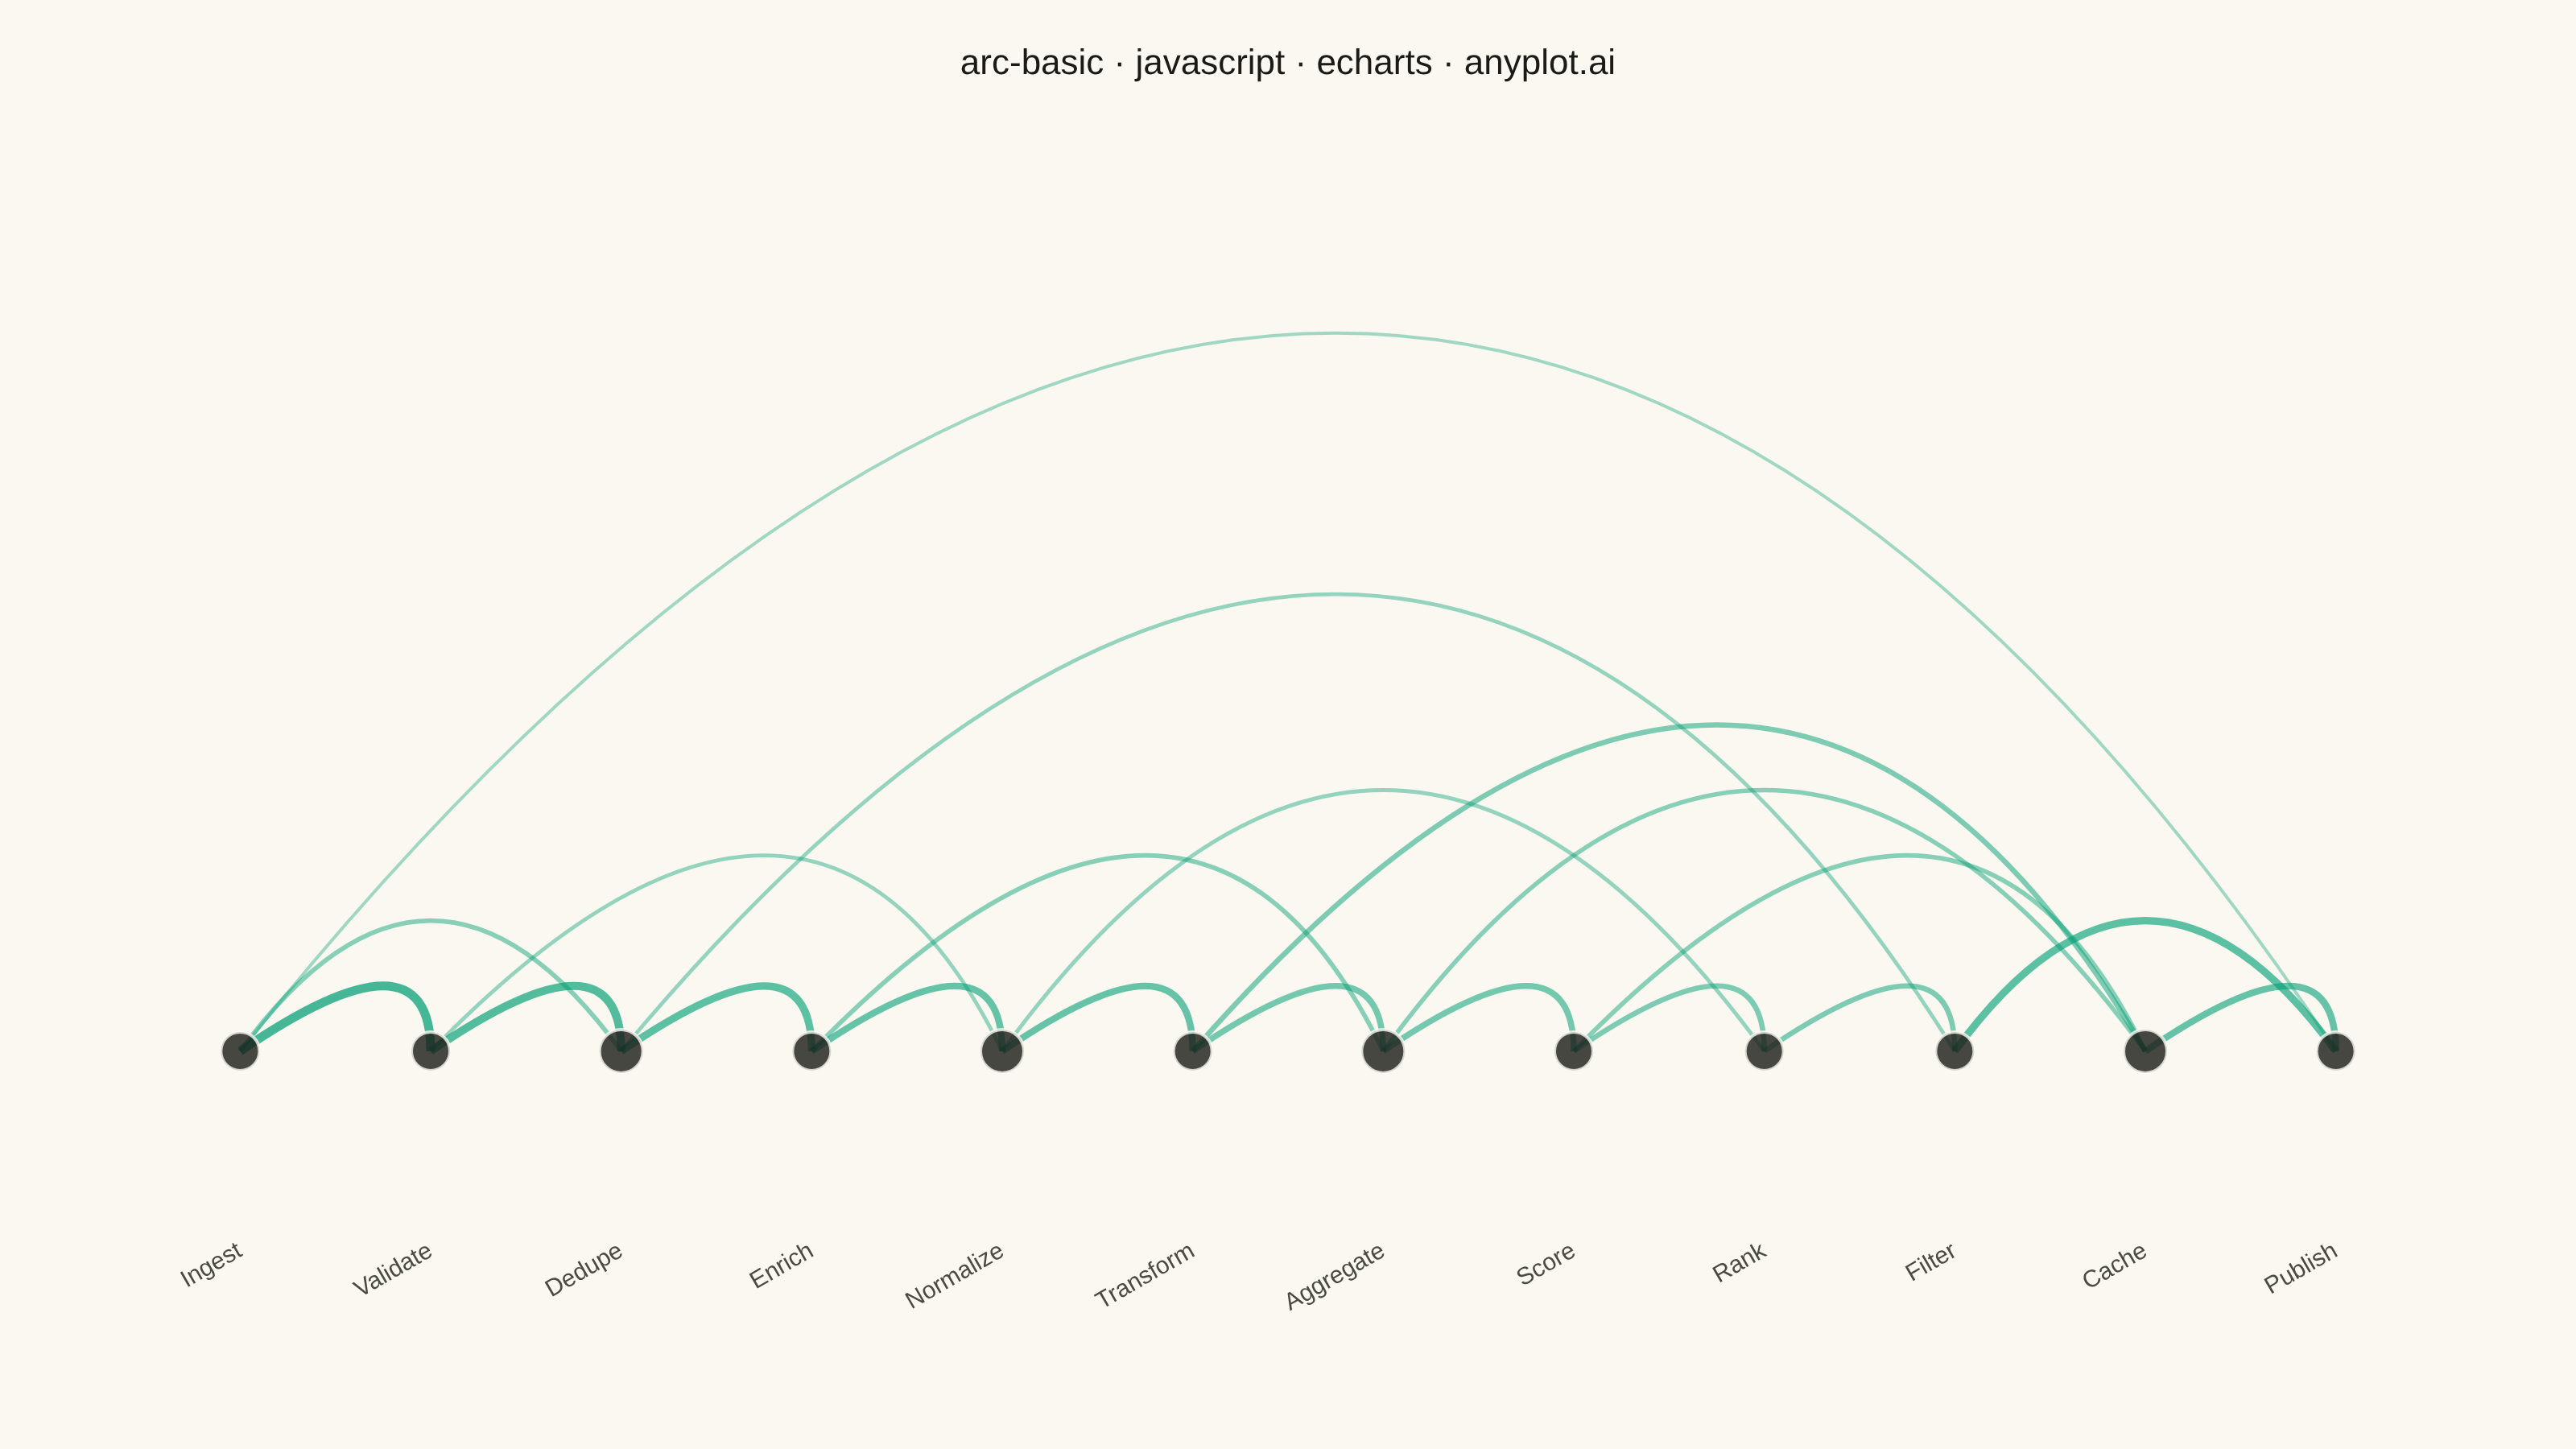
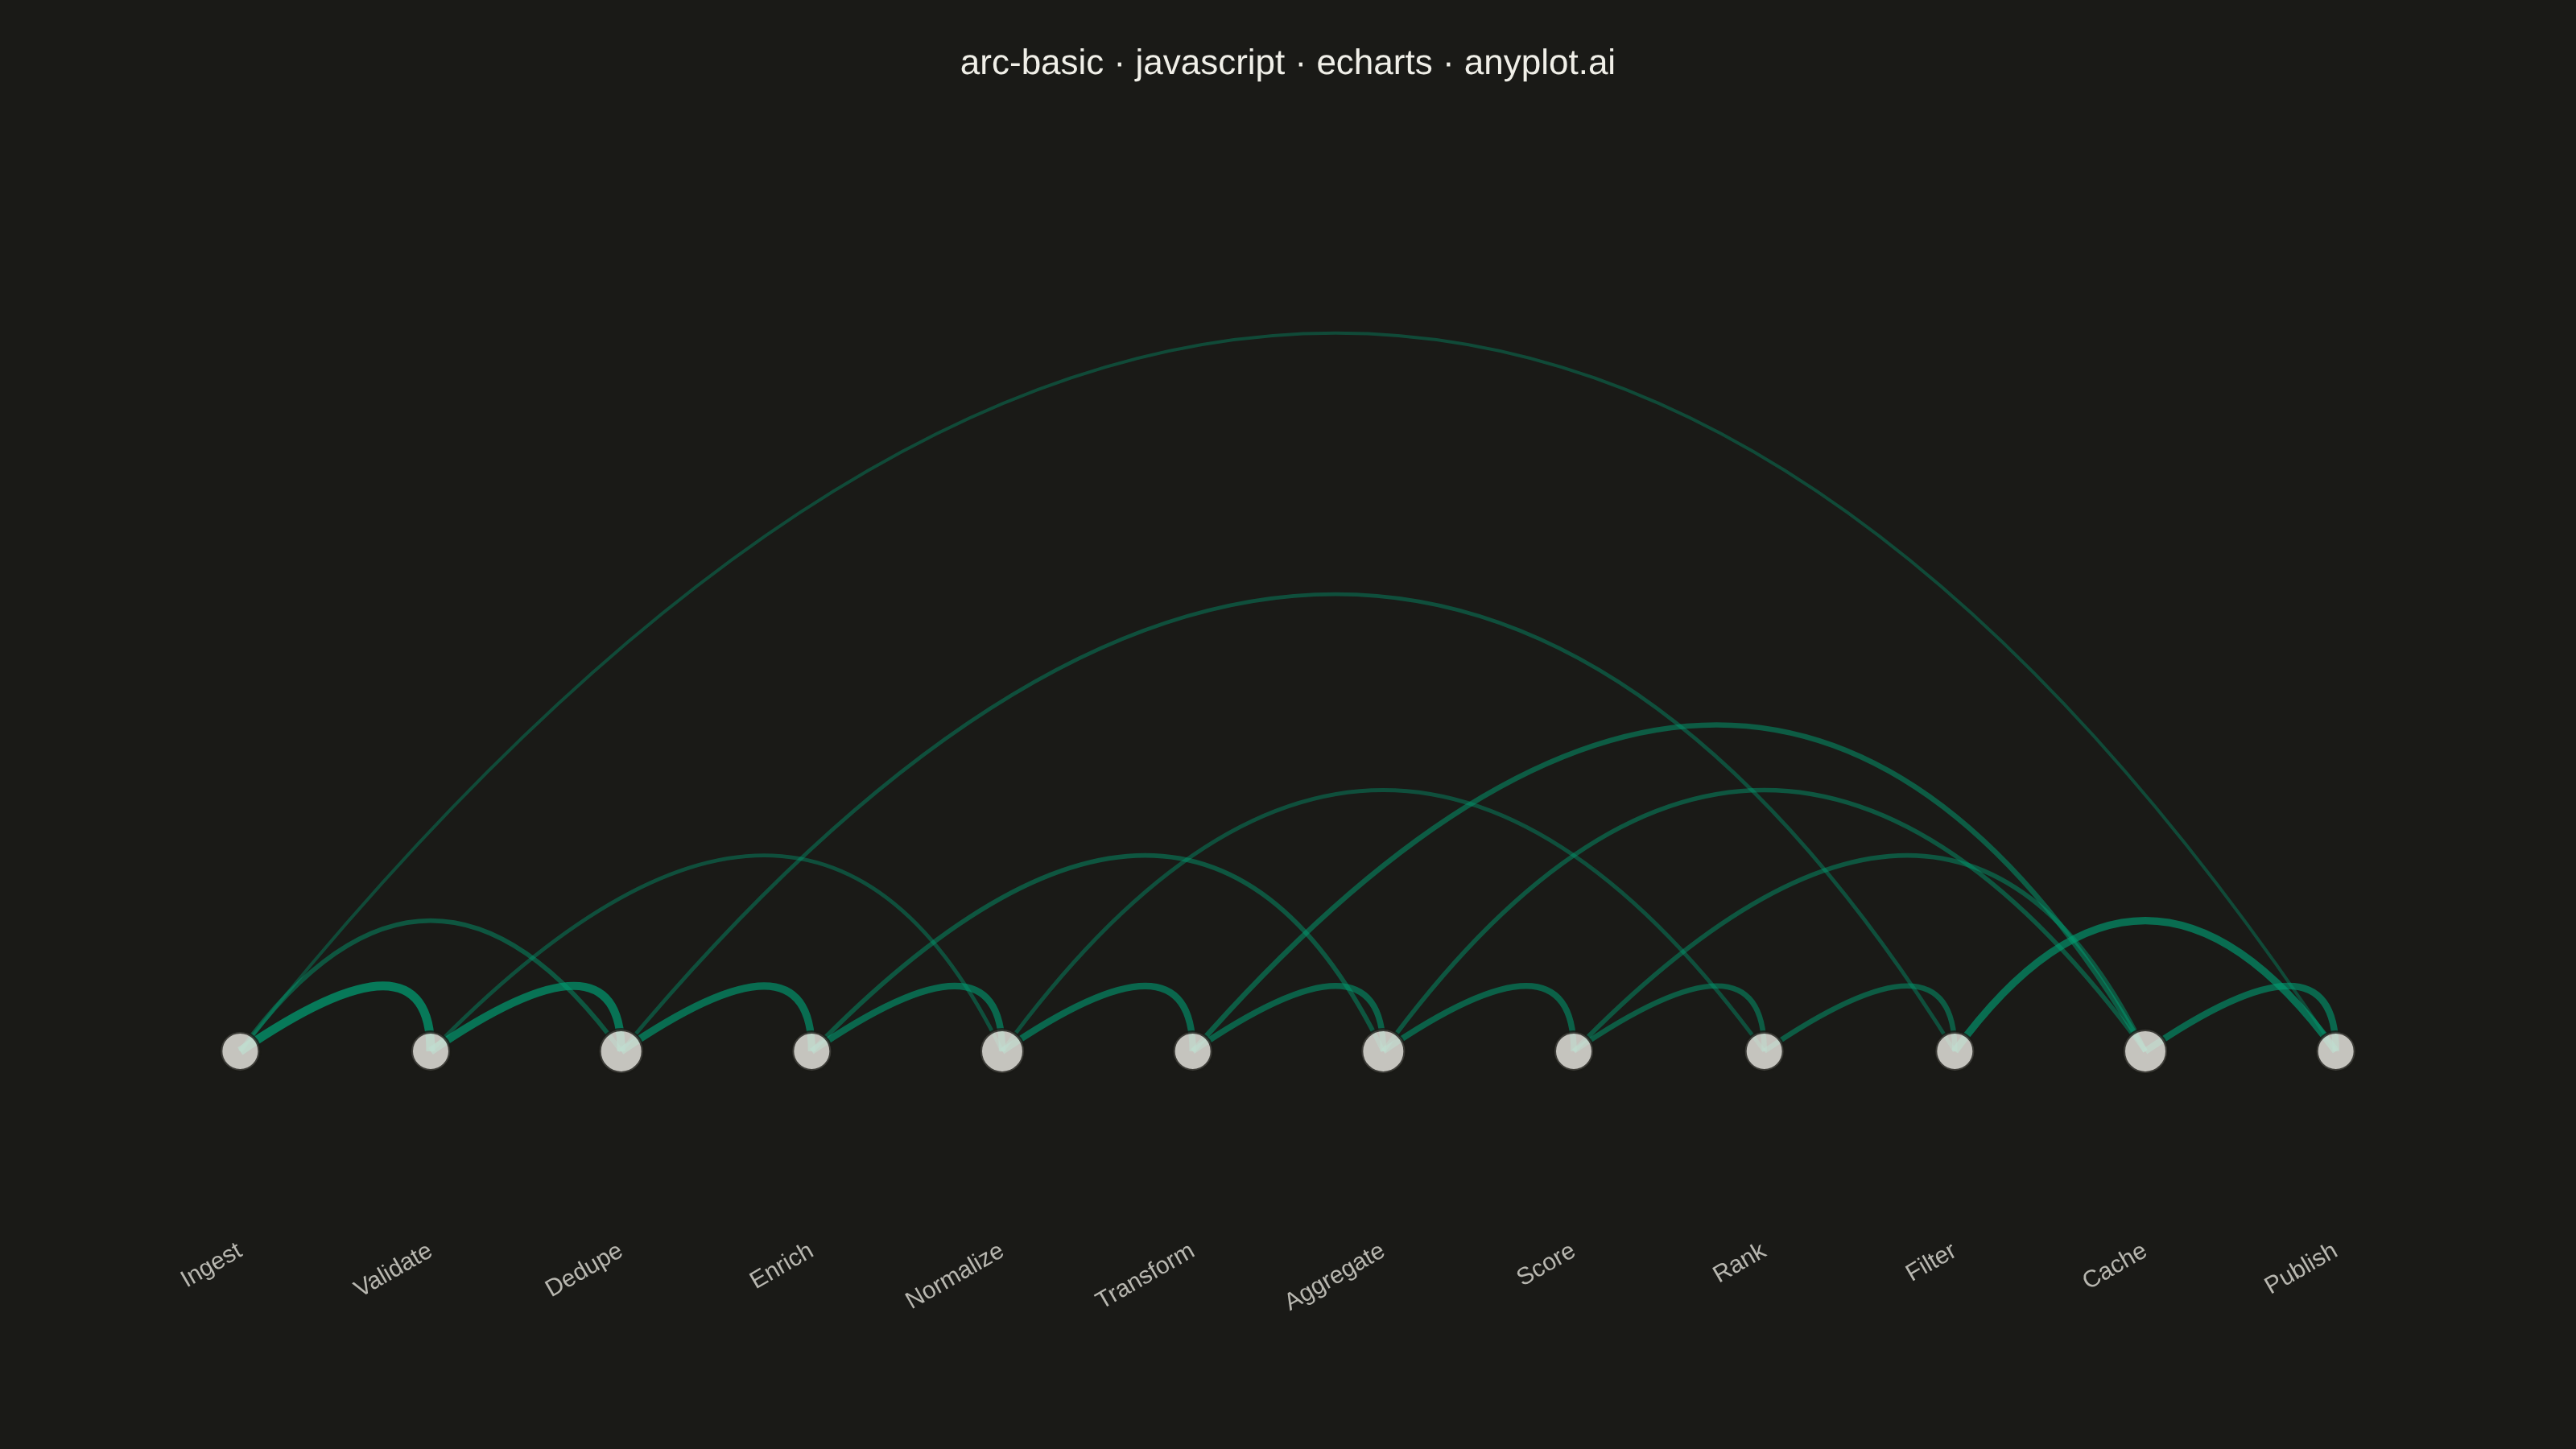
An arc diagram arranges nodes along a single horizontal line and draws connections between them as curved arcs above the line. This layout excels at revealing patterns in sequential or ordered data while minimizing visual clutter compared to force-directed layouts. Arc height typically indicates the distance between connected nodes, making it easy to spot long-range versus short-range connections.
// anyplot.ai
// arc-basic: Basic Arc Diagram
// Library: echarts 6.1.0 | JavaScript 22.23.2
// Quality: 93/100 | Created: 2026-08-24

const t = window.ANYPLOT_TOKENS;

// --- Data (in-memory, deterministic) ----------------------------------------
// Stages of a data pipeline, ordered by typical execution sequence
const stages = [
  "Ingest", "Validate", "Dedupe", "Enrich", "Normalize", "Transform",
  "Aggregate", "Score", "Rank", "Filter", "Cache", "Publish",
];

// [sourceIndex, targetIndex, weight] — weight ~ relative call frequency (1-9)
const dependencies = [
  [0, 1, 9], [1, 2, 8], [2, 3, 7], [3, 4, 6], [4, 5, 6], [5, 6, 5],
  [6, 7, 5], [7, 8, 4], [8, 9, 4], [9, 11, 7], [0, 2, 3], [1, 4, 2],
  [3, 6, 3], [5, 10, 4], [6, 10, 3], [10, 11, 6], [2, 9, 2], [0, 11, 1],
  [4, 8, 2], [7, 10, 3],
];

const degree = stages.map(
  (_, i) => dependencies.filter(([s, tgt]) => s === i || tgt === i).length,
);
const maxDistance = Math.max(...dependencies.map(([s, tgt]) => tgt - s));
// Lift nodes above y=0 so they clear the rotated axis-label row beneath them
const baseline = maxDistance * 0.12;

// --- Init --------------------------------------------------------------------
const chart = echarts.init(document.getElementById("container"));

// --- Option --------------------------------------------------------------------
chart.setOption({
  animation: false,
  backgroundColor: "transparent",
  title: {
    text: "arc-basic · javascript · echarts · anyplot.ai",
    left: "center",
    top: 24,
    textStyle: { color: t.ink, fontSize: 22, fontWeight: 500 },
  },
  grid: { left: 90, right: 90, top: 140, bottom: 140 },
  xAxis: {
    type: "category",
    data: stages,
    axisLabel: { color: t.inkSoft, fontSize: 15, rotate: 30, margin: 16 },
    axisLine: { show: false },
    axisTick: { show: false },
    splitLine: { show: false },
  },
  // The custom series draws a *quadratic* bezier (single control point), whose
  // rendered peak sits at the midpoint between baseline and control height —
  // peak = baseline + (targetIdx - sourceIdx) / 2, not the full control height.
  // Size the axis off that actual peak so the tallest arc reaches near the top.
  yAxis: {
    type: "value",
    min: 0,
    max: baseline + (maxDistance / 2) * 1.15,
    show: false,
  },
  series: [
    {
      type: "custom",
      coordinateSystem: "cartesian2d",
      silent: true,
      z: 2,
      data: dependencies,
      renderItem: (params, api) => {
        const sourceIdx = api.value(0);
        const targetIdx = api.value(1);
        const weight = api.value(2);
        const start = api.coord([sourceIdx, baseline]);
        const end = api.coord([targetIdx, baseline]);
        const control = api.coord([
          (sourceIdx + targetIdx) / 2,
          baseline + (targetIdx - sourceIdx),
        ]);
        return {
          type: "bezierCurve",
          shape: {
            x1: start[0], y1: start[1],
            x2: end[0], y2: end[1],
            cpx1: control[0], cpy1: control[1],
          },
          style: {
            stroke: t.palette[0],
            fill: "none",
            lineWidth: 1.5 + (weight / 9) * 4,
            opacity: 0.32 + (weight / 9) * 0.4,
          },
        };
      },
    },
    {
      type: "scatter",
      silent: true,
      z: 3,
      data: stages.map((_, i) => ({
        value: [i, baseline],
        symbolSize: 15 + degree[i] * 3,
      })),
      itemStyle: { color: t.ink, borderColor: t.pageBg, borderWidth: 2 },
    },
  ],
});
Runnable source as JSON, for any HTTP client: https://api.anyplot.ai/specs/arc-basic/echarts/code. Any spec id and library id listed in llms-full.txt fit the same URL shape; every URL below is complete and callable.
{
  "spec_id": "arc-basic",
  "language": "javascript",
  "library": "echarts",
  "page": "https://anyplot.ai/arc-basic/javascript/echarts",
  "hub": "https://anyplot.ai/arc-basic",
  "code_json": "https://api.anyplot.ai/specs/arc-basic/echarts/code",
  "spec_json": "https://api.anyplot.ai/specs/arc-basic",
  "render_light_png": "https://storage.googleapis.com/anyplot-images/plots/arc-basic/javascript/echarts/plot-light.png",
  "render_dark_png": "https://storage.googleapis.com/anyplot-images/plots/arc-basic/javascript/echarts/plot-dark.png",
  "interactive_light_html": "https://storage.googleapis.com/anyplot-images/plots/arc-basic/javascript/echarts/plot-light.html",
  "interactive_dark_html": "https://storage.googleapis.com/anyplot-images/plots/arc-basic/javascript/echarts/plot-dark.html",
  "quality_score": 93.0,
  "license": "MIT",
  "guide": "https://anyplot.ai/llms.txt"
}
Part of Basic Arc Diagram on anyplot.ai.