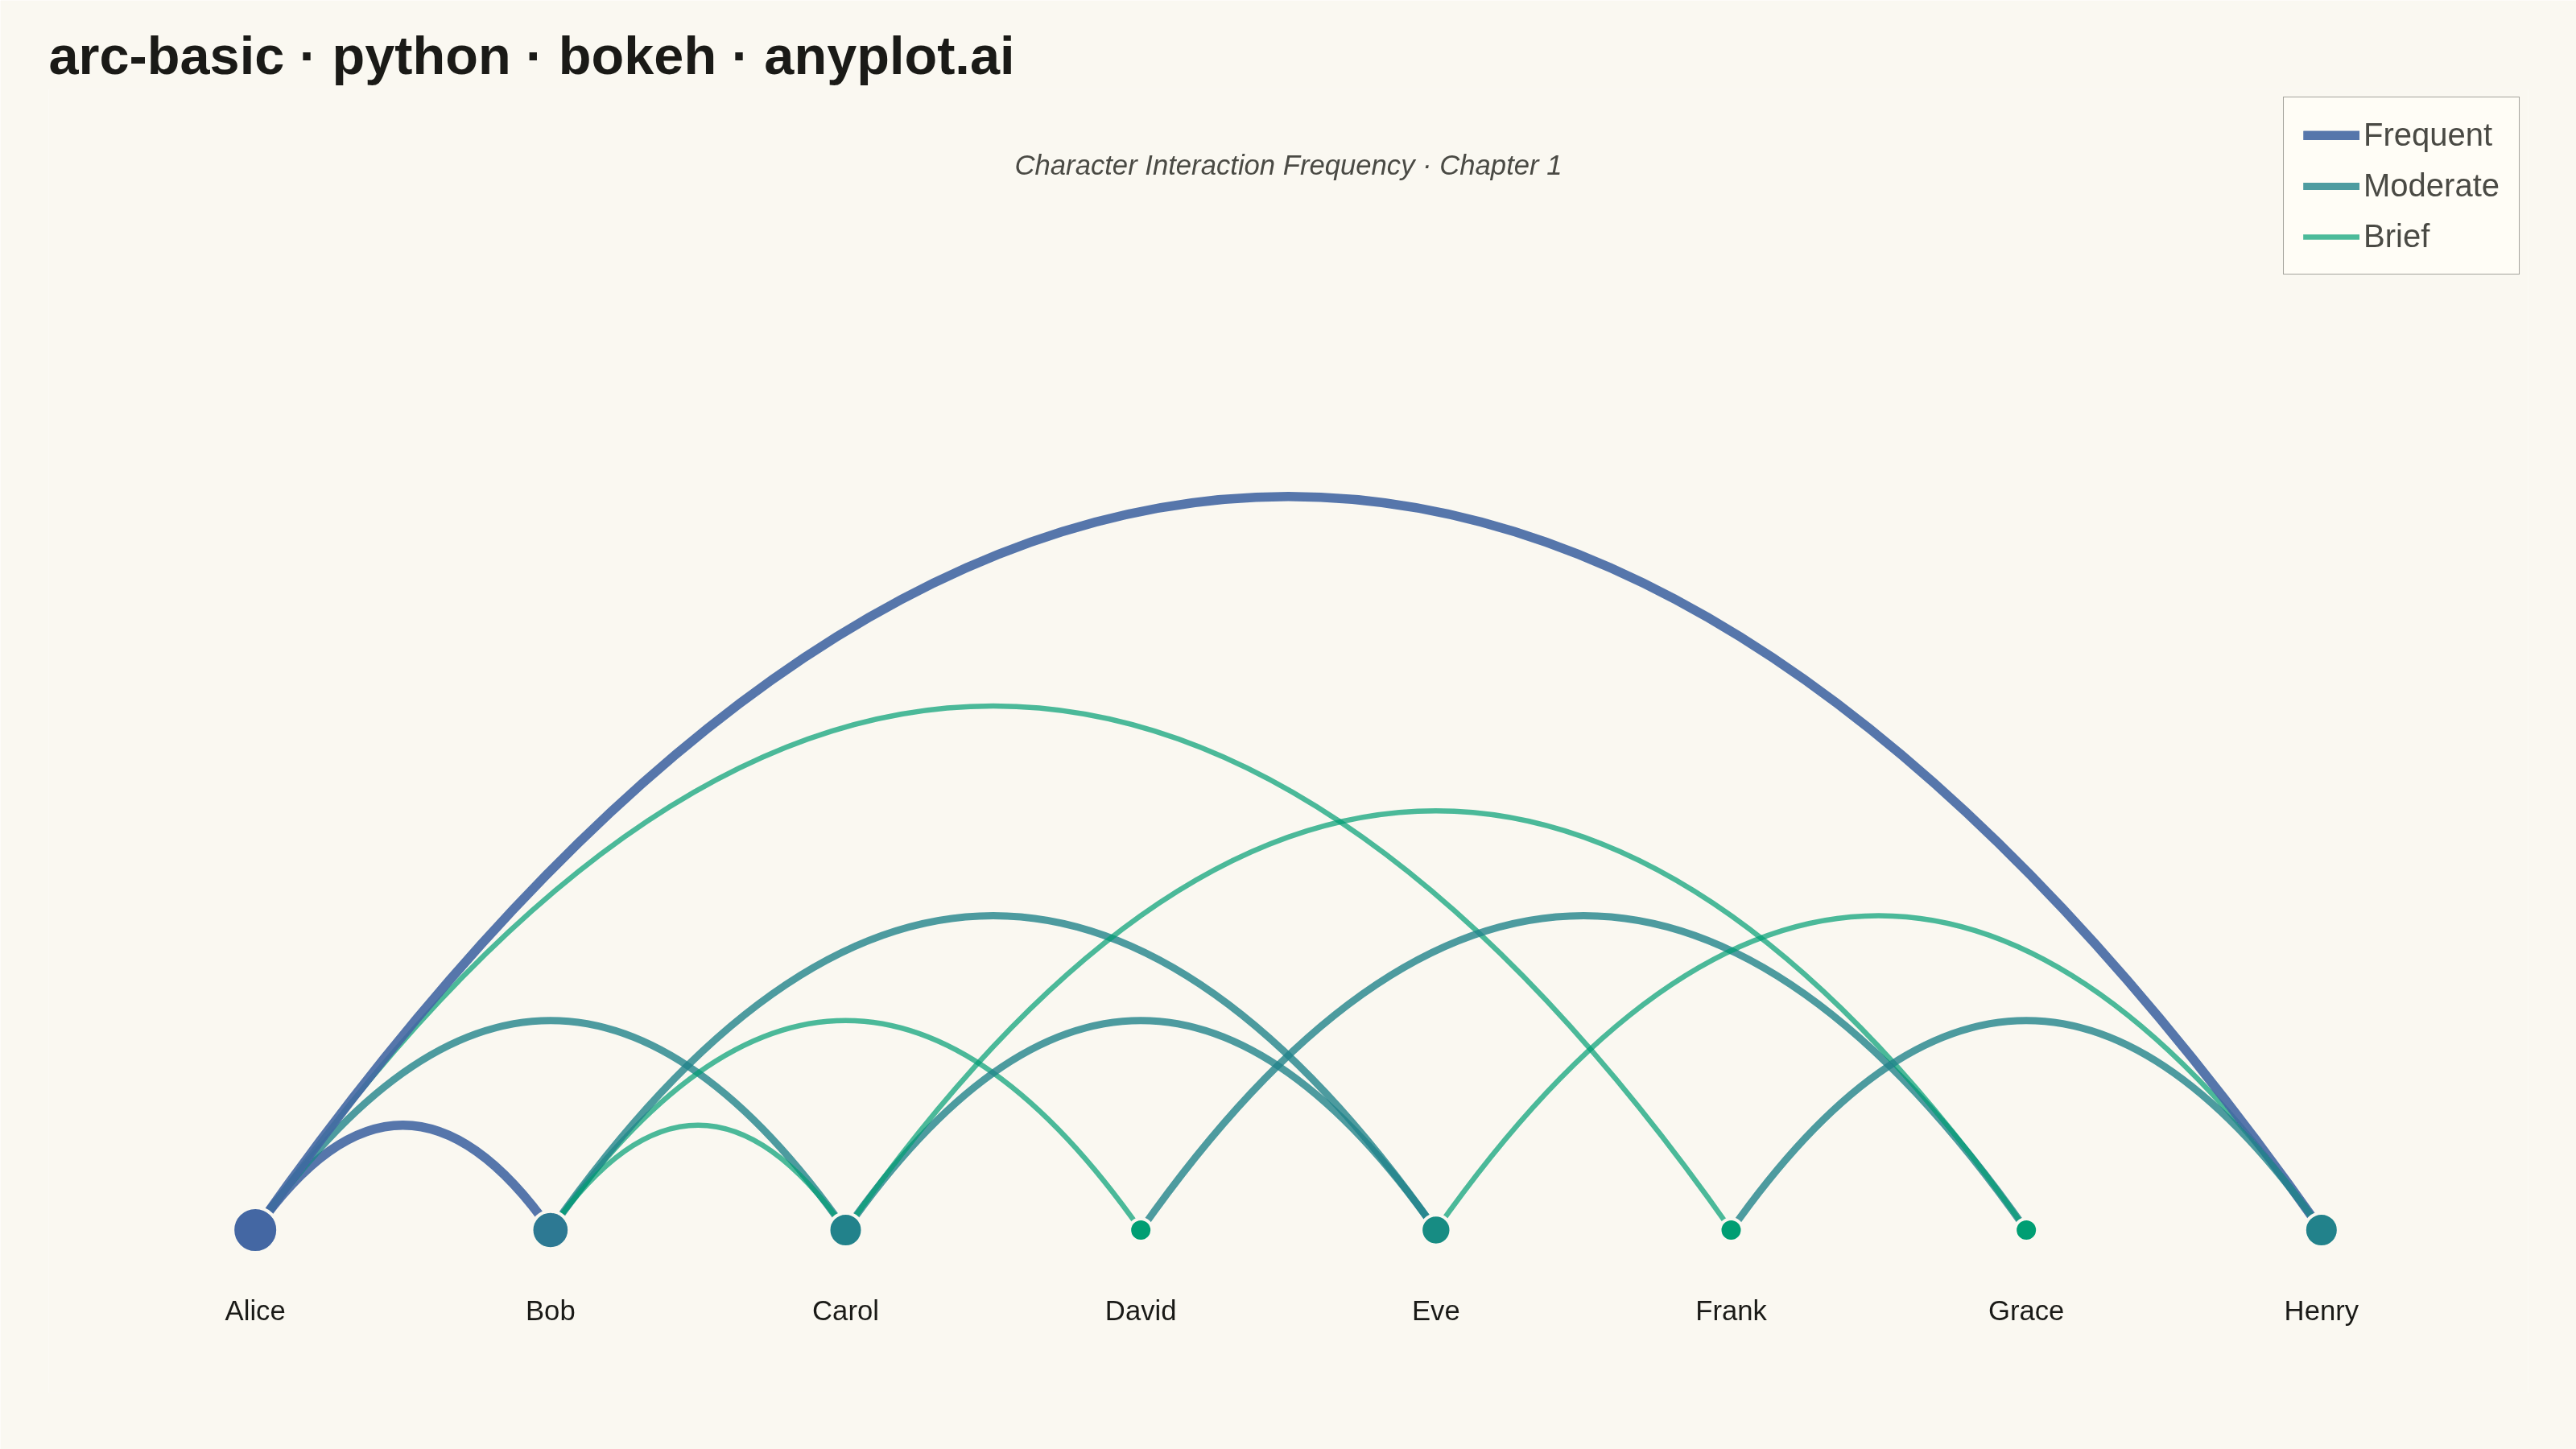
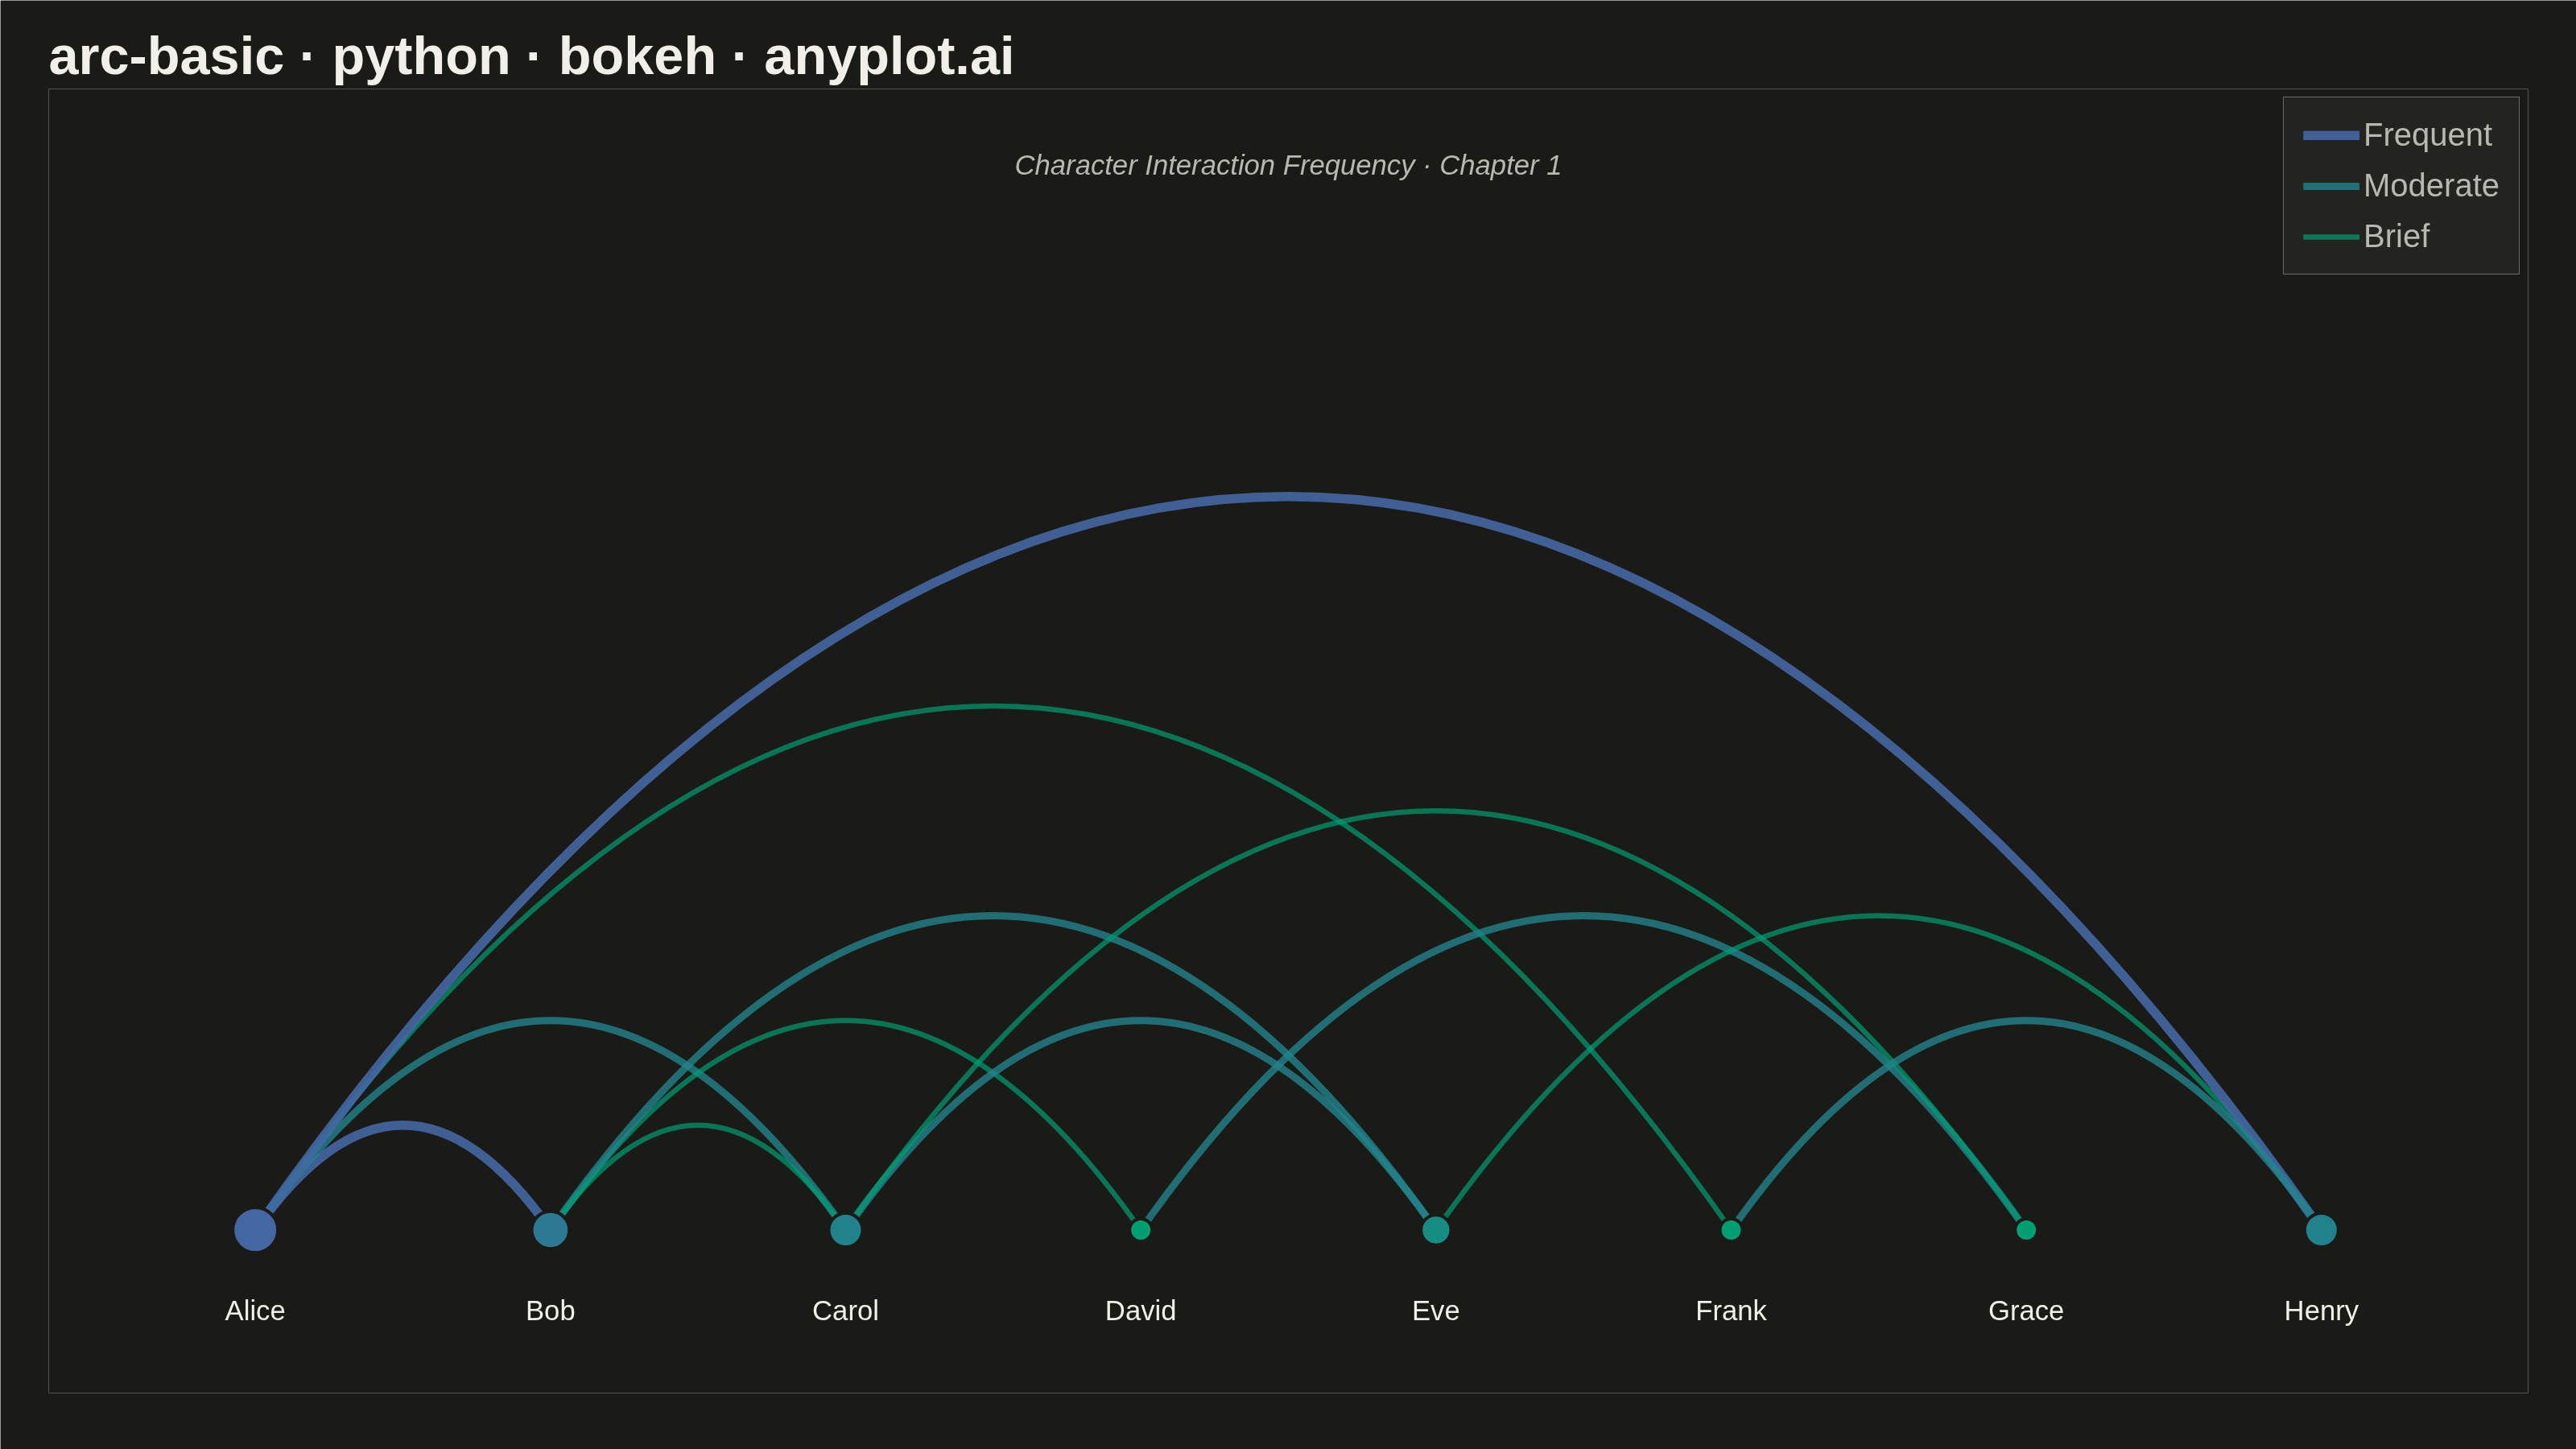
An arc diagram arranges nodes along a single horizontal line and draws connections between them as curved arcs above the line. This layout excels at revealing patterns in sequential or ordered data while minimizing visual clutter compared to force-directed layouts. Arc height typically indicates the distance between connected nodes, making it easy to spot long-range versus short-range connections.
""" anyplot.ai
arc-basic: Basic Arc Diagram
Library: bokeh 3.9.0 | Python 3.13.13
Quality: 90/100 | Updated: 2026-05-30
"""

import os
import time
from pathlib import Path

import numpy as np
from bokeh.io import output_file, save
from bokeh.models import ColumnDataSource, HoverTool, Label, Legend, LegendItem
from bokeh.plotting import figure
from selenium import webdriver
from selenium.webdriver.chrome.options import Options


# Theme tokens (Imprint palette — theme-adaptive chrome)
THEME = os.getenv("ANYPLOT_THEME", "light")
PAGE_BG = "#FAF8F1" if THEME == "light" else "#1A1A17"
ELEVATED_BG = "#FFFDF6" if THEME == "light" else "#242420"
INK = "#1A1A17" if THEME == "light" else "#F0EFE8"
INK_SOFT = "#4A4A44" if THEME == "light" else "#B8B7B0"

# Imprint sequential colormap stops: brand green → blue
# Brief (1): #009E73, Moderate (2): midpoint, Frequent (3): #4467A3
WEIGHT_COLORS = {1: "#009E73", 2: "#22838B", 3: "#4467A3"}
WEIGHT_LABELS = {1: "Brief", 2: "Moderate", 3: "Frequent"}

# Data — character interactions in a story chapter
nodes = ["Alice", "Bob", "Carol", "David", "Eve", "Frank", "Grace", "Henry"]
edges = [
    (0, 1, 3),  # Alice–Bob: frequent
    (0, 2, 2),  # Alice–Carol: moderate
    (1, 3, 1),  # Bob–David: brief
    (2, 4, 2),  # Carol–Eve: moderate
    (0, 5, 1),  # Alice–Frank: brief
    (3, 6, 2),  # David–Grace: moderate
    (4, 7, 1),  # Eve–Henry: brief
    (0, 7, 3),  # Alice–Henry: frequent (long-range)
    (1, 4, 2),  # Bob–Eve: moderate
    (2, 6, 1),  # Carol–Grace: brief
    (5, 7, 2),  # Frank–Henry: moderate
    (1, 2, 1),  # Bob–Carol: brief (short-range)
]

n_nodes = len(nodes)
x_positions = np.linspace(0.5, 10.5, n_nodes)
y_baseline = 0.0

# Weighted degree — hub characters get larger, darker nodes
weighted_degrees = np.zeros(n_nodes)
for src, tgt, w in edges:
    weighted_degrees[src] += w
    weighted_degrees[tgt] += w

min_wd, max_wd = weighted_degrees.min(), weighted_degrees.max()
node_sizes = 28 + (weighted_degrees - min_wd) / (max_wd - min_wd) * 28

# Node colors on imprint_seq (brand green → blue by degree)
node_colors = []
for wd in weighted_degrees:
    t = float(wd - min_wd) / float(max_wd - min_wd)
    r = int(round(0x00 + t * (0x44 - 0x00)))
    g = int(round(0x9E + t * (0x67 - 0x9E)))
    b_val = int(round(0x73 + t * (0xA3 - 0x73)))
    node_colors.append(f"#{r:02X}{g:02X}{b_val:02X}")

# Figure — 3200×1800 landscape, no toolbar (toolbar adds ~30–50 px and breaks PNG height)
p = figure(
    width=3200,
    height=1800,
    title="arc-basic · python · bokeh · anyplot.ai",
    x_range=(-0.5, 11.5),
    y_range=(-0.5, 3.5),
    toolbar_location=None,
    min_border_bottom=70,
    min_border_left=60,
    min_border_top=110,
    min_border_right=60,
)

# Theme-adaptive chrome
p.background_fill_color = PAGE_BG
p.border_fill_color = PAGE_BG
p.outline_line_color = None
p.title.text_font_size = "50pt"
p.title.text_color = INK
p.xaxis.visible = False
p.yaxis.visible = False
p.xgrid.visible = False
p.ygrid.visible = False

# Subtitle — centered over the arc area
p.add_layout(
    Label(
        x=5.5,
        y=3.22,
        text="Character Interaction Frequency · Chapter 1",
        text_font_size="26pt",
        text_font_style="italic",
        text_color=INK_SOFT,
        text_align="center",
    )
)

# Arcs — arc_height = 0.30 × distance keeps all arcs inside y_range
arc_renderers_by_weight = {1: [], 2: [], 3: []}

for src_idx, tgt_idx, weight in edges:
    x_src = x_positions[src_idx]
    x_tgt = x_positions[tgt_idx]
    distance = abs(x_tgt - x_src)
    arc_height = distance * 0.30
    cx0 = x_src + (x_tgt - x_src) / 3
    cx1 = x_src + 2 * (x_tgt - x_src) / 3

    line_width = 4.0 + weight * 2.5  # 6.5 / 9.0 / 11.5 px — Brief clearly visible
    alpha = 0.60 + weight * 0.10  # 0.70 / 0.80 / 0.90 — Brief arcs fully legible

    arc_src = ColumnDataSource(
        data={
            "x0": [x_src],
            "y0": [y_baseline],
            "x1": [x_tgt],
            "y1": [y_baseline],
            "cx0": [cx0],
            "cy0": [arc_height],
            "cx1": [cx1],
            "cy1": [arc_height],
            "source_name": [nodes[src_idx]],
            "target_name": [nodes[tgt_idx]],
            "weight_label": [WEIGHT_LABELS[weight]],
        }
    )
    renderer = p.bezier(
        x0="x0",
        y0="y0",
        x1="x1",
        y1="y1",
        cx0="cx0",
        cy0="cy0",
        cx1="cx1",
        cy1="cy1",
        source=arc_src,
        line_width=line_width,
        line_color=WEIGHT_COLORS[weight],
        line_alpha=alpha,
    )
    arc_renderers_by_weight[weight].append(renderer)

arc_hover = HoverTool(
    tooltips=[("Connection", "@source_name ↔ @target_name"), ("Frequency", "@weight_label")], line_policy="interp"
)
p.add_tools(arc_hover)

# Nodes — size and color encode weighted degree (hub visibility)
node_source = ColumnDataSource(
    data={
        "x": x_positions,
        "y": [y_baseline] * n_nodes,
        "name": nodes,
        "size": node_sizes,
        "color": node_colors,
        "connections": [int(wd) for wd in weighted_degrees],
    }
)
node_renderer = p.scatter(
    x="x", y="y", source=node_source, size="size", fill_color="color", line_color=PAGE_BG, line_width=4
)
node_hover = HoverTool(
    tooltips=[("Character", "@name"), ("Connection Strength", "@connections")], renderers=[node_renderer]
)
p.add_tools(node_hover)

# Node labels
for i, name in enumerate(nodes):
    p.add_layout(
        Label(
            x=x_positions[i],
            y=-0.20,
            text=name,
            text_font_size="26pt",
            text_align="center",
            text_baseline="top",
            text_color=INK,
        )
    )

# Legend — larger text + integrated styling to address previous "slightly small/detached"
legend_items = [
    LegendItem(label=WEIGHT_LABELS[w], renderers=[arc_renderers_by_weight[w][0]])
    for w in [3, 2, 1]
    if arc_renderers_by_weight[w]
]
legend = Legend(
    items=legend_items,
    location="top_right",
    label_text_font_size="30pt",
    label_text_color=INK_SOFT,
    border_line_color=INK_SOFT,
    border_line_alpha=0.5,
    background_fill_color=ELEVATED_BG,
    background_fill_alpha=0.95,
    glyph_width=70,
    glyph_height=12,
    spacing=18,
    padding=24,
)
p.add_layout(legend)

# Save interactive HTML (catalog artifact)
output_file(f"plot-{THEME}.html")
save(p)

# Screenshot with headless Chrome via Selenium (export_png uses snap chromedriver which fails)
# CDP setDeviceMetricsOverride forces the exact inner viewport — --window-size alone is
# consumed by browser chrome in headless mode and shrinks the rendered height.
W, H = 3200, 1800
opts = Options()
for arg in (
    "--headless=new",
    "--no-sandbox",
    "--disable-dev-shm-usage",
    "--disable-gpu",
    f"--window-size={W},{H}",
    "--hide-scrollbars",
):
    opts.add_argument(arg)
driver = webdriver.Chrome(options=opts)
driver.execute_cdp_cmd(
    "Emulation.setDeviceMetricsOverride", {"width": W, "height": H, "deviceScaleFactor": 1, "mobile": False}
)
driver.get(f"file://{Path(f'plot-{THEME}.html').resolve()}")
time.sleep(3)
driver.save_screenshot(f"plot-{THEME}.png")
driver.quit()

# Belt-and-braces: pad/crop to exact dims so the post-render gate always passes
from PIL import Image as _PILImage


_img = _PILImage.open(f"plot-{THEME}.png").convert("RGB")
if _img.size != (W, H):
    _norm = _PILImage.new("RGB", (W, H), PAGE_BG)
    _norm.paste(_img, ((W - _img.size[0]) // 2, (H - _img.size[1]) // 2))
    _norm.save(f"plot-{THEME}.png")
Runnable source as JSON, for any HTTP client: https://api.anyplot.ai/specs/arc-basic/bokeh/code. Any spec id and library id listed in llms-full.txt fit the same URL shape; every URL below is complete and callable.
{
  "spec_id": "arc-basic",
  "language": "python",
  "library": "bokeh",
  "page": "https://anyplot.ai/arc-basic/python/bokeh",
  "hub": "https://anyplot.ai/arc-basic",
  "code_json": "https://api.anyplot.ai/specs/arc-basic/bokeh/code",
  "spec_json": "https://api.anyplot.ai/specs/arc-basic",
  "render_light_png": "https://storage.googleapis.com/anyplot-images/plots/arc-basic/python/bokeh/plot-light.png",
  "render_dark_png": "https://storage.googleapis.com/anyplot-images/plots/arc-basic/python/bokeh/plot-dark.png",
  "interactive_light_html": "https://storage.googleapis.com/anyplot-images/plots/arc-basic/python/bokeh/plot-light.html",
  "interactive_dark_html": "https://storage.googleapis.com/anyplot-images/plots/arc-basic/python/bokeh/plot-dark.html",
  "quality_score": 90.0,
  "license": "MIT",
  "guide": "https://anyplot.ai/llms.txt"
}
Part of Basic Arc Diagram on anyplot.ai.