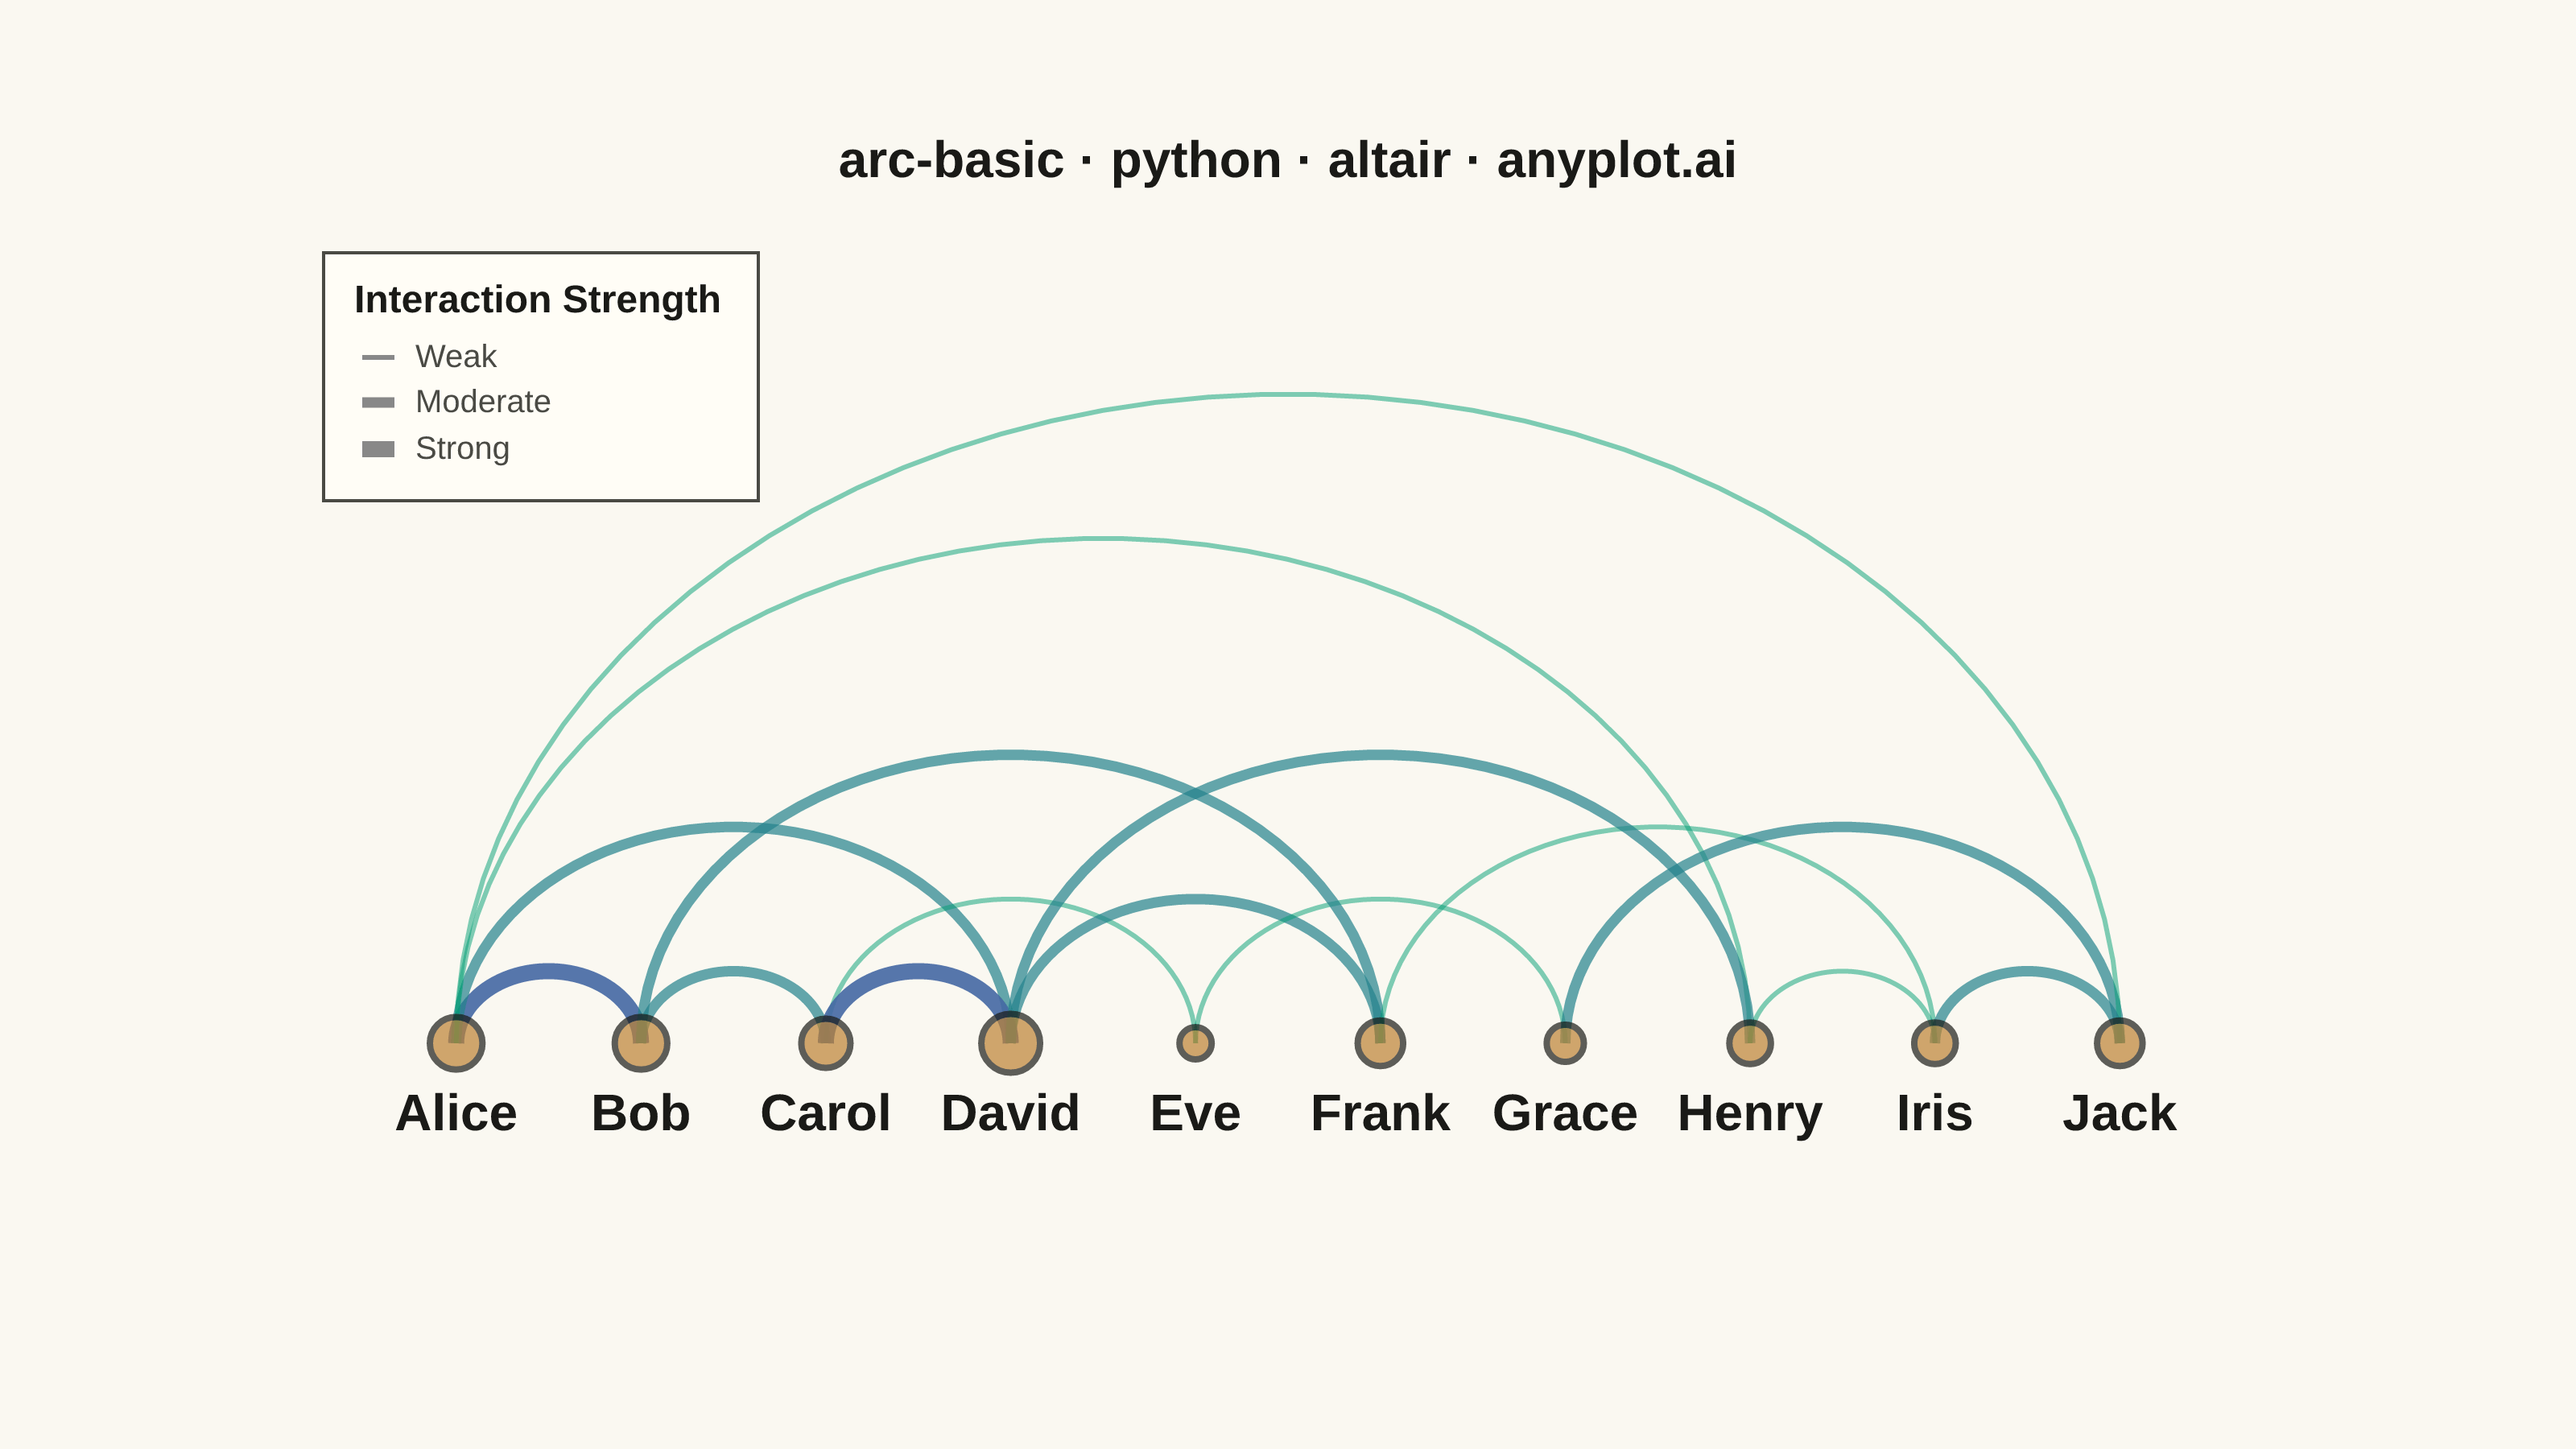
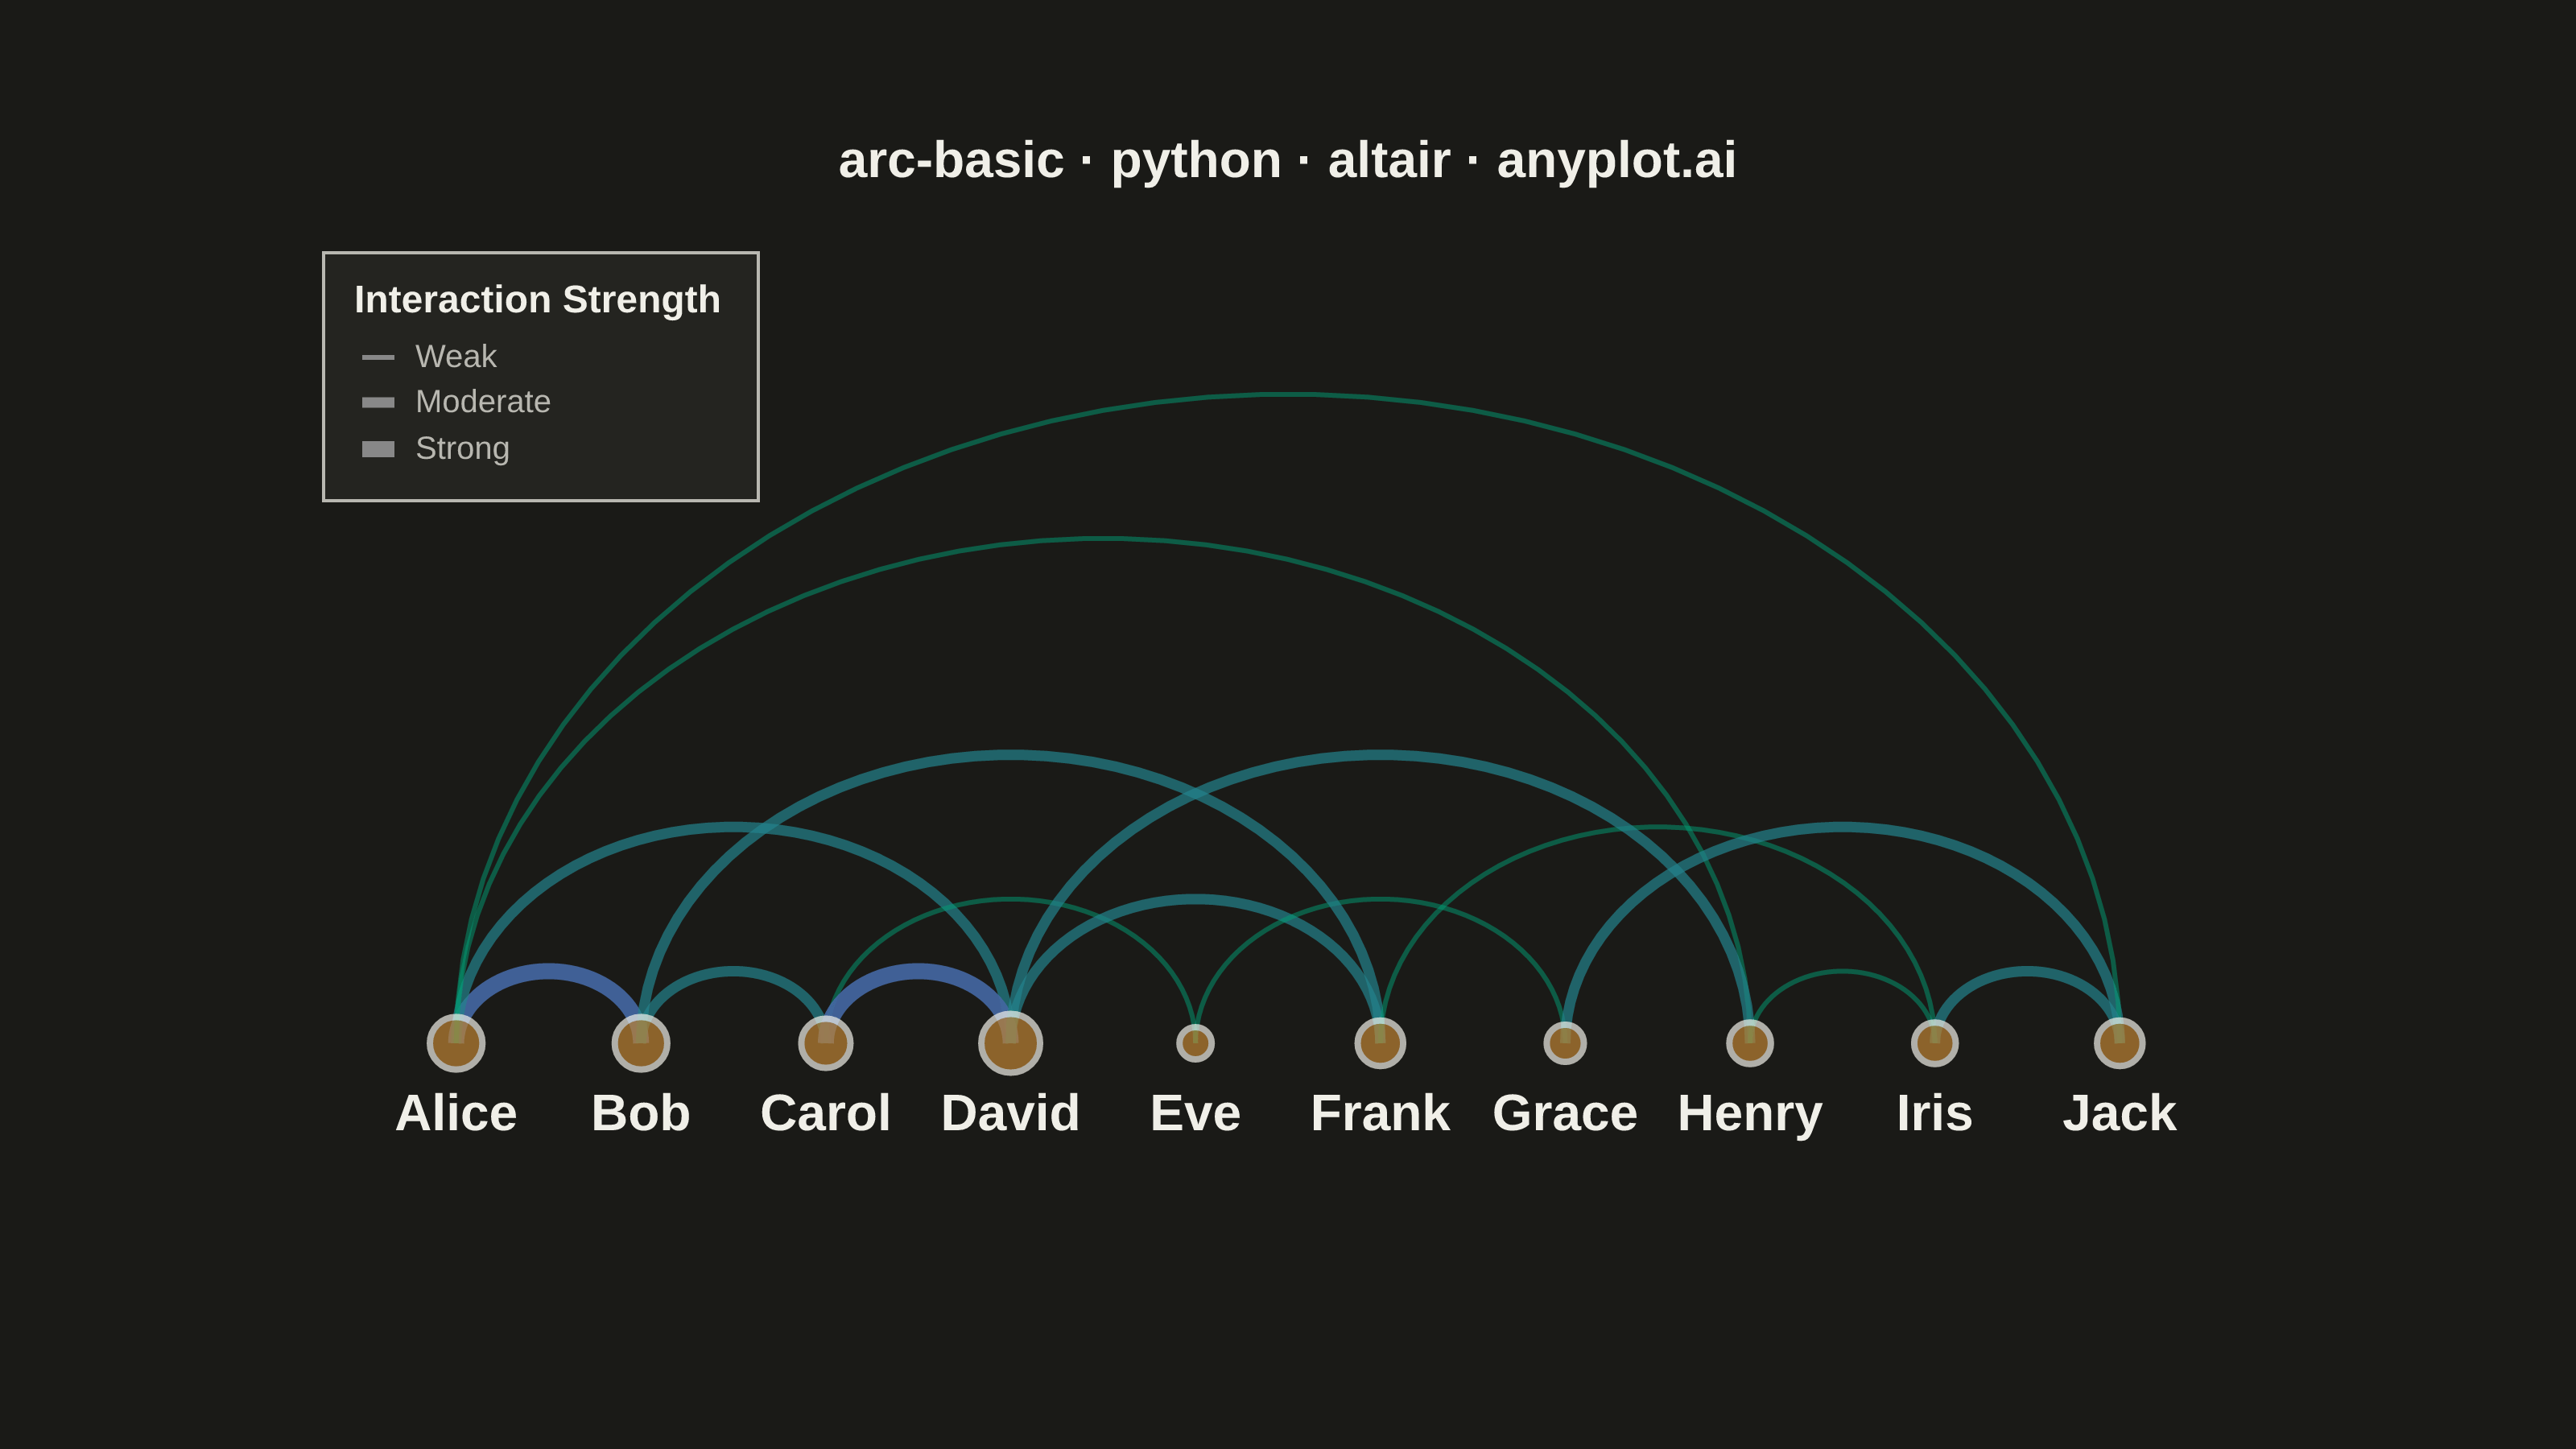
An arc diagram arranges nodes along a single horizontal line and draws connections between them as curved arcs above the line. This layout excels at revealing patterns in sequential or ordered data while minimizing visual clutter compared to force-directed layouts. Arc height typically indicates the distance between connected nodes, making it easy to spot long-range versus short-range connections.
""" anyplot.ai
arc-basic: Basic Arc Diagram
Library: altair 6.1.0 | Python 3.13.13
Quality: 90/100 | Updated: 2026-05-30
"""

import importlib
import os
import sys

from PIL import Image


# Drop script directory from sys.path so the `altair` package resolves, not this file
sys.path[:] = [p for p in sys.path if os.path.abspath(p or ".") != os.path.dirname(os.path.abspath(__file__))]
alt = importlib.import_module("altair")
np = importlib.import_module("numpy")
pd = importlib.import_module("pandas")

# Theme tokens — Imprint palette, theme-adaptive chrome
THEME = os.getenv("ANYPLOT_THEME", "light")
PAGE_BG = "#FAF8F1" if THEME == "light" else "#1A1A17"
ELEVATED_BG = "#FFFDF6" if THEME == "light" else "#242420"
INK = "#1A1A17" if THEME == "light" else "#F0EFE8"
INK_SOFT = "#4A4A44" if THEME == "light" else "#B8B7B0"

# Data: Character interactions in a story chapter
np.random.seed(42)

nodes = ["Alice", "Bob", "Carol", "David", "Eve", "Frank", "Grace", "Henry", "Iris", "Jack"]
n_nodes = len(nodes)

edges = [
    (0, 1, 3),  # Alice-Bob (strong)
    (0, 3, 2),  # Alice-David
    (1, 2, 2),  # Bob-Carol
    (2, 4, 1),  # Carol-Eve
    (3, 5, 2),  # David-Frank
    (4, 6, 1),  # Eve-Grace
    (0, 7, 1),  # Alice-Henry (long-range)
    (1, 5, 2),  # Bob-Frank
    (2, 3, 3),  # Carol-David (strong)
    (5, 8, 1),  # Frank-Iris
    (6, 9, 2),  # Grace-Jack
    (0, 9, 1),  # Alice-Jack (longest range)
    (3, 7, 2),  # David-Henry
    (7, 8, 1),  # Henry-Iris
    (8, 9, 2),  # Iris-Jack
]

x_positions = np.linspace(0, 100, n_nodes)
y_baseline = 0

connection_count = [0] * n_nodes
for s, e, w in edges:
    connection_count[s] += w
    connection_count[e] += w

nodes_df = pd.DataFrame({"x": x_positions, "y": [y_baseline] * n_nodes, "name": nodes, "connections": connection_count})

# Build arc paths as semicircular curves
arc_data = []
points_per_arc = 50
max_span = max(abs(e - s) for s, e, _ in edges)

for edge_id, (start, end, weight) in enumerate(edges):
    x_start = x_positions[start]
    x_end = x_positions[end]
    span = abs(end - start)
    height = 7 * span

    angles = np.linspace(0, np.pi, points_per_arc)
    x_center = (x_start + x_end) / 2
    radius_x = abs(x_end - x_start) / 2
    radius_y = height / 2

    pair = f"{nodes[start]}–{nodes[end]}"
    for i, angle in enumerate(angles):
        arc_data.append(
            {
                "edge_id": edge_id,
                "x": x_center - radius_x * np.cos(angle),
                "y": y_baseline + radius_y * np.sin(angle),
                "weight": weight,
                "pair": pair,
                "order": i,
            }
        )

arcs_df = pd.DataFrame(arc_data)

max_arc_height = 7 * max_span / 2
y_domain = [-8, max_arc_height + 4]
x_domain = [-4, 104]

hover = alt.selection_point(on="pointerover", empty=False, fields=["edge_id"])

# Imprint sequential palette for arc weight: brand green → blue (imprint_seq)
ARC_LOW = "#009E73"  # Imprint position 1 — brand green (weak)
ARC_MID = "#22828B"  # midpoint of imprint_seq
ARC_HIGH = "#4467A3"  # Imprint position 3 — blue (strong)

# Arcs: weight drives color (Imprint sequential), thickness, and opacity
arcs = (
    alt.Chart(arcs_df)
    .mark_line()
    .encode(
        x=alt.X("x:Q", axis=None, scale=alt.Scale(domain=x_domain)),
        y=alt.Y("y:Q", axis=None, scale=alt.Scale(domain=y_domain)),
        detail="edge_id:N",
        strokeWidth=alt.StrokeWidth(
            "weight:Q",
            scale=alt.Scale(domain=[1, 3], range=[1.5, 5]),
            legend=alt.Legend(
                title="Interaction Strength",
                titleFontSize=12,
                labelFontSize=10,
                orient="top-left",
                offset=10,
                values=[1, 2, 3],
                symbolStrokeWidth=3,
                labelExpr="datum.value == 1 ? 'Weak' : datum.value == 2 ? 'Moderate' : 'Strong'",
            ),
        ),
        strokeOpacity=alt.condition(
            hover,
            alt.value(0.95),
            alt.StrokeOpacity("weight:Q", scale=alt.Scale(domain=[1, 3], range=[0.5, 0.9]), legend=None),
        ),
        color=alt.Color("weight:Q", scale=alt.Scale(domain=[1, 2, 3], range=[ARC_LOW, ARC_MID, ARC_HIGH]), legend=None),
        tooltip=[alt.Tooltip("pair:N", title="Connection"), alt.Tooltip("weight:Q", title="Strength")],
    )
    .add_params(hover)
)

# Nodes: Imprint ochre fill, size proportional to total connection weight
node_points = (
    alt.Chart(nodes_df)
    .mark_circle(fill="#BD8233", stroke=INK, strokeWidth=2.0)
    .encode(
        x=alt.X("x:Q", axis=None, scale=alt.Scale(domain=x_domain)),
        y=alt.Y("y:Q", axis=None, scale=alt.Scale(domain=y_domain)),
        size=alt.Size("connections:Q", scale=alt.Scale(domain=[2, 11], range=[100, 400]), legend=None),
        tooltip=[alt.Tooltip("name:N", title="Character"), alt.Tooltip("connections:Q", title="Total Weight")],
    )
)

# Node labels below baseline — theme-adaptive ink color
node_labels = (
    alt.Chart(nodes_df)
    .mark_text(dy=22, fontSize=16, fontWeight="bold", color=INK)
    .encode(x=alt.X("x:Q"), y=alt.Y("y:Q"), text="name:N")
)

title_str = "arc-basic · python · altair · anyplot.ai"

chart = (
    alt.layer(arcs, node_points, node_labels)
    .properties(
        width=620,
        height=320,
        background=PAGE_BG,
        padding={"left": 10, "right": 10, "top": 10, "bottom": 30},
        title=alt.Title(title_str, fontSize=16, anchor="middle", offset=10, color=INK),
    )
    .configure_view(strokeWidth=0, fill=PAGE_BG)
    .configure_legend(fillColor=ELEVATED_BG, strokeColor=INK_SOFT, titleColor=INK, labelColor=INK_SOFT, padding=10)
)

# Save — canvas contract: 3200 × 1800 (landscape)
TW, TH = 3200, 1800
chart.save(f"plot-{THEME}.png", scale_factor=4.0)
_img = Image.open(f"plot-{THEME}.png").convert("RGB")
_w, _h = _img.size
if _w > TW or _h > TH:
    raise SystemExit(
        f"altair vl-convert produced {_w}×{_h}, exceeds target {TW}×{TH}. "
        f"Shrink chart .properties(width=, height=) values and re-render."
    )
if _w < TW or _h < TH:
    _canvas = Image.new("RGB", (TW, TH), PAGE_BG)
    _canvas.paste(_img, ((TW - _w) // 2, (TH - _h) // 2))
    _canvas.save(f"plot-{THEME}.png")

chart.save(f"plot-{THEME}.html")
Runnable source as JSON, for any HTTP client: https://api.anyplot.ai/specs/arc-basic/altair/code. Any spec id and library id listed in llms-full.txt fit the same URL shape; every URL below is complete and callable.
{
  "spec_id": "arc-basic",
  "language": "python",
  "library": "altair",
  "page": "https://anyplot.ai/arc-basic/python/altair",
  "hub": "https://anyplot.ai/arc-basic",
  "code_json": "https://api.anyplot.ai/specs/arc-basic/altair/code",
  "spec_json": "https://api.anyplot.ai/specs/arc-basic",
  "render_light_png": "https://storage.googleapis.com/anyplot-images/plots/arc-basic/python/altair/plot-light.png",
  "render_dark_png": "https://storage.googleapis.com/anyplot-images/plots/arc-basic/python/altair/plot-dark.png",
  "interactive_light_html": "https://storage.googleapis.com/anyplot-images/plots/arc-basic/python/altair/plot-light.html",
  "interactive_dark_html": "https://storage.googleapis.com/anyplot-images/plots/arc-basic/python/altair/plot-dark.html",
  "quality_score": 90.0,
  "license": "MIT",
  "guide": "https://anyplot.ai/llms.txt"
}
Part of Basic Arc Diagram on anyplot.ai.