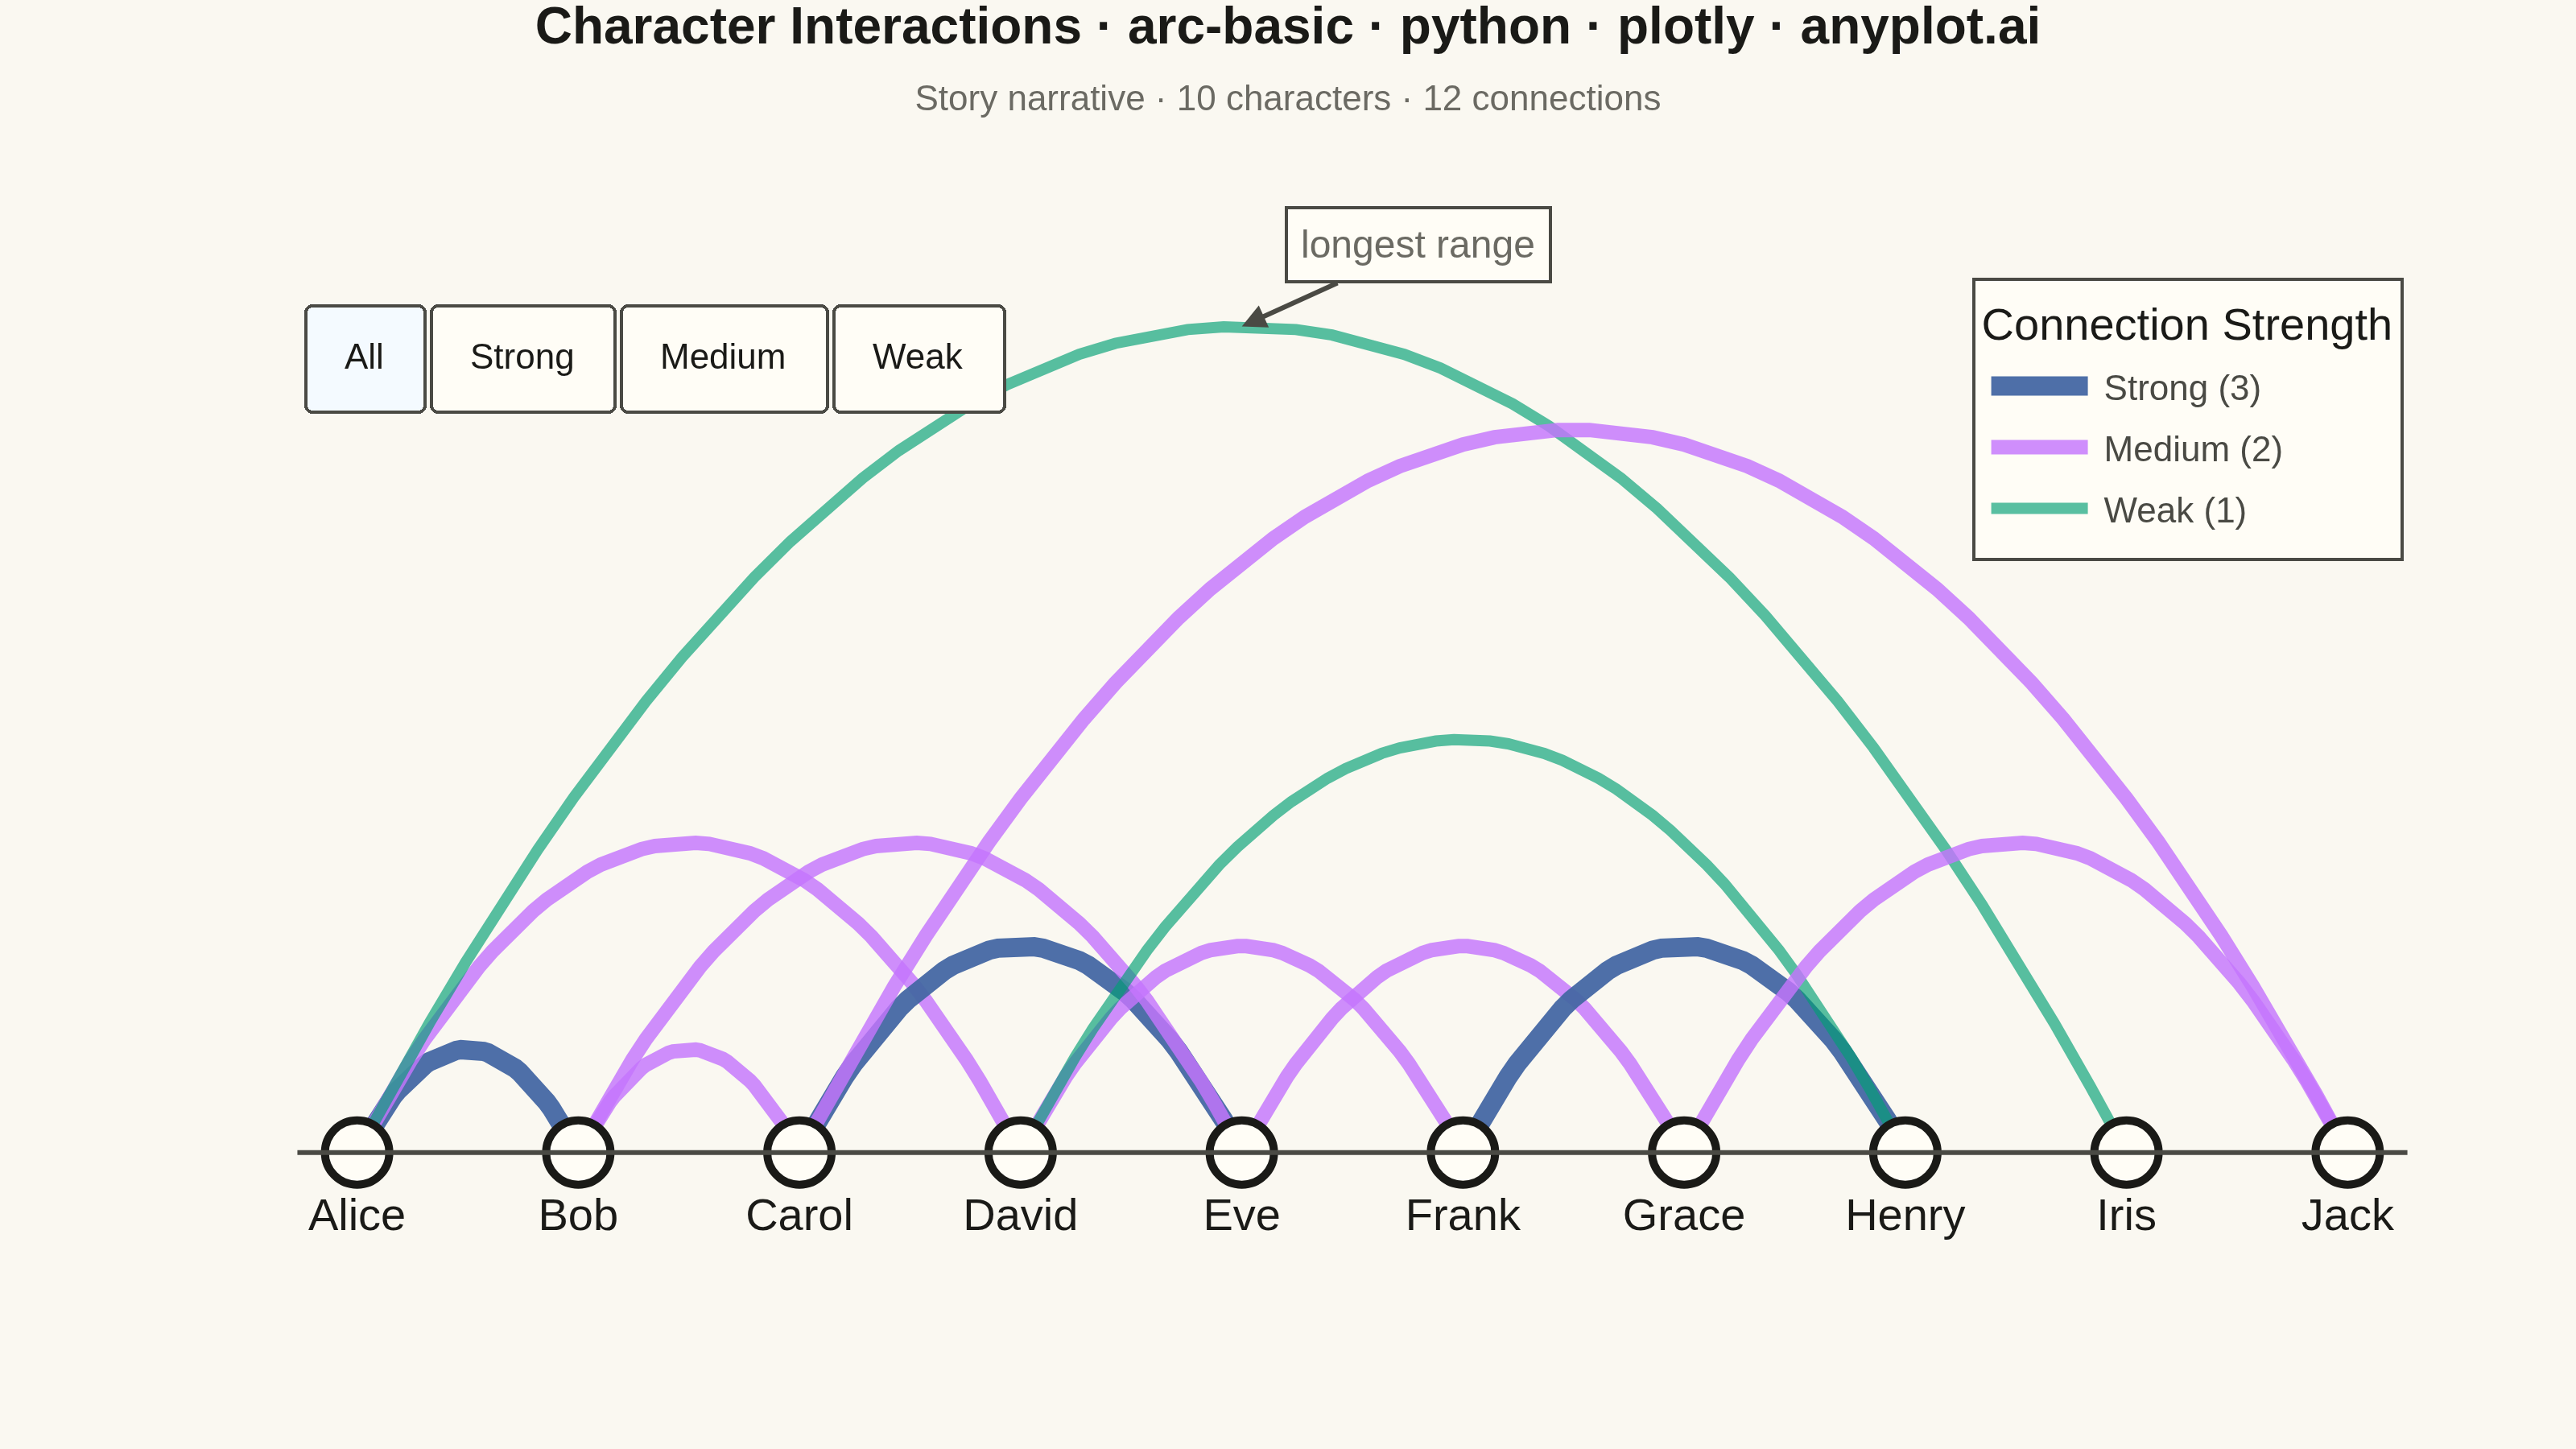
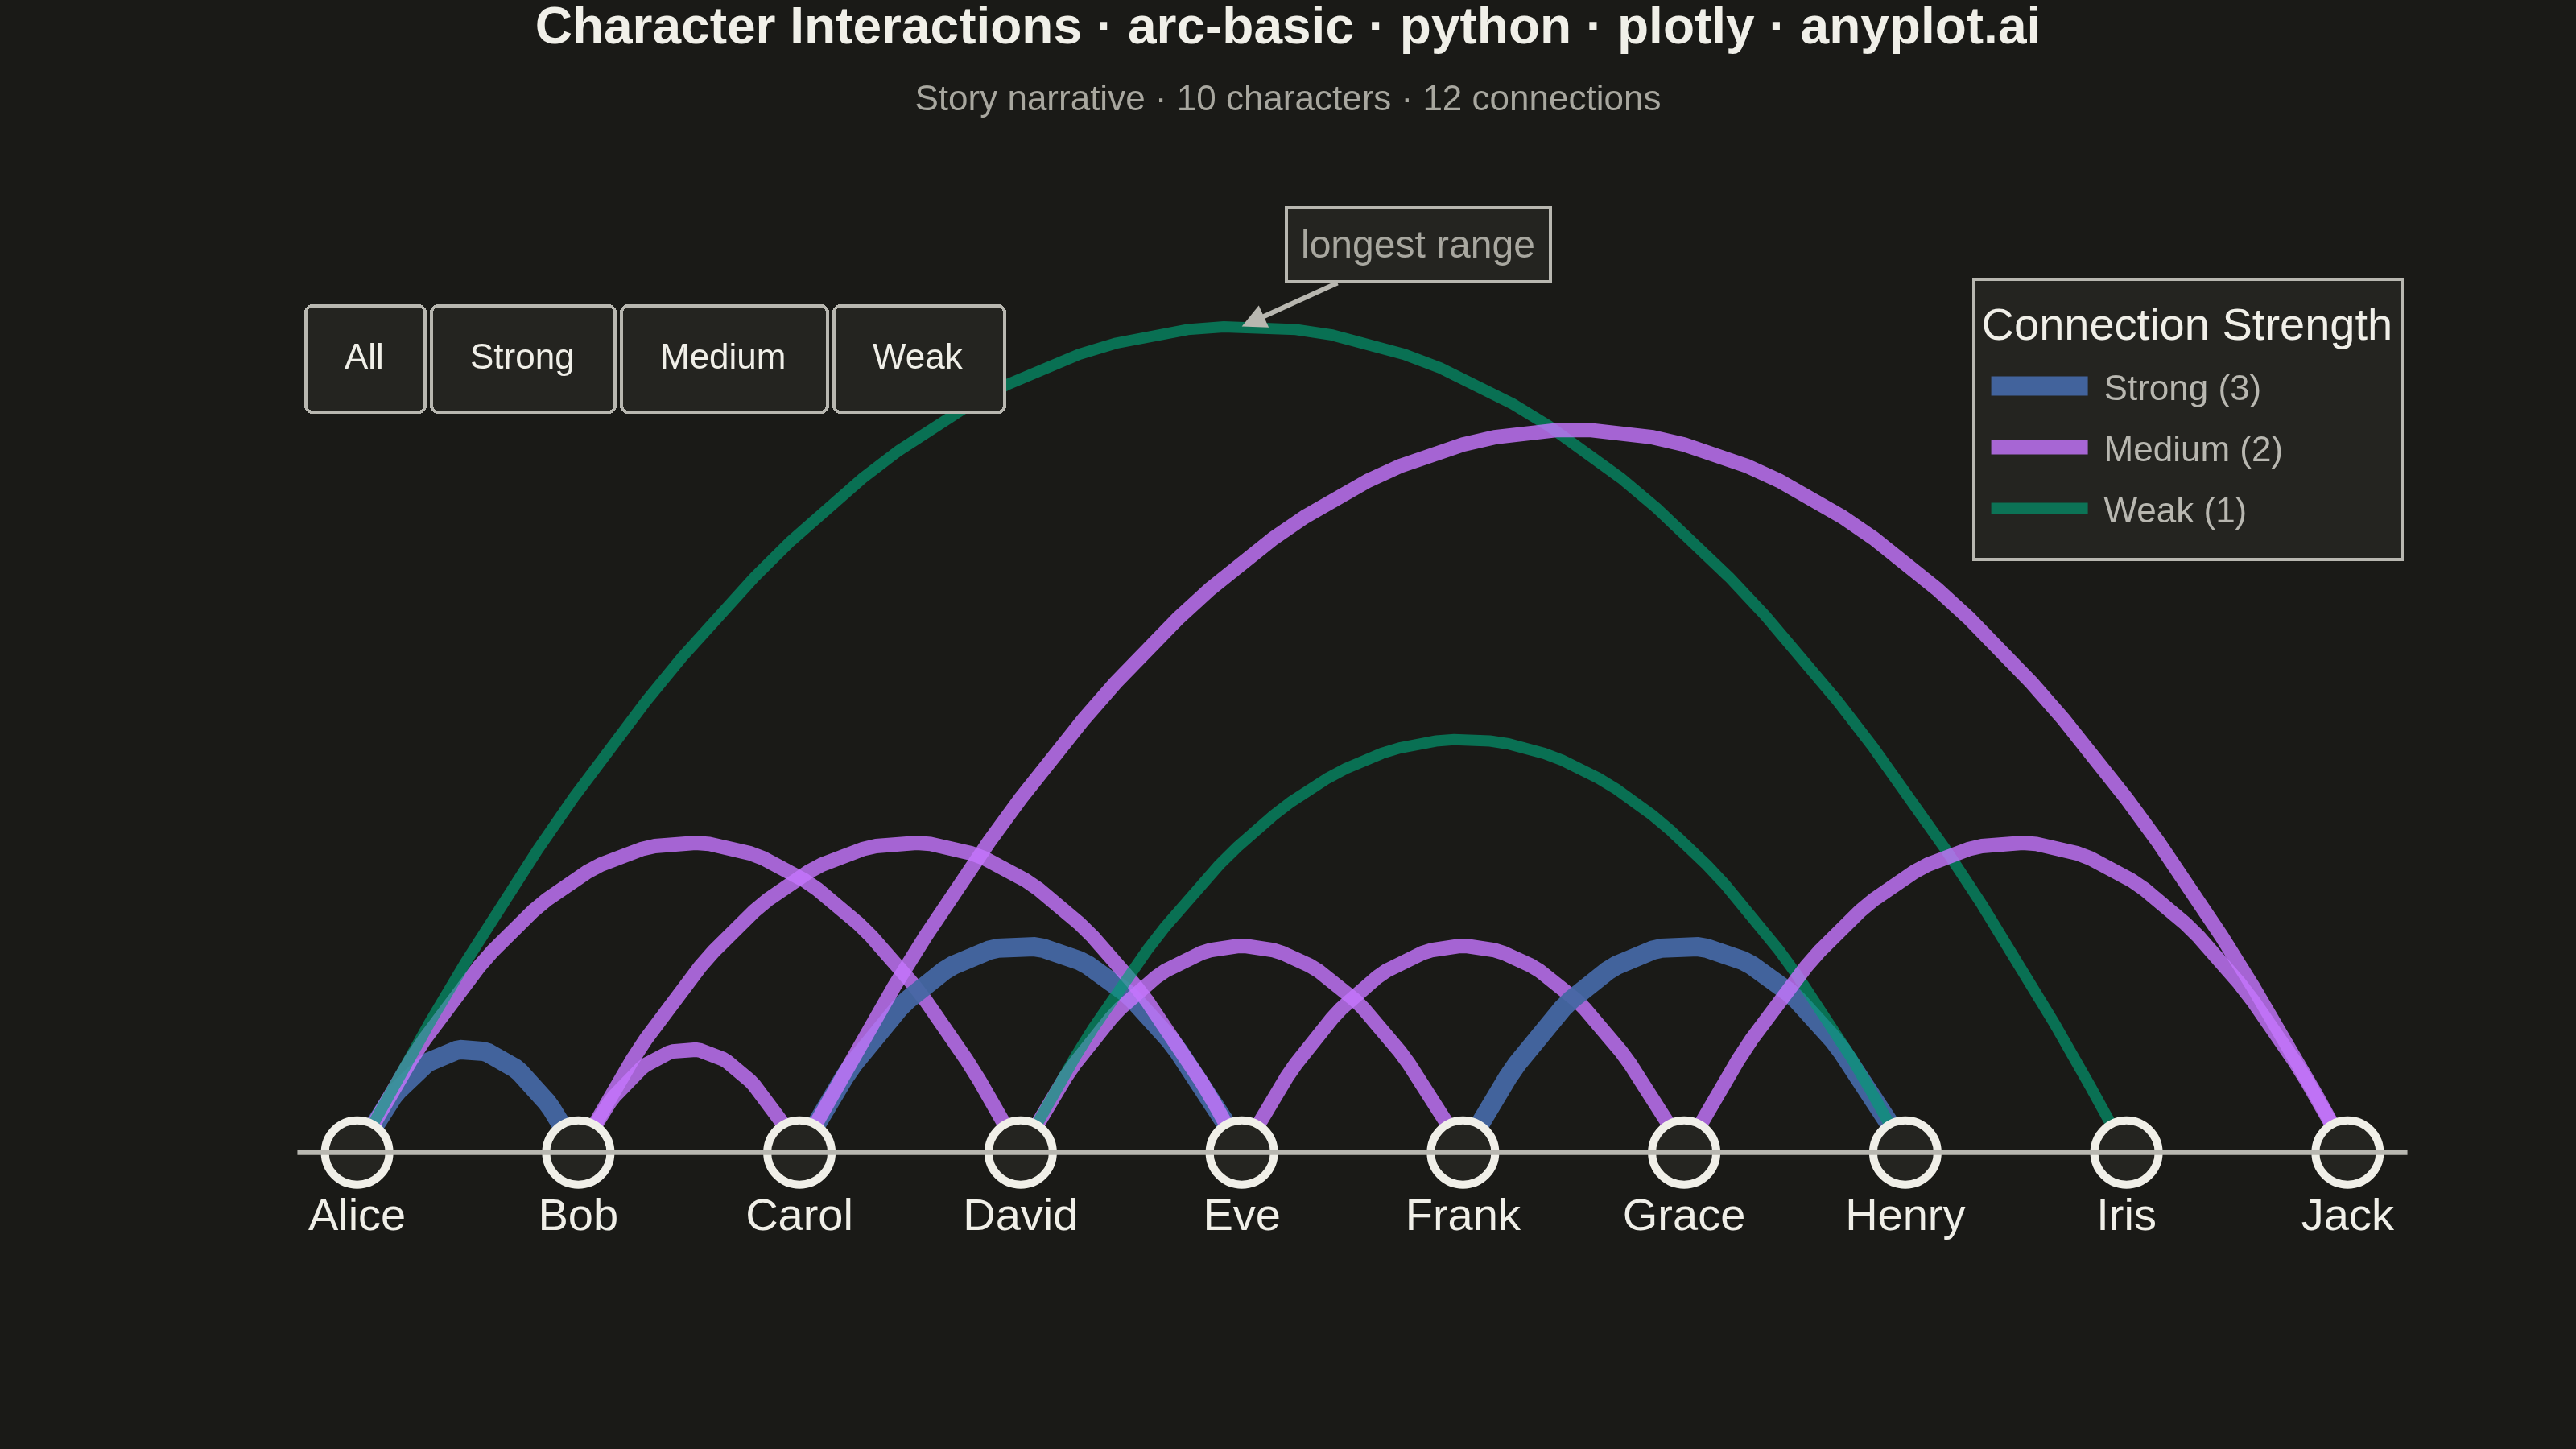
An arc diagram arranges nodes along a single horizontal line and draws connections between them as curved arcs above the line. This layout excels at revealing patterns in sequential or ordered data while minimizing visual clutter compared to force-directed layouts. Arc height typically indicates the distance between connected nodes, making it easy to spot long-range versus short-range connections.
""" anyplot.ai
arc-basic: Basic Arc Diagram
Library: plotly 6.7.0 | Python 3.13.13
Quality: 90/100 | Updated: 2026-05-30
"""

import sys


sys.path = sys.path[1:]  # Prevent self-import: script dir is removed so 'import plotly' finds the package

import os

import numpy as np
import plotly.graph_objects as go


# Theme tokens (see prompts/default-style-guide.md)
THEME = os.getenv("ANYPLOT_THEME", "light")
PAGE_BG = "#FAF8F1" if THEME == "light" else "#1A1A17"
ELEVATED_BG = "#FFFDF6" if THEME == "light" else "#242420"
INK = "#1A1A17" if THEME == "light" else "#F0EFE8"
INK_SOFT = "#4A4A44" if THEME == "light" else "#B8B7B0"
INK_MUTED = "#6B6A63" if THEME == "light" else "#A8A79F"

# Imprint palette positions 1→3 (green → lavender → blue)
arc_styles = {
    1: {"color": "rgba(0, 158, 115, 0.65)", "width": 3.5, "label": "Weak (1)"},
    2: {"color": "rgba(196, 117, 253, 0.82)", "width": 4.5, "label": "Medium (2)"},
    3: {"color": "rgba(68, 103, 163, 0.95)", "width": 6.0, "label": "Strong (3)"},
}

# Data: Character interactions in a story narrative
nodes = ["Alice", "Bob", "Carol", "David", "Eve", "Frank", "Grace", "Henry", "Iris", "Jack"]
n_nodes = len(nodes)
edges = [
    (0, 1, 3),  # Alice-Bob (strong)
    (0, 3, 2),  # Alice-David
    (1, 2, 2),  # Bob-Carol
    (2, 4, 3),  # Carol-Eve (strong)
    (3, 5, 2),  # David-Frank
    (4, 6, 2),  # Eve-Grace
    (5, 7, 3),  # Frank-Henry (strong)
    (0, 8, 1),  # Alice-Iris (long, weak)
    (2, 9, 2),  # Carol-Jack (long)
    (1, 4, 2),  # Bob-Eve
    (3, 7, 1),  # David-Henry (long, weak)
    (6, 9, 2),  # Grace-Jack
]
x_positions = np.linspace(0, 10, n_nodes)

# Figure
fig = go.Figure()
trace_weights = []

# Parabolic arcs
for src, tgt, weight in edges:
    x_src, x_tgt = x_positions[src], x_positions[tgt]
    arc_height = abs(tgt - src) * 0.45
    t = np.linspace(0, 1, 50)
    x_arc = x_src + t * (x_tgt - x_src)
    y_arc = arc_height * 4 * t * (1 - t)
    style = arc_styles[weight]
    distance = abs(tgt - src)
    fig.add_trace(
        go.Scatter(
            x=x_arc,
            y=y_arc,
            mode="lines",
            line={"width": style["width"], "color": style["color"]},
            hovertemplate=(
                f"<b>{nodes[src]} — {nodes[tgt]}</b><br>"
                f"Weight: <b>{weight}</b> ({style['label'].split()[0].lower()})<br>"
                f"Distance: {distance} positions<extra></extra>"
            ),
            showlegend=False,
        )
    )
    trace_weights.append(weight)

# Dummy traces for legend entries
for w in [3, 2, 1]:
    style = arc_styles[w]
    fig.add_trace(
        go.Scatter(
            x=[None],
            y=[None],
            mode="lines",
            line={"width": style["width"], "color": style["color"]},
            name=style["label"],
            showlegend=True,
        )
    )
    trace_weights.append(w)

# Per-node connection count for hover
conn_count = [0] * n_nodes
for src, tgt, _ in edges:
    conn_count[src] += 1
    conn_count[tgt] += 1

# Node markers on baseline
fig.add_trace(
    go.Scatter(
        x=x_positions,
        y=np.zeros(n_nodes),
        mode="markers+text",
        marker={"size": 20, "color": ELEVATED_BG, "line": {"width": 2.5, "color": INK}},
        text=nodes,
        textposition="bottom center",
        textfont={"size": 14, "color": INK},
        customdata=np.array(conn_count),
        hovertemplate="<b>%{text}</b><br>Connections: %{customdata}<extra></extra>",
        showlegend=False,
    )
)
trace_weights.append(0)

# Horizontal baseline
fig.add_shape(
    type="line", x0=x_positions[0] - 0.3, x1=x_positions[-1] + 0.3, y0=0, y1=0, line={"width": 1.5, "color": INK_SOFT}
)

# Annotate the longest-range arc (Alice – Iris, distance = 8)
mid_x = (x_positions[0] + x_positions[8]) / 2
peak_y = abs(8 - 0) * 0.45  # arc peaks at t=0.5: height * 4 * 0.5 * 0.5 = height
fig.add_annotation(
    x=mid_x,
    y=peak_y,
    text="longest range",
    showarrow=True,
    arrowhead=2,
    arrowwidth=1.5,
    arrowcolor=INK_SOFT,
    ax=55,
    ay=-25,
    font={"size": 12, "color": INK_MUTED, "family": "Arial"},
    bgcolor=ELEVATED_BG,
    bordercolor=INK_SOFT,
    borderpad=4,
)

# Interactive filter buttons (Plotly updatemenus)
filter_options = [("All", {1, 2, 3}), ("Strong", {3}), ("Medium", {2}), ("Weak", {1})]
buttons = []
for label, keep in filter_options:
    visible = [True if tw == 0 else (tw in keep) for tw in trace_weights]
    buttons.append({"label": label, "method": "update", "args": [{"visible": visible}]})

# Title with subtitle
title_text = "Character Interactions · arc-basic · python · plotly · anyplot.ai"
title_fontsize = max(11, round(16 * 67 / len(title_text))) if len(title_text) > 67 else 16
title_html = (
    f"<b>{title_text}</b>"
    f"<br><span style='font-size:11px;color:{INK_MUTED};font-weight:normal'>"
    f"Story narrative · 10 characters · 12 connections</span>"
)

fig.update_layout(
    autosize=False,
    paper_bgcolor=PAGE_BG,
    plot_bgcolor=PAGE_BG,
    template="plotly_white",
    font={"color": INK},
    title={
        "text": title_html,
        "font": {"size": title_fontsize, "color": INK},
        "x": 0.5,
        "xanchor": "center",
        "y": 0.97,
    },
    xaxis={"showgrid": False, "zeroline": False, "showticklabels": False, "showline": False, "range": [-0.5, 10.5]},
    yaxis={"showgrid": False, "zeroline": False, "showticklabels": False, "showline": False, "range": [-0.45, 3.9]},
    hovermode="closest",
    hoverlabel={"bgcolor": ELEVATED_BG, "font_size": 16, "font_color": INK, "bordercolor": INK_SOFT},
    margin={"l": 80, "r": 40, "t": 80, "b": 60},
    legend={
        "title": {"text": "Connection Strength", "font": {"size": 14, "color": INK}},
        "font": {"size": 11, "color": INK_SOFT},
        "x": 0.98,
        "y": 0.98,
        "xanchor": "right",
        "yanchor": "top",
        "bgcolor": ELEVATED_BG,
        "bordercolor": INK_SOFT,
        "borderwidth": 1,
    },
    updatemenus=[
        {
            "type": "buttons",
            "direction": "right",
            "x": 0.02,
            "y": 0.98,
            "xanchor": "left",
            "yanchor": "top",
            "buttons": buttons,
            "showactive": THEME == "light",
            "bgcolor": ELEVATED_BG,
            "bordercolor": INK_SOFT,
            "font": {"size": 11, "color": INK},
            "pad": {"r": 8, "t": 8},
        }
    ],
)

# Save — canvas target: 3200 × 1800 px (landscape, width=800 height=450 scale=4)
fig.write_image(f"plot-{THEME}.png", width=800, height=450, scale=4)
fig.write_html(
    f"plot-{THEME}.html",
    include_plotlyjs="cdn",
    config={
        "displaylogo": False,
        "modeBarButtonsToRemove": ["lasso2d", "select2d"],
        "toImageButtonOptions": {"width": 3200, "height": 1800, "scale": 1},
    },
)
Runnable source as JSON, for any HTTP client: https://api.anyplot.ai/specs/arc-basic/plotly/code. Any spec id and library id listed in llms-full.txt fit the same URL shape; every URL below is complete and callable.
{
  "spec_id": "arc-basic",
  "language": "python",
  "library": "plotly",
  "page": "https://anyplot.ai/arc-basic/python/plotly",
  "hub": "https://anyplot.ai/arc-basic",
  "code_json": "https://api.anyplot.ai/specs/arc-basic/plotly/code",
  "spec_json": "https://api.anyplot.ai/specs/arc-basic",
  "render_light_png": "https://storage.googleapis.com/anyplot-images/plots/arc-basic/python/plotly/plot-light.png",
  "render_dark_png": "https://storage.googleapis.com/anyplot-images/plots/arc-basic/python/plotly/plot-dark.png",
  "interactive_light_html": "https://storage.googleapis.com/anyplot-images/plots/arc-basic/python/plotly/plot-light.html",
  "interactive_dark_html": "https://storage.googleapis.com/anyplot-images/plots/arc-basic/python/plotly/plot-dark.html",
  "quality_score": 90.0,
  "license": "MIT",
  "guide": "https://anyplot.ai/llms.txt"
}
Part of Basic Arc Diagram on anyplot.ai.