The same plot in 14 other libraries — JavaScript: Chart.js, D3.js, Apache ECharts, MUI X Charts; Python: Altair, Bokeh, lets-plot, Matplotlib, Plotly, plotnine, Pygal, Seaborn; R: ggplot2; Julia: Makie.jl. Compare all 15 side by side: Basic Arc Diagram in Python, R, Julia and JavaScript.
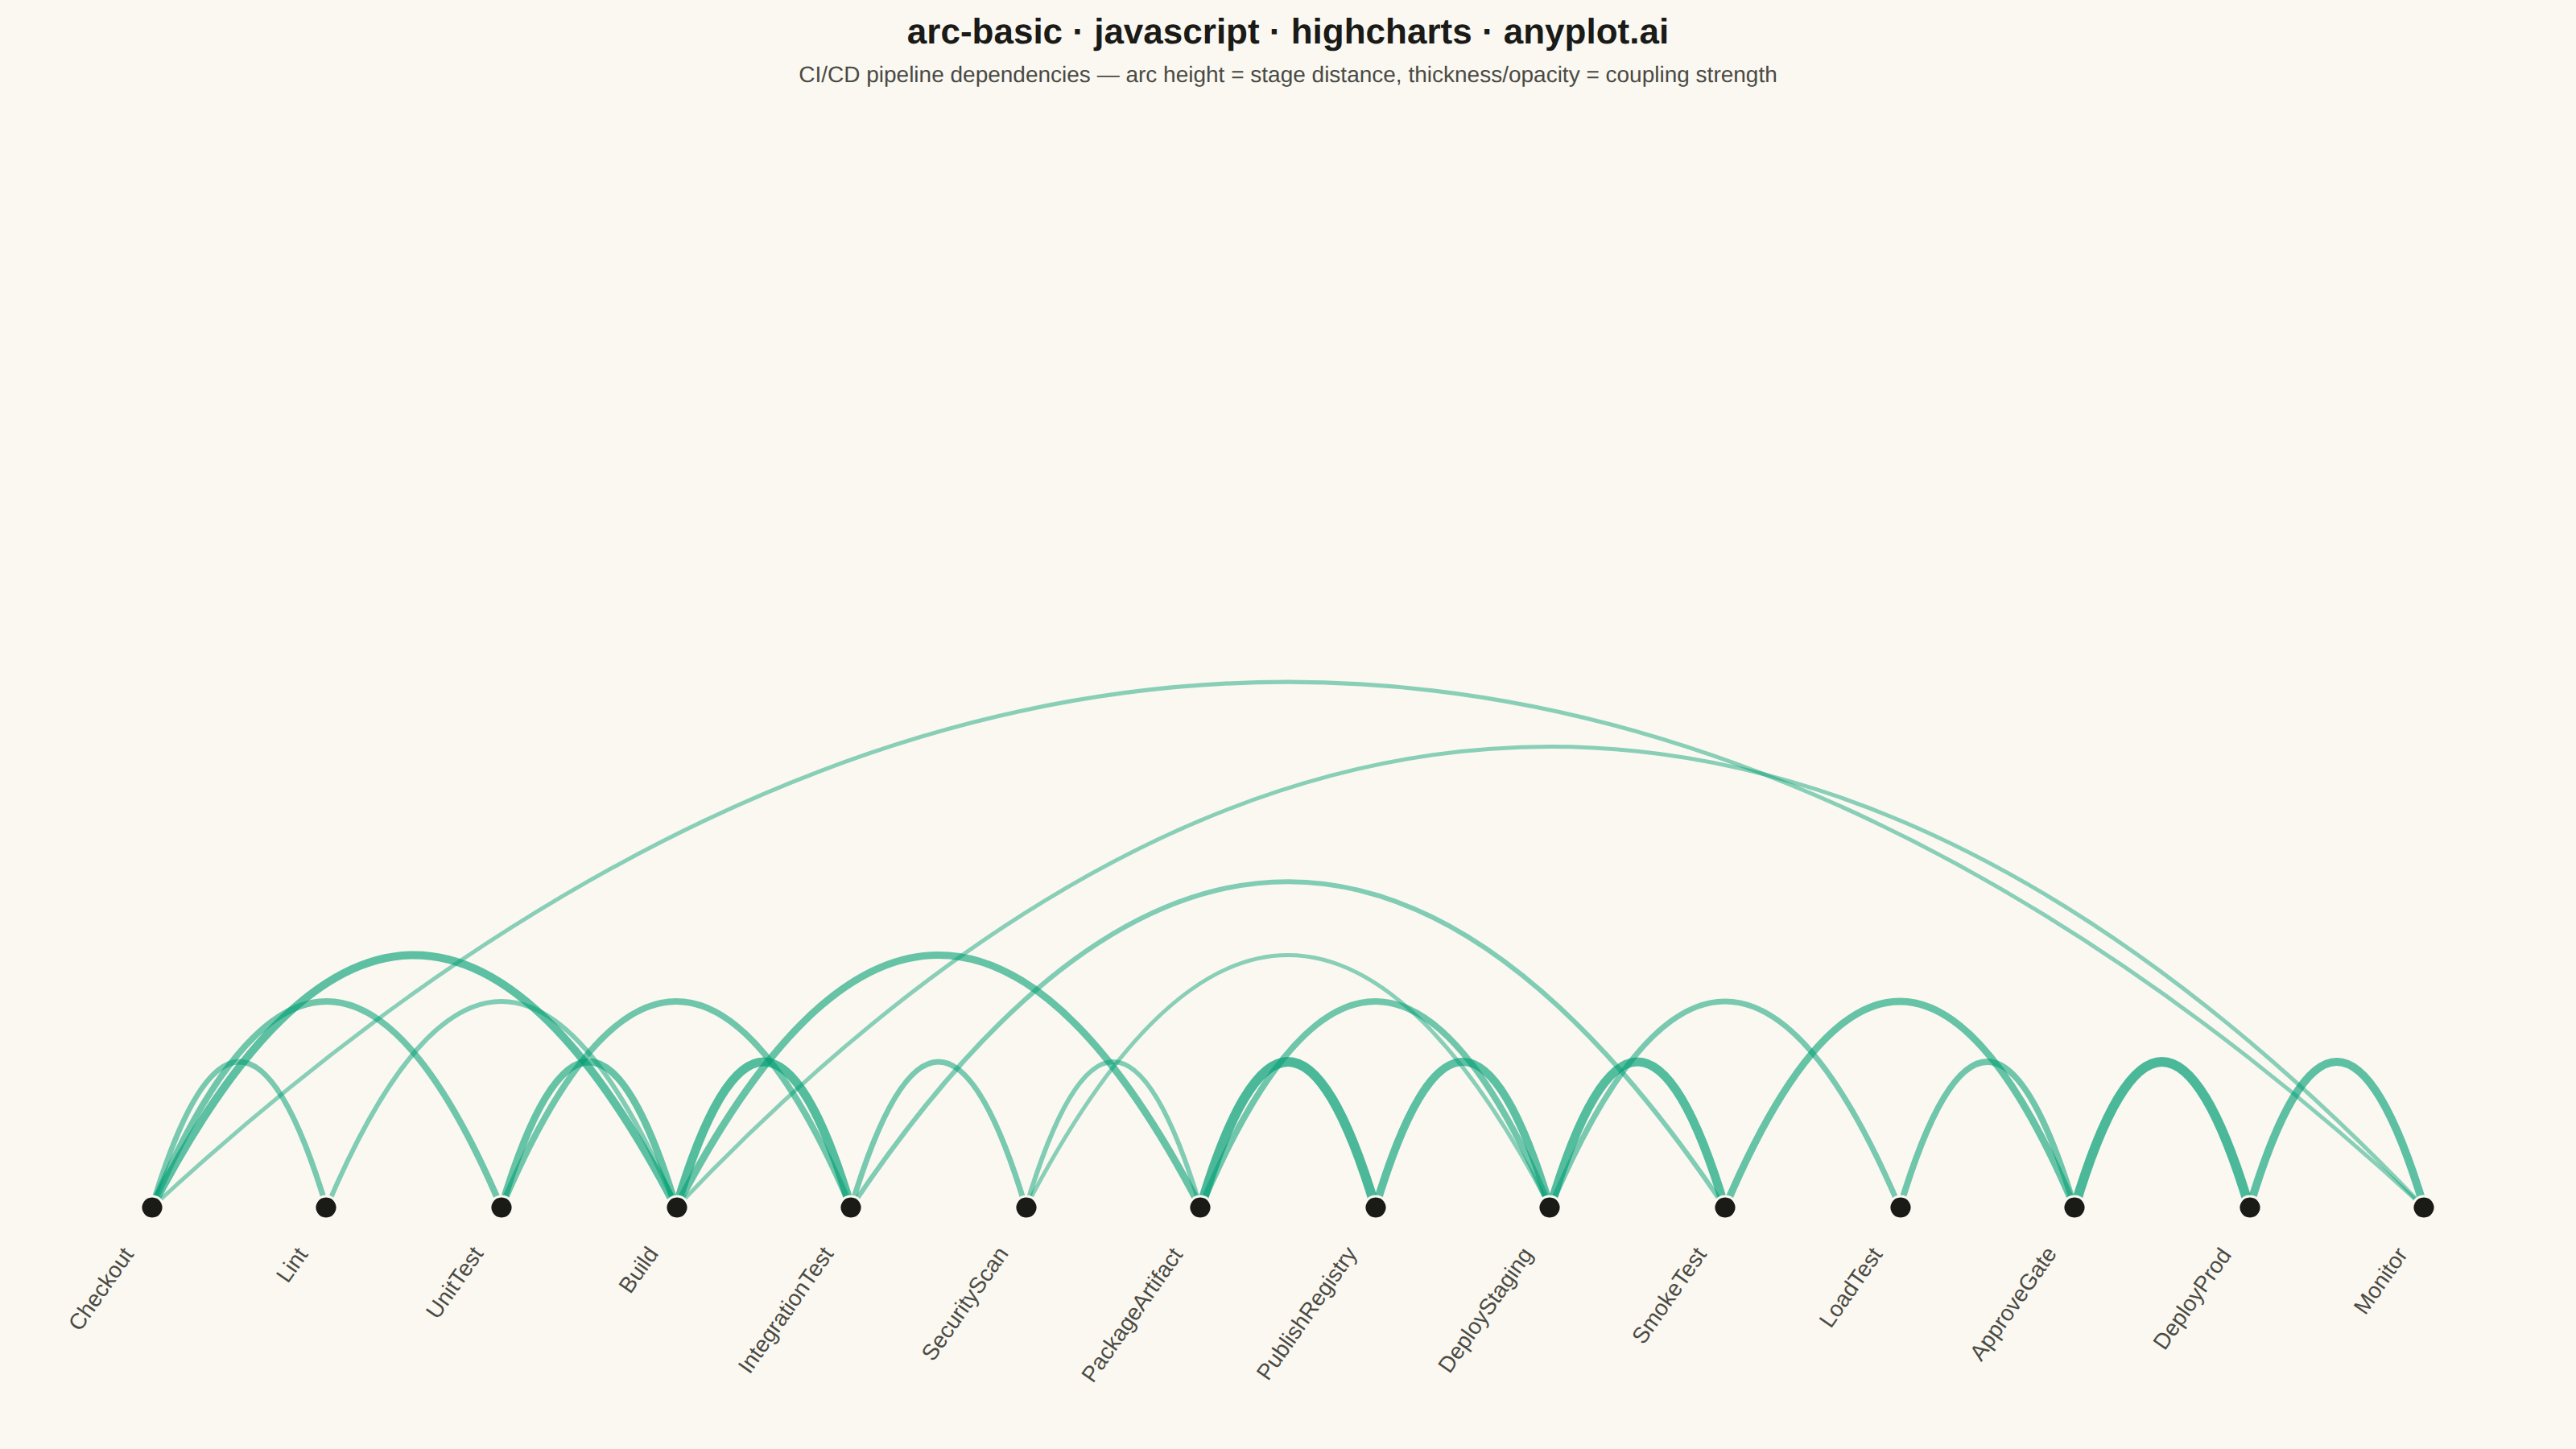
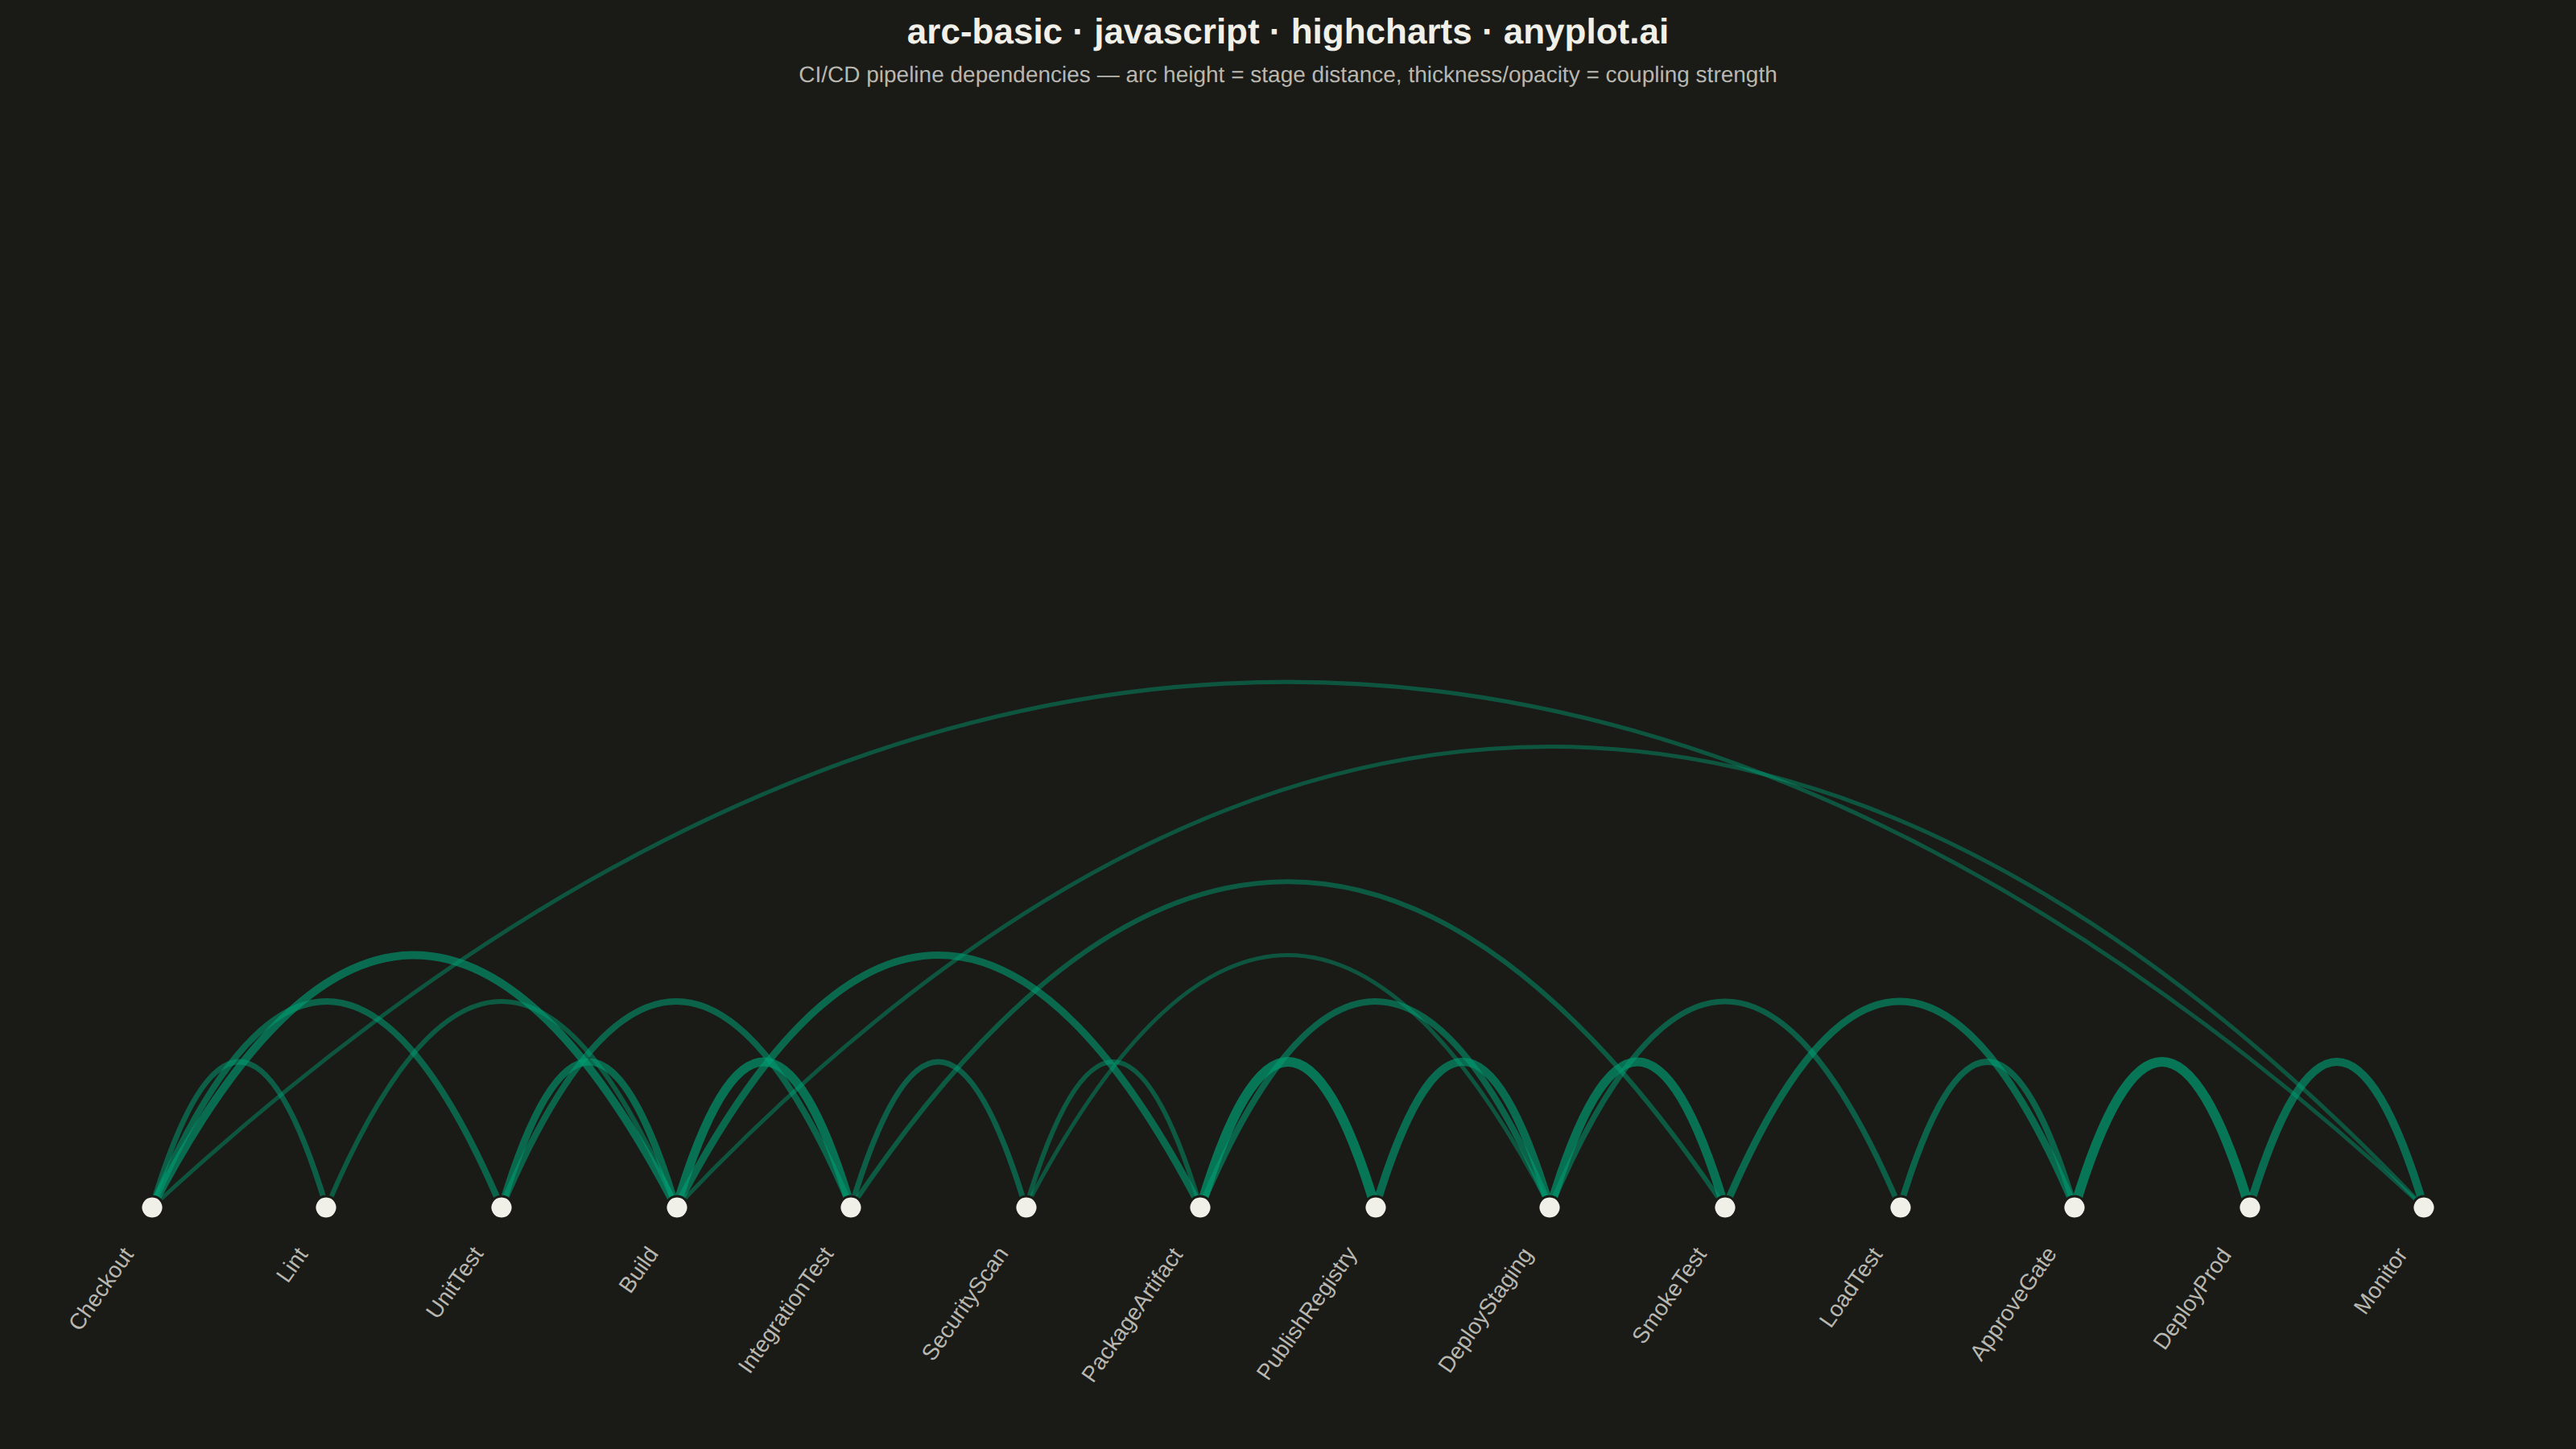
An arc diagram arranges nodes along a single horizontal line and draws connections between them as curved arcs above the line. This layout excels at revealing patterns in sequential or ordered data while minimizing visual clutter compared to force-directed layouts. Arc height typically indicates the distance between connected nodes, making it easy to spot long-range versus short-range connections.
// anyplot.ai
// arc-basic: Basic Arc Diagram
// Library: highcharts 12.6.0 | JavaScript 22.23.2
// Quality: 89/100 | Created: 2026-08-24
//# anyplot-orientation: landscape
// anyplot.ai
// arc-basic: Basic Arc Diagram
// Library: Highcharts 12.6.0 | Node 22
// License: Highcharts — commercial license, free for non-commercial use (highcharts.com/license)
// Quality: pending | Created: 2026-08-24
const t = window.ANYPLOT_TOKENS;

// --- Data (in-memory, deterministic) ----------------------------------------
const stages = [
  "Checkout", "Lint", "UnitTest", "Build", "IntegrationTest", "SecurityScan",
  "PackageArtifact", "PublishRegistry", "DeployStaging", "SmokeTest",
  "LoadTest", "ApproveGate", "DeployProd", "Monitor",
];

// [fromIndex, toIndex, couplingStrength]
const dependencies = [
  [0, 1, 4], [0, 2, 5], [0, 3, 7], [0, 13, 2],
  [1, 3, 3], [2, 3, 6], [2, 4, 5],
  [3, 4, 8], [3, 6, 6], [3, 13, 2],
  [4, 5, 4], [4, 9, 3],
  [5, 6, 3], [5, 8, 2],
  [6, 7, 9], [6, 8, 5],
  [7, 8, 7],
  [8, 9, 8], [8, 10, 4],
  [9, 11, 6], [10, 11, 5],
  [11, 12, 9],
  [12, 13, 7],
];

const nodeCount = stages.length;
const maxDistance = nodeCount - 1;
const maxWeight = Math.max(...dependencies.map((d) => d[2]));

// --- Chart -------------------------------------------------------------------
Highcharts.chart("container", {
  chart: {
    type: "scatter",
    backgroundColor: "transparent",
    animation: false,
    style: { fontFamily: "inherit" },
    marginTop: 70,
    marginBottom: 150,
    marginLeft: 40,
    marginRight: 40,
    events: {
      render() {
        const chart = this;
        if (chart.arcGroup) chart.arcGroup.destroy();
        const arcGroup = chart.renderer.g("arc-diagram").add();
        chart.arcGroup = arcGroup;

        const xAxis = chart.xAxis[0];
        const baseY = chart.plotTop + chart.plotHeight;
        const maxHeight = chart.plotHeight * 0.96;

        dependencies.forEach(([from, to, weight]) => {
          const x1 = xAxis.toPixels(from);
          const x2 = xAxis.toPixels(to);
          const distance = Math.abs(from - to);
          const arcHeight = Math.sqrt(distance / maxDistance) * maxHeight;
          const midX = (x1 + x2) / 2;
          const controlY = baseY - arcHeight;
          const strokeWidth = 1.5 + (weight / maxWeight) * 4.5;
          const opacity = 0.38 + (weight / maxWeight) * 0.32;

          chart.renderer
            .path(["M", x1, baseY, "Q", midX, controlY, x2, baseY])
            .attr({
              stroke: t.palette[0],
              "stroke-width": strokeWidth,
              fill: "none",
              opacity,
            })
            .add(arcGroup);
        });
      },
    },
  },
  credits: { enabled: false },
  title: {
    text: "arc-basic · javascript · highcharts · anyplot.ai",
    style: { color: t.ink, fontSize: "22px", fontWeight: "600" },
    margin: 40,
  },
  subtitle: {
    text: "CI/CD pipeline dependencies — arc height = stage distance, thickness/opacity = coupling strength",
    style: { color: t.inkSoft, fontSize: "14px" },
  },
  xAxis: {
    min: -0.5,
    max: nodeCount - 0.5,
    lineWidth: 0,
    tickLength: 0,
    gridLineWidth: 0,
    labels: { enabled: false },
    title: { text: null },
  },
  yAxis: {
    min: 0,
    max: 1,
    gridLineWidth: 0,
    lineWidth: 0,
    tickLength: 0,
    labels: { enabled: false },
    title: { text: null },
  },
  legend: { enabled: false },
  tooltip: { enabled: false },
  plotOptions: {
    series: { animation: false },
    scatter: {
      dataLabels: {
        enabled: true,
        format: "{point.name}",
        rotation: -55,
        align: "right",
        verticalAlign: "top",
        crop: false,
        overflow: "allow",
        y: 14,
        x: -2,
        style: {
          color: t.inkSoft,
          fontSize: "14px",
          fontWeight: "400",
          textOutline: "none",
        },
      },
    },
  },
  series: [
    {
      name: "Pipeline stages",
      data: stages.map((name, i) => ({ x: i, y: 0, name })),
      marker: {
        radius: 7,
        fillColor: t.ink,
        lineColor: t.pageBg,
        lineWidth: 1.5,
      },
    },
  ],
});
Runnable source as JSON, for any HTTP client: https://api.anyplot.ai/specs/arc-basic/highcharts/code. Any spec id and library id listed in llms-full.txt fit the same URL shape; every URL below is complete and callable.
{
  "spec_id": "arc-basic",
  "language": "javascript",
  "library": "highcharts",
  "page": "https://anyplot.ai/arc-basic/javascript/highcharts",
  "hub": "https://anyplot.ai/arc-basic",
  "code_json": "https://api.anyplot.ai/specs/arc-basic/highcharts/code",
  "spec_json": "https://api.anyplot.ai/specs/arc-basic",
  "render_light_png": "https://storage.googleapis.com/anyplot-images/plots/arc-basic/javascript/highcharts/plot-light.png",
  "render_dark_png": "https://storage.googleapis.com/anyplot-images/plots/arc-basic/javascript/highcharts/plot-dark.png",
  "interactive_light_html": "https://storage.googleapis.com/anyplot-images/plots/arc-basic/javascript/highcharts/plot-light.html",
  "interactive_dark_html": "https://storage.googleapis.com/anyplot-images/plots/arc-basic/javascript/highcharts/plot-dark.html",
  "quality_score": 89.0,
  "license": "MIT",
  "guide": "https://anyplot.ai/llms.txt"
}
Part of Basic Arc Diagram on anyplot.ai.