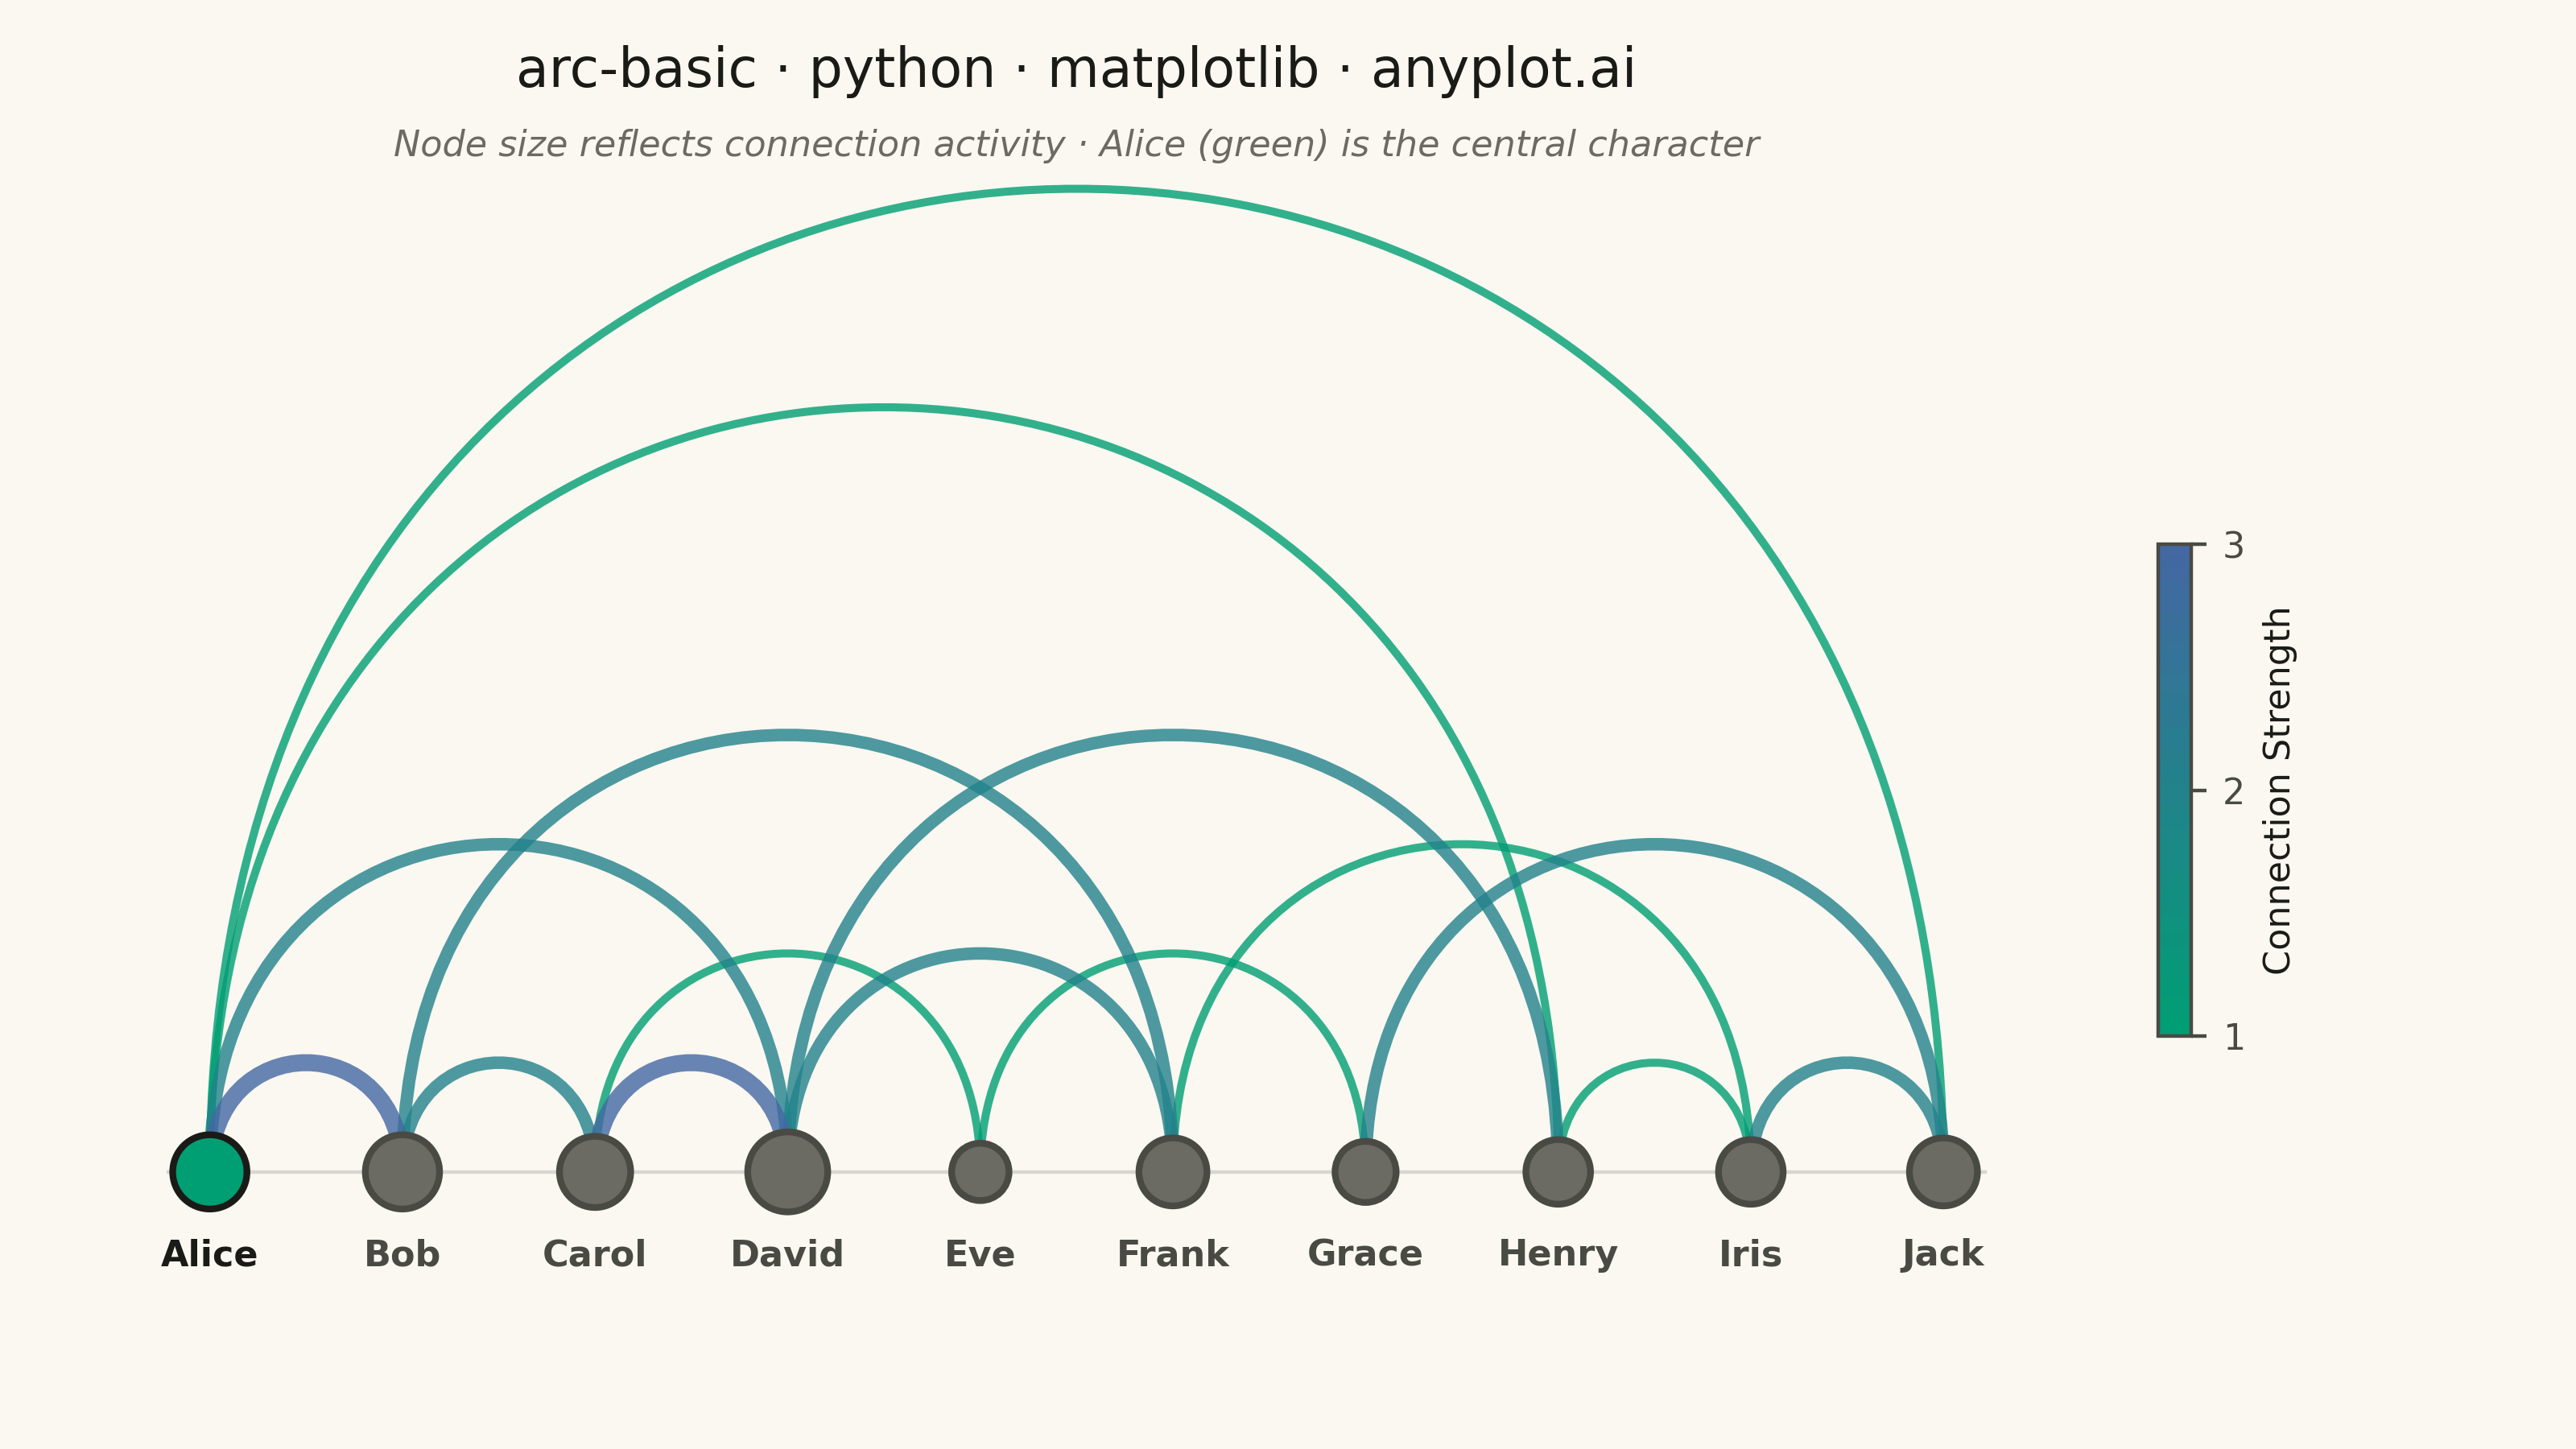
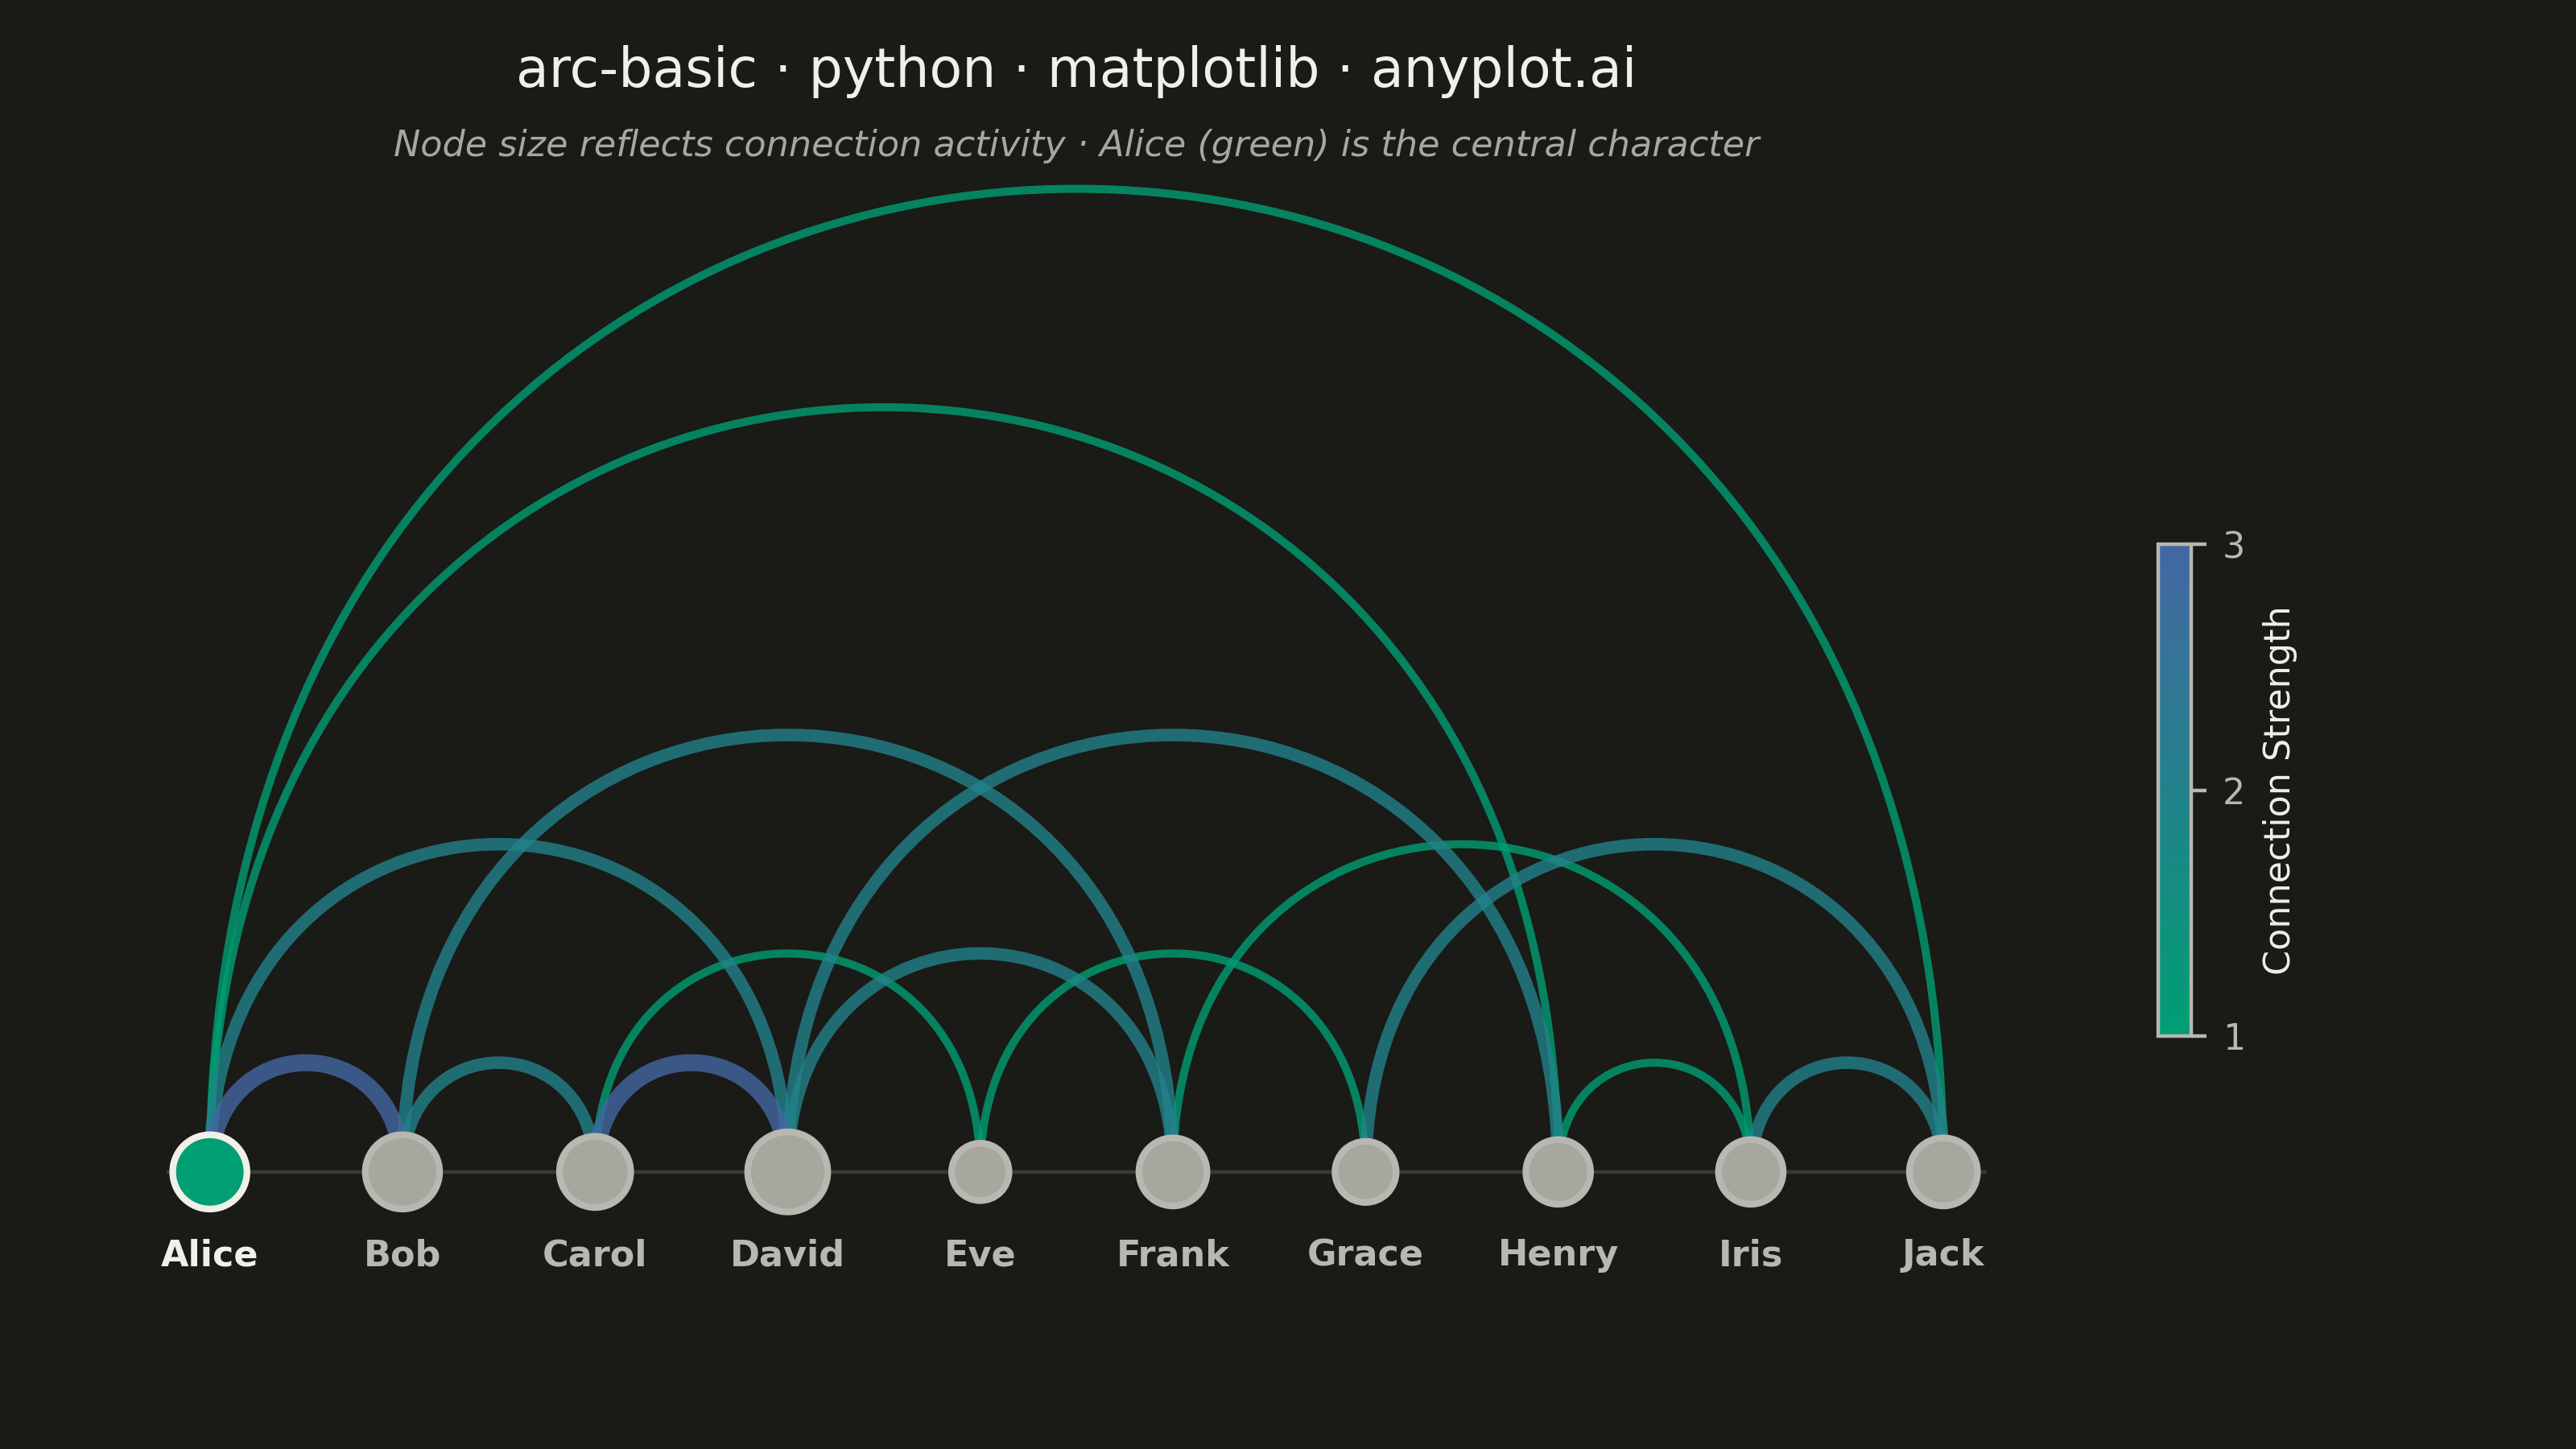
An arc diagram arranges nodes along a single horizontal line and draws connections between them as curved arcs above the line. This layout excels at revealing patterns in sequential or ordered data while minimizing visual clutter compared to force-directed layouts. Arc height typically indicates the distance between connected nodes, making it easy to spot long-range versus short-range connections.
""" anyplot.ai
arc-basic: Basic Arc Diagram
Library: matplotlib 3.10.9 | Python 3.13.13
Quality: 93/100 | Updated: 2026-05-30
"""

import os

import matplotlib.colors as mcolors
import matplotlib.patches as mpatches
import matplotlib.path as mpath
import matplotlib.pyplot as plt
import numpy as np


# Theme tokens (Imprint palette — theme-adaptive chrome)
THEME = os.getenv("ANYPLOT_THEME", "light")
PAGE_BG = "#FAF8F1" if THEME == "light" else "#1A1A17"
ELEVATED_BG = "#FFFDF6" if THEME == "light" else "#242420"
INK = "#1A1A17" if THEME == "light" else "#F0EFE8"
INK_SOFT = "#4A4A44" if THEME == "light" else "#B8B7B0"
INK_MUTED = "#6B6A63" if THEME == "light" else "#A8A79F"
BRAND = "#009E73"  # Imprint palette position 1 — ALWAYS first series

# Imprint sequential cmap for continuous arc weights (single-polarity)
imprint_seq = mcolors.LinearSegmentedColormap.from_list("imprint_seq", ["#009E73", "#4467A3"])

# Data: Character interactions in a story chapter
nodes = ["Alice", "Bob", "Carol", "David", "Eve", "Frank", "Grace", "Henry", "Iris", "Jack"]
n_nodes = len(nodes)

# Edges: (source_index, target_index, weight)
edges = [
    (0, 1, 3),  # Alice-Bob (strong)
    (0, 3, 2),  # Alice-David
    (1, 2, 2),  # Bob-Carol
    (2, 4, 1),  # Carol-Eve
    (3, 5, 2),  # David-Frank
    (4, 6, 1),  # Eve-Grace
    (0, 7, 1),  # Alice-Henry (long-range)
    (1, 5, 2),  # Bob-Frank
    (2, 3, 3),  # Carol-David (strong)
    (5, 8, 1),  # Frank-Iris
    (6, 9, 2),  # Grace-Jack
    (0, 9, 1),  # Alice-Jack (longest range)
    (3, 7, 2),  # David-Henry
    (7, 8, 1),  # Henry-Iris
    (8, 9, 2),  # Iris-Jack
]

weights = [w for _, _, w in edges]
weight_min, weight_max = min(weights), max(weights)

# Weighted node degrees for size variation (hub characters are larger)
node_degrees = [0] * n_nodes
for s, e, w in edges:
    node_degrees[s] += w
    node_degrees[e] += w

norm = mcolors.Normalize(vmin=weight_min, vmax=weight_max)

# Plot
fig, ax = plt.subplots(figsize=(8, 4.5), dpi=400, facecolor=PAGE_BG)
ax.set_facecolor(PAGE_BG)

x_positions = np.linspace(0.06, 0.90, n_nodes)
y_baseline = 0.08

# Arcs via PathPatch with cubic Bézier curves (distinctive matplotlib feature)
# Sort by weight so heavier arcs render on top
for start, end, weight in sorted(edges, key=lambda e: e[2]):
    x_start = x_positions[start]
    x_end = x_positions[end]
    distance = abs(end - start)
    peak = 0.065 * distance

    path = mpath.Path(
        [
            (x_start, y_baseline),
            (x_start, y_baseline + peak * 1.35),
            (x_end, y_baseline + peak * 1.35),
            (x_end, y_baseline),
        ],
        [mpath.Path.MOVETO, mpath.Path.CURVE4, mpath.Path.CURVE4, mpath.Path.CURVE4],
    )

    patch = mpatches.PathPatch(
        path,
        facecolor="none",
        edgecolor=imprint_seq(norm(weight)),
        linewidth=0.8 + weight * 1.0,
        alpha=0.8,
        capstyle="round",
    )
    ax.add_patch(patch)

# Node sizes proportional to weighted degree (reveals hub characters)
max_degree = max(node_degrees)
node_sizes = [120 + 200 * (d / max_degree) for d in node_degrees]

# Protagonist Alice in brand green; other characters in muted tone
node_colors = [BRAND if i == 0 else INK_MUTED for i in range(n_nodes)]
node_edge_colors = [INK if i == 0 else INK_SOFT for i in range(n_nodes)]

ax.scatter(
    x_positions,
    [y_baseline] * n_nodes,
    s=node_sizes,
    c=node_colors,
    edgecolors=node_edge_colors,
    linewidths=1.5,
    zorder=5,
)

# Node labels with typographic hierarchy
for i, (x, name) in enumerate(zip(x_positions, nodes, strict=True)):
    ax.text(
        x,
        y_baseline - 0.04,
        name,
        ha="center",
        va="top",
        fontsize=8,
        fontweight="heavy" if i == 0 else "bold",
        color=INK if i == 0 else INK_SOFT,
    )

# Colorbar for connection strength (Imprint sequential cmap)
sm = plt.cm.ScalarMappable(cmap=imprint_seq, norm=norm)
sm.set_array([])
cbar = fig.colorbar(sm, ax=ax, shrink=0.4, aspect=15, pad=0.02)
cbar.set_label("Connection Strength", fontsize=8, color=INK)
cbar.set_ticks([1, 2, 3])
cbar.ax.tick_params(labelsize=8, colors=INK_SOFT)
cbar.outline.set_edgecolor(INK_SOFT)
plt.setp(cbar.ax.yaxis.get_ticklabels(), color=INK_SOFT)

# Subtle baseline spanning the node range
ax.plot(
    [x_positions[0] - 0.02, x_positions[-1] + 0.02],
    [y_baseline, y_baseline],
    color=INK,
    linewidth=0.8,
    alpha=0.15,
    zorder=1,
)

ax.set_xlim(-0.02, 0.98)
ax.set_ylim(-0.06, 0.68)
ax.axis("off")

# Title — 44 chars, below 67-char baseline so no scaling needed
title = "arc-basic · python · matplotlib · anyplot.ai"
ax.set_title(title, fontsize=12, fontweight="medium", color=INK, pad=20)

ax.text(
    0.5,
    1.01,
    "Node size reflects connection activity · Alice (green) is the central character",
    ha="center",
    va="bottom",
    fontsize=8,
    color=INK_MUTED,
    fontstyle="italic",
    transform=ax.transAxes,
)

plt.tight_layout(pad=1.0)
plt.savefig(f"plot-{THEME}.png", dpi=400, facecolor=PAGE_BG)
Runnable source as JSON, for any HTTP client: https://api.anyplot.ai/specs/arc-basic/matplotlib/code. Any spec id and library id listed in llms-full.txt fit the same URL shape; every URL below is complete and callable.
{
  "spec_id": "arc-basic",
  "language": "python",
  "library": "matplotlib",
  "page": "https://anyplot.ai/arc-basic/python/matplotlib",
  "hub": "https://anyplot.ai/arc-basic",
  "code_json": "https://api.anyplot.ai/specs/arc-basic/matplotlib/code",
  "spec_json": "https://api.anyplot.ai/specs/arc-basic",
  "render_light_png": "https://storage.googleapis.com/anyplot-images/plots/arc-basic/python/matplotlib/plot-light.png",
  "render_dark_png": "https://storage.googleapis.com/anyplot-images/plots/arc-basic/python/matplotlib/plot-dark.png",
  "quality_score": 93.0,
  "license": "MIT",
  "guide": "https://anyplot.ai/llms.txt"
}
Part of Basic Arc Diagram on anyplot.ai.