The same plot in 14 other libraries — JavaScript: Chart.js, D3.js, Highcharts, MUI X Charts; Python: Altair, Bokeh, lets-plot, Matplotlib, Plotly, plotnine, Pygal, Seaborn; R: ggplot2; Julia: Makie.jl. Compare all 15 side by side: PCA Biplot with Scores and Loading Vectors in Python, R, Julia and JavaScript.
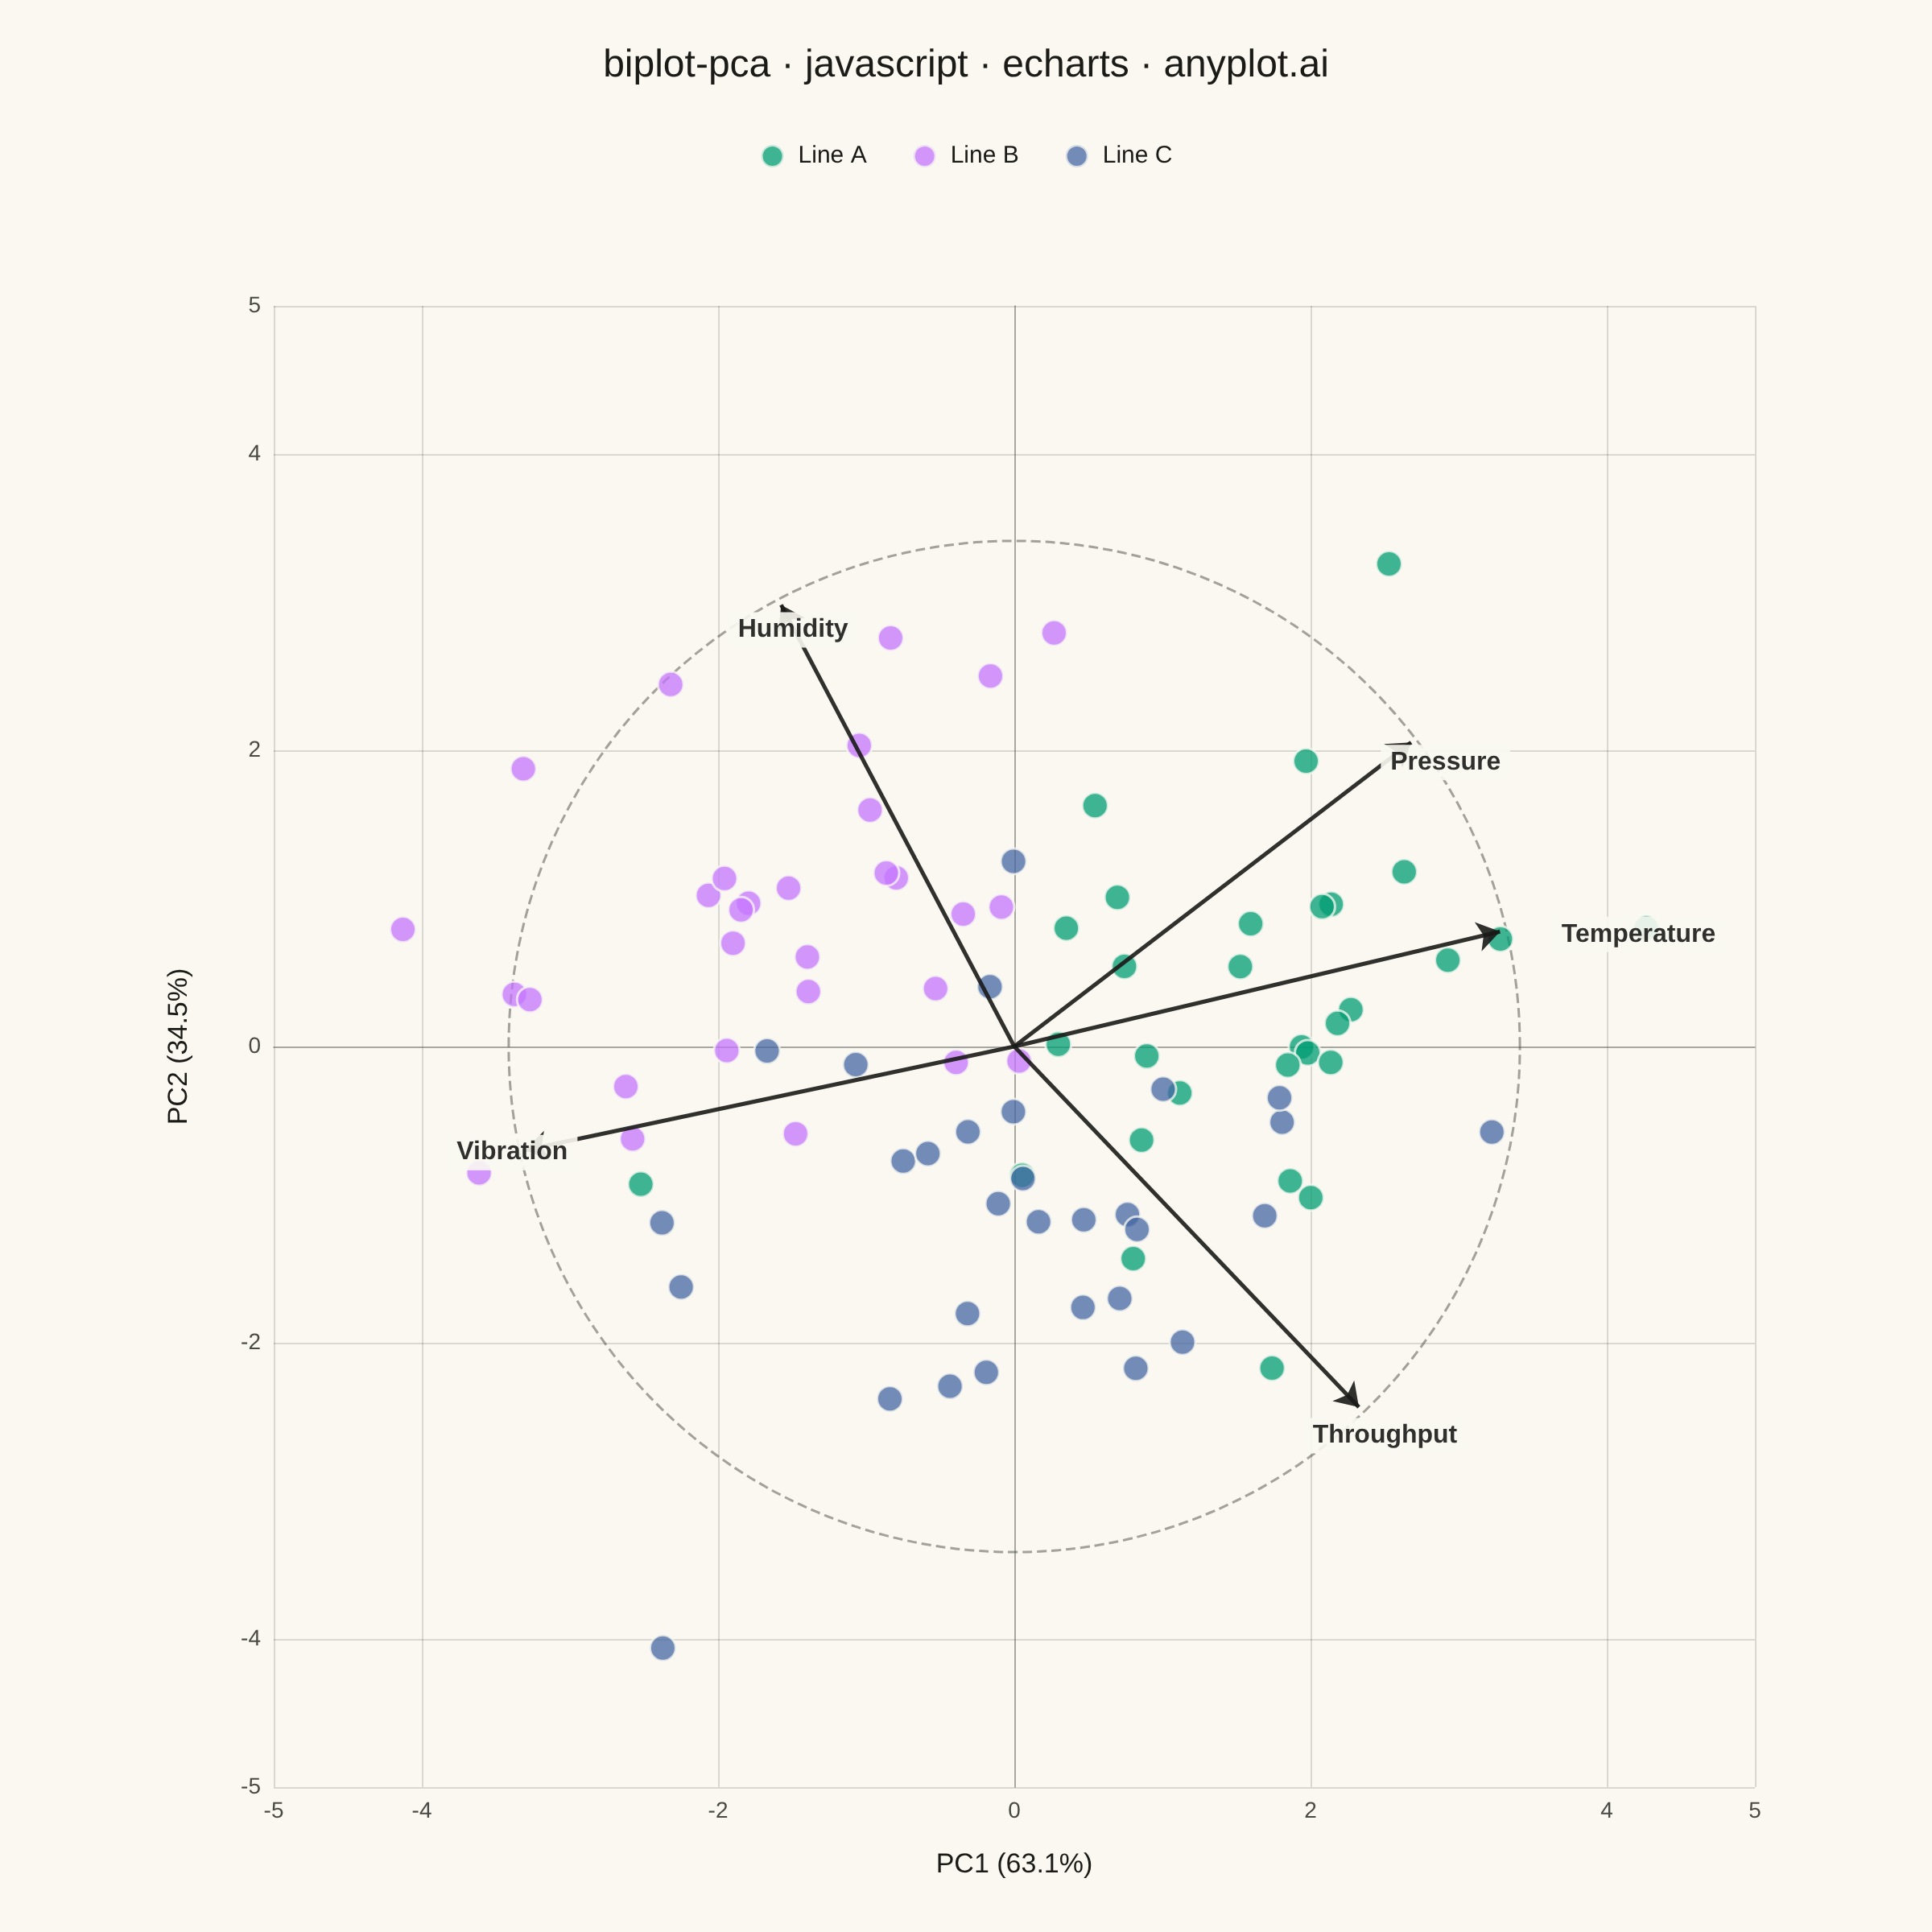
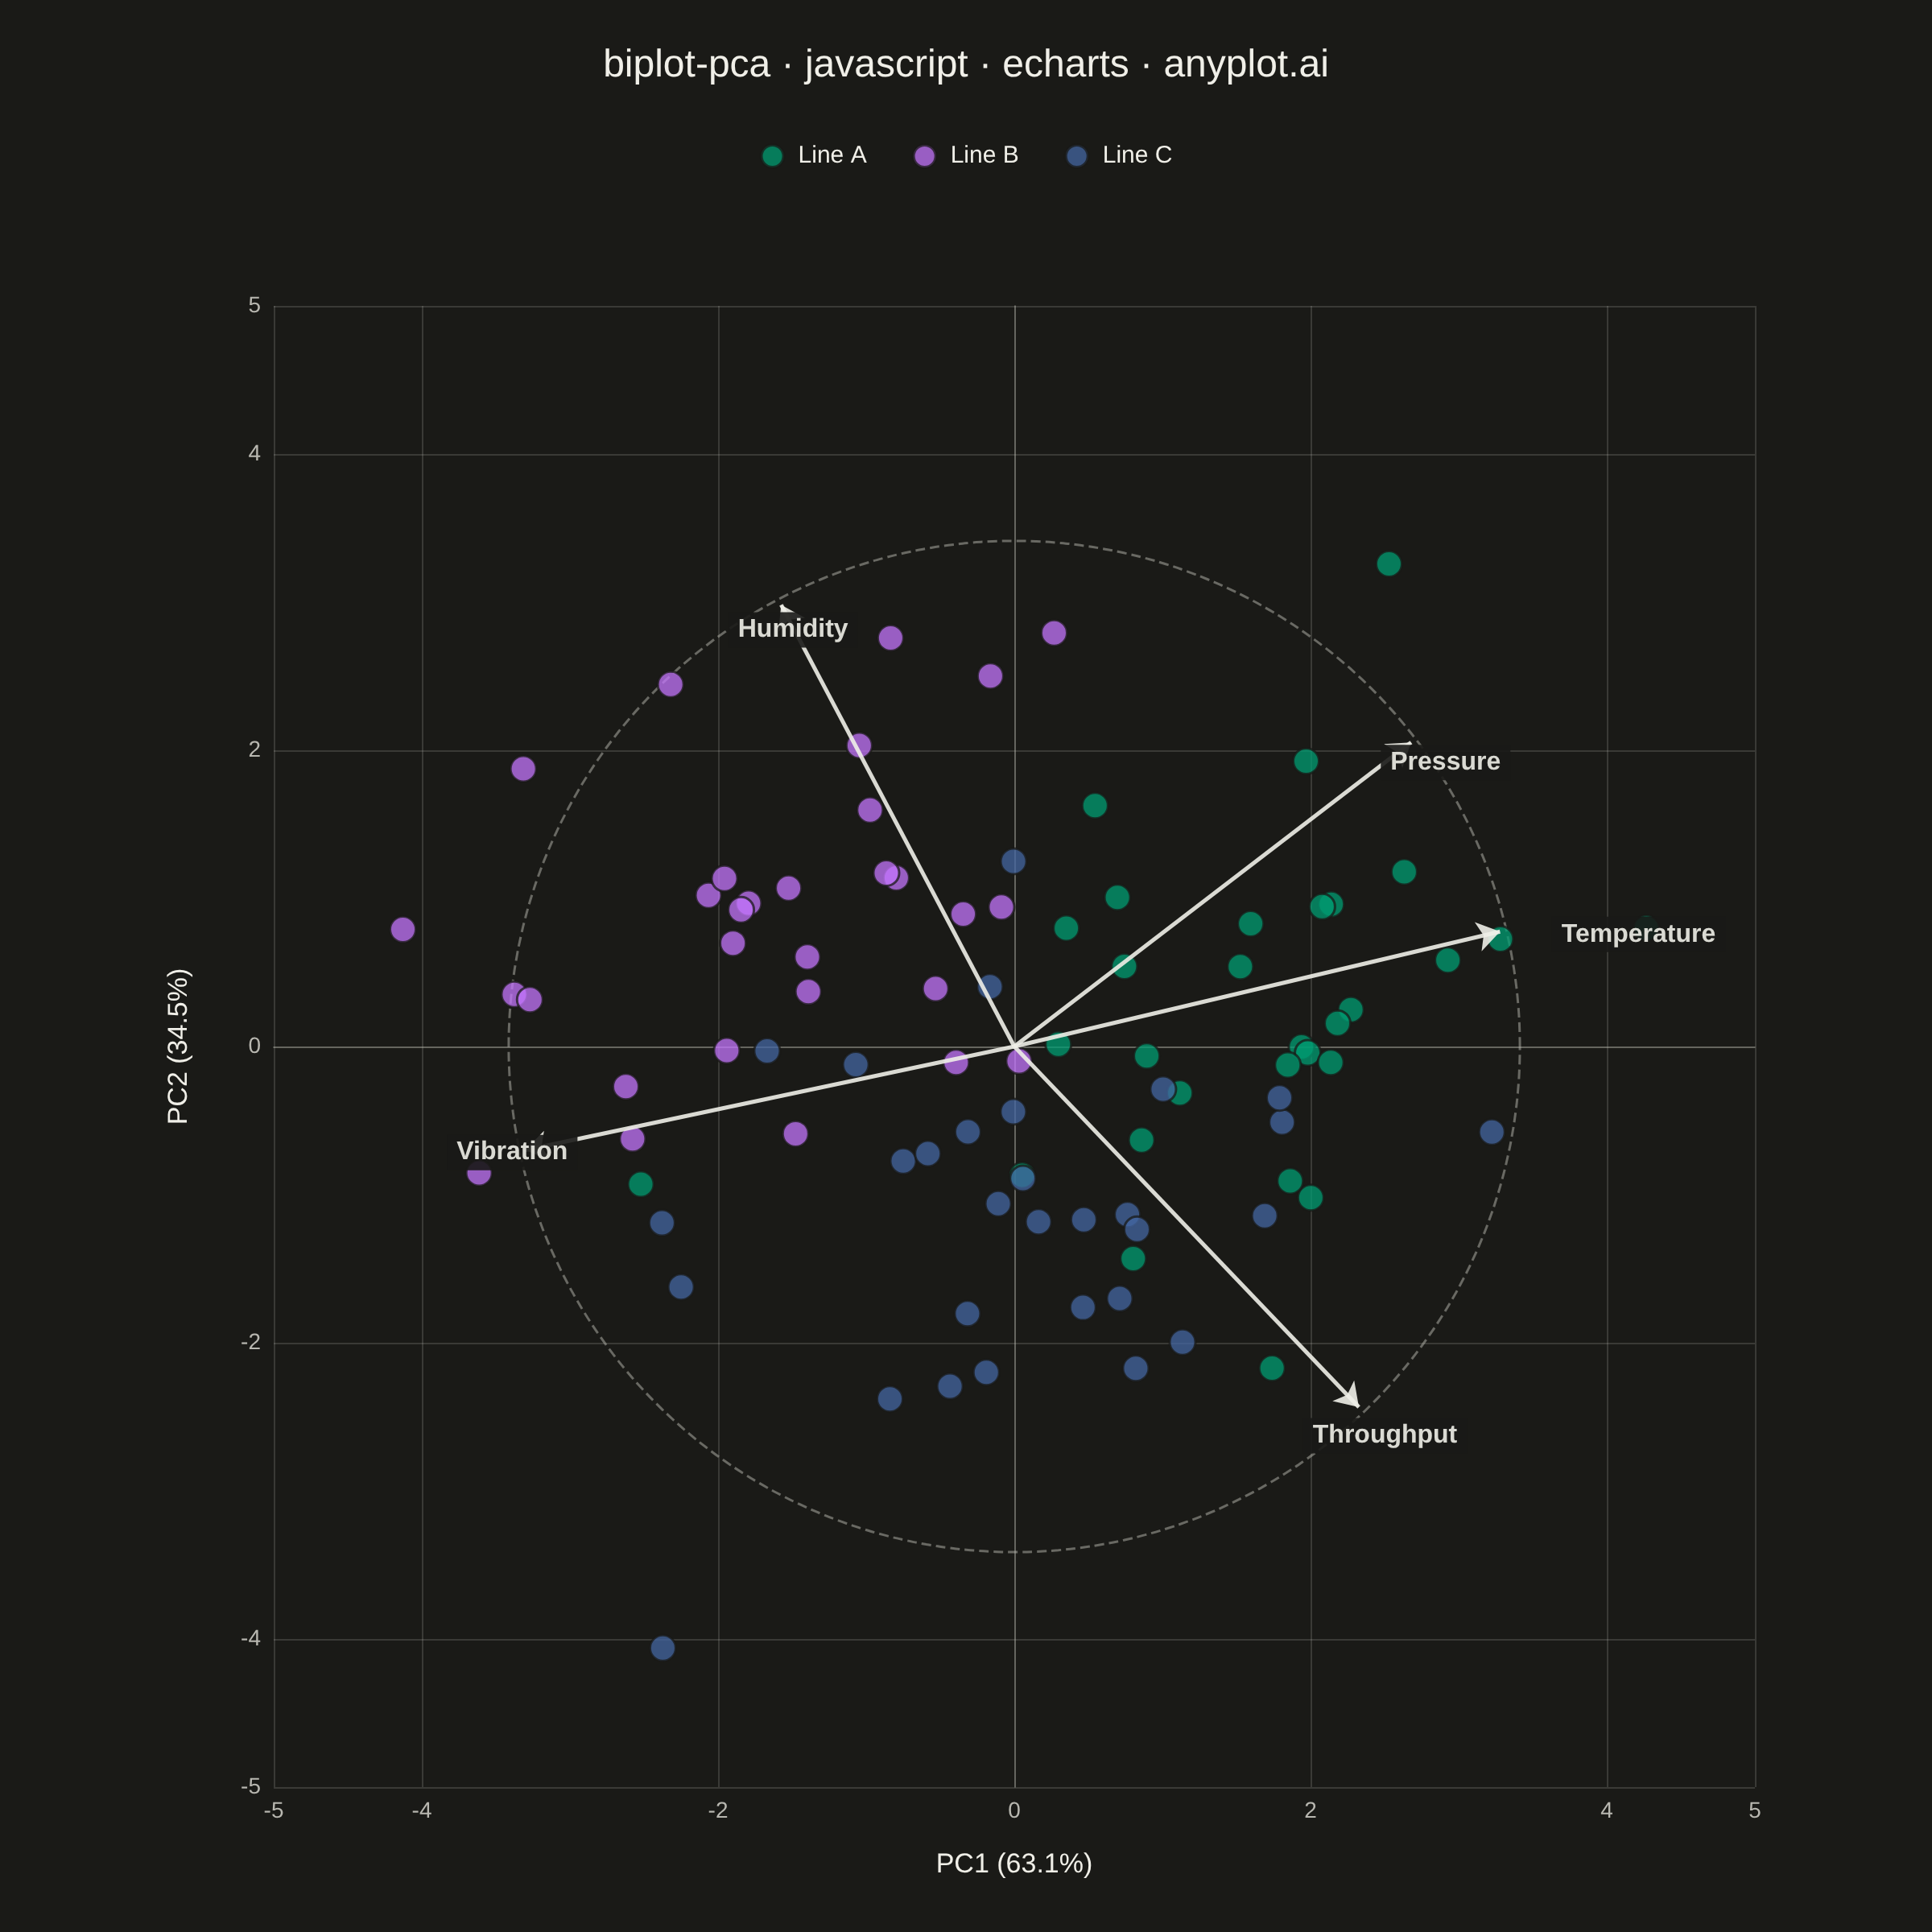
A PCA biplot simultaneously displays both observation scores (as points) and variable loadings (as arrows) in the principal component space. This dual representation is essential for interpreting PCA results, revealing how observations relate to each other and which original variables drive the separation along each principal component. The length and direction of loading arrows indicate variable importance and correlation with the components.
// anyplot.ai
// biplot-pca: PCA Biplot with Scores and Loading Vectors
// Library: echarts 6.1.0 | JavaScript 22.23.2
// Quality: 89/100 | Created: 2026-09-01
//# anyplot-orientation: square

const t = window.ANYPLOT_TOKENS;

// --- Data (in-memory, deterministic) ----------------------------------------
// Five correlated process-quality measurements from three production lines,
// generated from two latent factors so PC1/PC2 recover most of the variance.
function makeLcg(seed) {
  let state = seed % 2147483647;
  if (state <= 0) state += 2147483646;
  return function uniform() {
    state = (state * 16807) % 2147483647;
    return (state - 1) / 2147483646;
  };
}
const rand = makeLcg(42);

function randNormal() {
  const u1 = rand();
  const u2 = rand();
  return Math.sqrt(-2 * Math.log(u1)) * Math.cos(2 * Math.PI * u2);
}

const featureNames = ["Temperature", "Pressure", "Vibration", "Humidity", "Throughput"];
const groups = [
  { name: "Line A", f1: 1.6, f2: 0.0, n: 30 },
  { name: "Line B", f1: -1.1, f2: 1.3, n: 30 },
  { name: "Line C", f1: -0.2, f2: -1.4, n: 30 },
];

const rawRows = [];
const groupOf = [];
groups.forEach((g) => {
  for (let i = 0; i < g.n; i++) {
    const f1 = g.f1 + randNormal() * 0.9;
    const f2 = g.f2 + randNormal() * 0.9;
    rawRows.push([
      70 + 2.2 * f1 + 0.5 * randNormal(), // Temperature (°C)
      120 + 1.6 * f1 + 0.6 * f2 + 0.5 * randNormal(), // Pressure (kPa)
      3 - 1.8 * f1 + 0.4 * randNormal(), // Vibration (mm/s)
      45 + 1.7 * f2 + 0.5 * randNormal(), // Humidity (%)
      200 - 1.3 * f2 + 0.5 * f1 + 0.5 * randNormal(), // Throughput (units/hr)
    ]);
    groupOf.push(g.name);
  }
});

const nObs = rawRows.length;
const nFeat = featureNames.length;

// --- Standardize (z-score), then correlation matrix -------------------------
const means = featureNames.map((_, j) => rawRows.reduce((s, r) => s + r[j], 0) / nObs);
const stds = featureNames.map((_, j) => {
  const variance = rawRows.reduce((s, r) => s + (r[j] - means[j]) ** 2, 0) / (nObs - 1);
  return Math.sqrt(variance);
});
const z = rawRows.map((r) => r.map((v, j) => (v - means[j]) / stds[j]));
const corr = Array.from({ length: nFeat }, (_, i) =>
  Array.from({ length: nFeat }, (_, j) => z.reduce((s, row) => s + row[i] * row[j], 0) / (nObs - 1))
);

// --- Top-2 eigenpairs of the correlation matrix (power iteration + Hotelling
// deflation) — this is the linear algebra behind PCA, done without a library.
function matVecMul(M, v) {
  return M.map((row) => row.reduce((s, x, j) => s + x * v[j], 0));
}
function dot(a, b) {
  return a.reduce((s, x, i) => s + x * b[i], 0);
}
function powerIteration(M, dim) {
  let v = Array.from({ length: dim }, (_, i) => 1 / (i + 1));
  for (let it = 0; it < 500; it++) {
    const mv = matVecMul(M, v);
    const n = Math.sqrt(dot(mv, mv));
    v = mv.map((x) => x / n);
  }
  return { vector: v, value: dot(v, matVecMul(M, v)) };
}
const pc1 = powerIteration(corr, nFeat);
const deflated = corr.map((row, i) => row.map((x, j) => x - pc1.value * pc1.vector[i] * pc1.vector[j]));
const pc2 = powerIteration(deflated, nFeat);

// Scores = standardized data projected onto each eigenvector. Correlation
// loadings = eigenvector * sqrt(eigenvalue) — the correlation between each
// original variable and the component, which is why they fit inside the unit
// circle for a correlation-scaled biplot.
let scores1 = z.map((row) => dot(row, pc1.vector));
let scores2 = z.map((row) => dot(row, pc2.vector));
let loadings1 = pc1.vector.map((v) => v * Math.sqrt(pc1.value));
let loadings2 = pc2.vector.map((v) => v * Math.sqrt(pc2.value));

// PCA sign is mathematically arbitrary — orient axes so "Line A" reads on the
// positive PC1 side and "Line B" on the positive PC2 side.
const lineAIdx = groupOf.flatMap((g, i) => (g === "Line A" ? [i] : []));
const lineBIdx = groupOf.flatMap((g, i) => (g === "Line B" ? [i] : []));
const meanLineA1 = lineAIdx.reduce((s, i) => s + scores1[i], 0) / lineAIdx.length;
const meanLineB2 = lineBIdx.reduce((s, i) => s + scores2[i], 0) / lineBIdx.length;
if (meanLineA1 < 0) {
  scores1 = scores1.map((v) => -v);
  loadings1 = loadings1.map((v) => -v);
}
if (meanLineB2 < 0) {
  scores2 = scores2.map((v) => -v);
  loadings2 = loadings2.map((v) => -v);
}

const varRatio1 = pc1.value / nFeat;
const varRatio2 = pc2.value / nFeat;

// --- Layout: scale loadings to reach into the score cloud; equal PC1/PC2 axis
// ranges keep vector angles visually meaningful — a core biplot requirement.
const maxAbsScore = Math.max(...scores1.map(Math.abs), ...scores2.map(Math.abs));
const arrowScale = maxAbsScore * 0.8;
const axisLimit = Math.ceil(maxAbsScore * 1.15 * 10) / 10;

const circlePoints = Array.from({ length: 145 }, (_, i) => {
  const theta = (i / 144) * 2 * Math.PI;
  return [Math.cos(theta) * arrowScale, Math.sin(theta) * arrowScale];
});

const loadingsData = featureNames.map((name, j) => {
  const x = loadings1[j] * arrowScale;
  const y = loadings2[j] * arrowScale;
  const angle = Math.atan2(y, x);
  return {
    name,
    coords: [
      [0, 0],
      [x, y],
    ],
    label: {
      show: true,
      formatter: () => name,
      color: t.ink,
      fontSize: 16,
      fontWeight: 600,
      position: "end",
      distance: [Math.cos(angle) * 34, -Math.sin(angle) * 34],
      backgroundColor: t.pageBg,
      padding: [3, 6],
    },
  };
});

const groupSeries = groups.map((g, gi) => ({
  name: g.name,
  type: "scatter",
  data: scores1.flatMap((x, i) => (groupOf[i] === g.name ? [[x, scores2[i]]] : [])),
  symbolSize: 16,
  itemStyle: { color: t.palette[gi], opacity: 0.75, borderColor: t.pageBg, borderWidth: 1.5 },
  z: 5,
}));

// --- Chart --------------------------------------------------------------
const chart = echarts.init(document.getElementById("container"));
chart.setOption({
  animation: false,
  color: t.palette,
  backgroundColor: "transparent",
  title: {
    text: "biplot-pca · javascript · echarts · anyplot.ai",
    left: "center",
    top: 24,
    textStyle: { color: t.ink, fontSize: 24, fontWeight: 500 },
  },
  legend: {
    top: 84,
    left: "center",
    // Only the score groups — the loading-vector series already has its own
    // arrow labels on the plot, and its default legend swatch (a plain
    // rectangle) doesn't read as a vector, so it's dropped here.
    data: groups.map((g) => g.name),
    textStyle: { color: t.ink, fontSize: 15 },
    itemGap: 28,
    itemWidth: 22,
    itemHeight: 14,
  },
  grid: { left: 170, right: 110, top: 190, bottom: 90 },
  xAxis: {
    type: "value",
    min: -axisLimit,
    max: axisLimit,
    name: `PC1 (${(varRatio1 * 100).toFixed(1)}%)`,
    nameLocation: "middle",
    nameGap: 40,
    nameTextStyle: { color: t.ink, fontSize: 17 },
    axisLabel: { color: t.inkSoft, fontSize: 14 },
    axisLine: { onZero: true, lineStyle: { color: t.inkSoft, width: 1, opacity: 0.35 } },
    axisTick: { show: false },
    splitLine: { show: true, lineStyle: { color: t.grid } },
  },
  yAxis: {
    type: "value",
    min: -axisLimit,
    max: axisLimit,
    name: `PC2 (${(varRatio2 * 100).toFixed(1)}%)`,
    nameLocation: "middle",
    nameGap: 50,
    nameTextStyle: { color: t.ink, fontSize: 17 },
    axisLabel: { color: t.inkSoft, fontSize: 14 },
    axisLine: { onZero: true, lineStyle: { color: t.inkSoft, width: 1, opacity: 0.35 } },
    axisTick: { show: false },
    splitLine: { show: true, lineStyle: { color: t.grid } },
  },
  tooltip: {
    trigger: "item",
    backgroundColor: t.elevatedBg,
    borderColor: t.grid,
    textStyle: { color: t.ink, fontSize: 14 },
    formatter: (params) => {
      if (params.seriesType !== "scatter") return "";
      const [pc1v, pc2v] = params.value;
      return `<b>${params.seriesName}</b><br/>PC1 ${pc1v.toFixed(2)}, PC2 ${pc2v.toFixed(2)}`;
    },
  },
  series: [
    {
      type: "line",
      data: circlePoints,
      showSymbol: false,
      smooth: true,
      lineStyle: { type: "dashed", width: 1.5, color: t.inkSoft, opacity: 0.5 },
      silent: true,
      z: 1,
      tooltip: { show: false },
    },
    {
      name: "Variable loadings",
      type: "lines",
      coordinateSystem: "cartesian2d",
      data: loadingsData,
      itemStyle: { color: t.ink },
      lineStyle: { color: t.ink, width: 2.5, opacity: 0.9 },
      symbol: ["none", "arrow"],
      symbolSize: [0, 14],
      silent: true,
      z: 10,
    },
    ...groupSeries,
  ],
});
Runnable source as JSON, for any HTTP client: https://api.anyplot.ai/specs/biplot-pca/echarts/code. Any spec id and library id listed in llms-full.txt fit the same URL shape; every URL below is complete and callable.
{
  "spec_id": "biplot-pca",
  "language": "javascript",
  "library": "echarts",
  "page": "https://anyplot.ai/biplot-pca/javascript/echarts",
  "hub": "https://anyplot.ai/biplot-pca",
  "code_json": "https://api.anyplot.ai/specs/biplot-pca/echarts/code",
  "spec_json": "https://api.anyplot.ai/specs/biplot-pca",
  "render_light_png": "https://storage.googleapis.com/anyplot-images/plots/biplot-pca/javascript/echarts/plot-light.png",
  "render_dark_png": "https://storage.googleapis.com/anyplot-images/plots/biplot-pca/javascript/echarts/plot-dark.png",
  "interactive_light_html": "https://storage.googleapis.com/anyplot-images/plots/biplot-pca/javascript/echarts/plot-light.html",
  "interactive_dark_html": "https://storage.googleapis.com/anyplot-images/plots/biplot-pca/javascript/echarts/plot-dark.html",
  "quality_score": 89.0,
  "license": "MIT",
  "guide": "https://anyplot.ai/llms.txt"
}
Part of PCA Biplot with Scores and Loading Vectors on anyplot.ai.