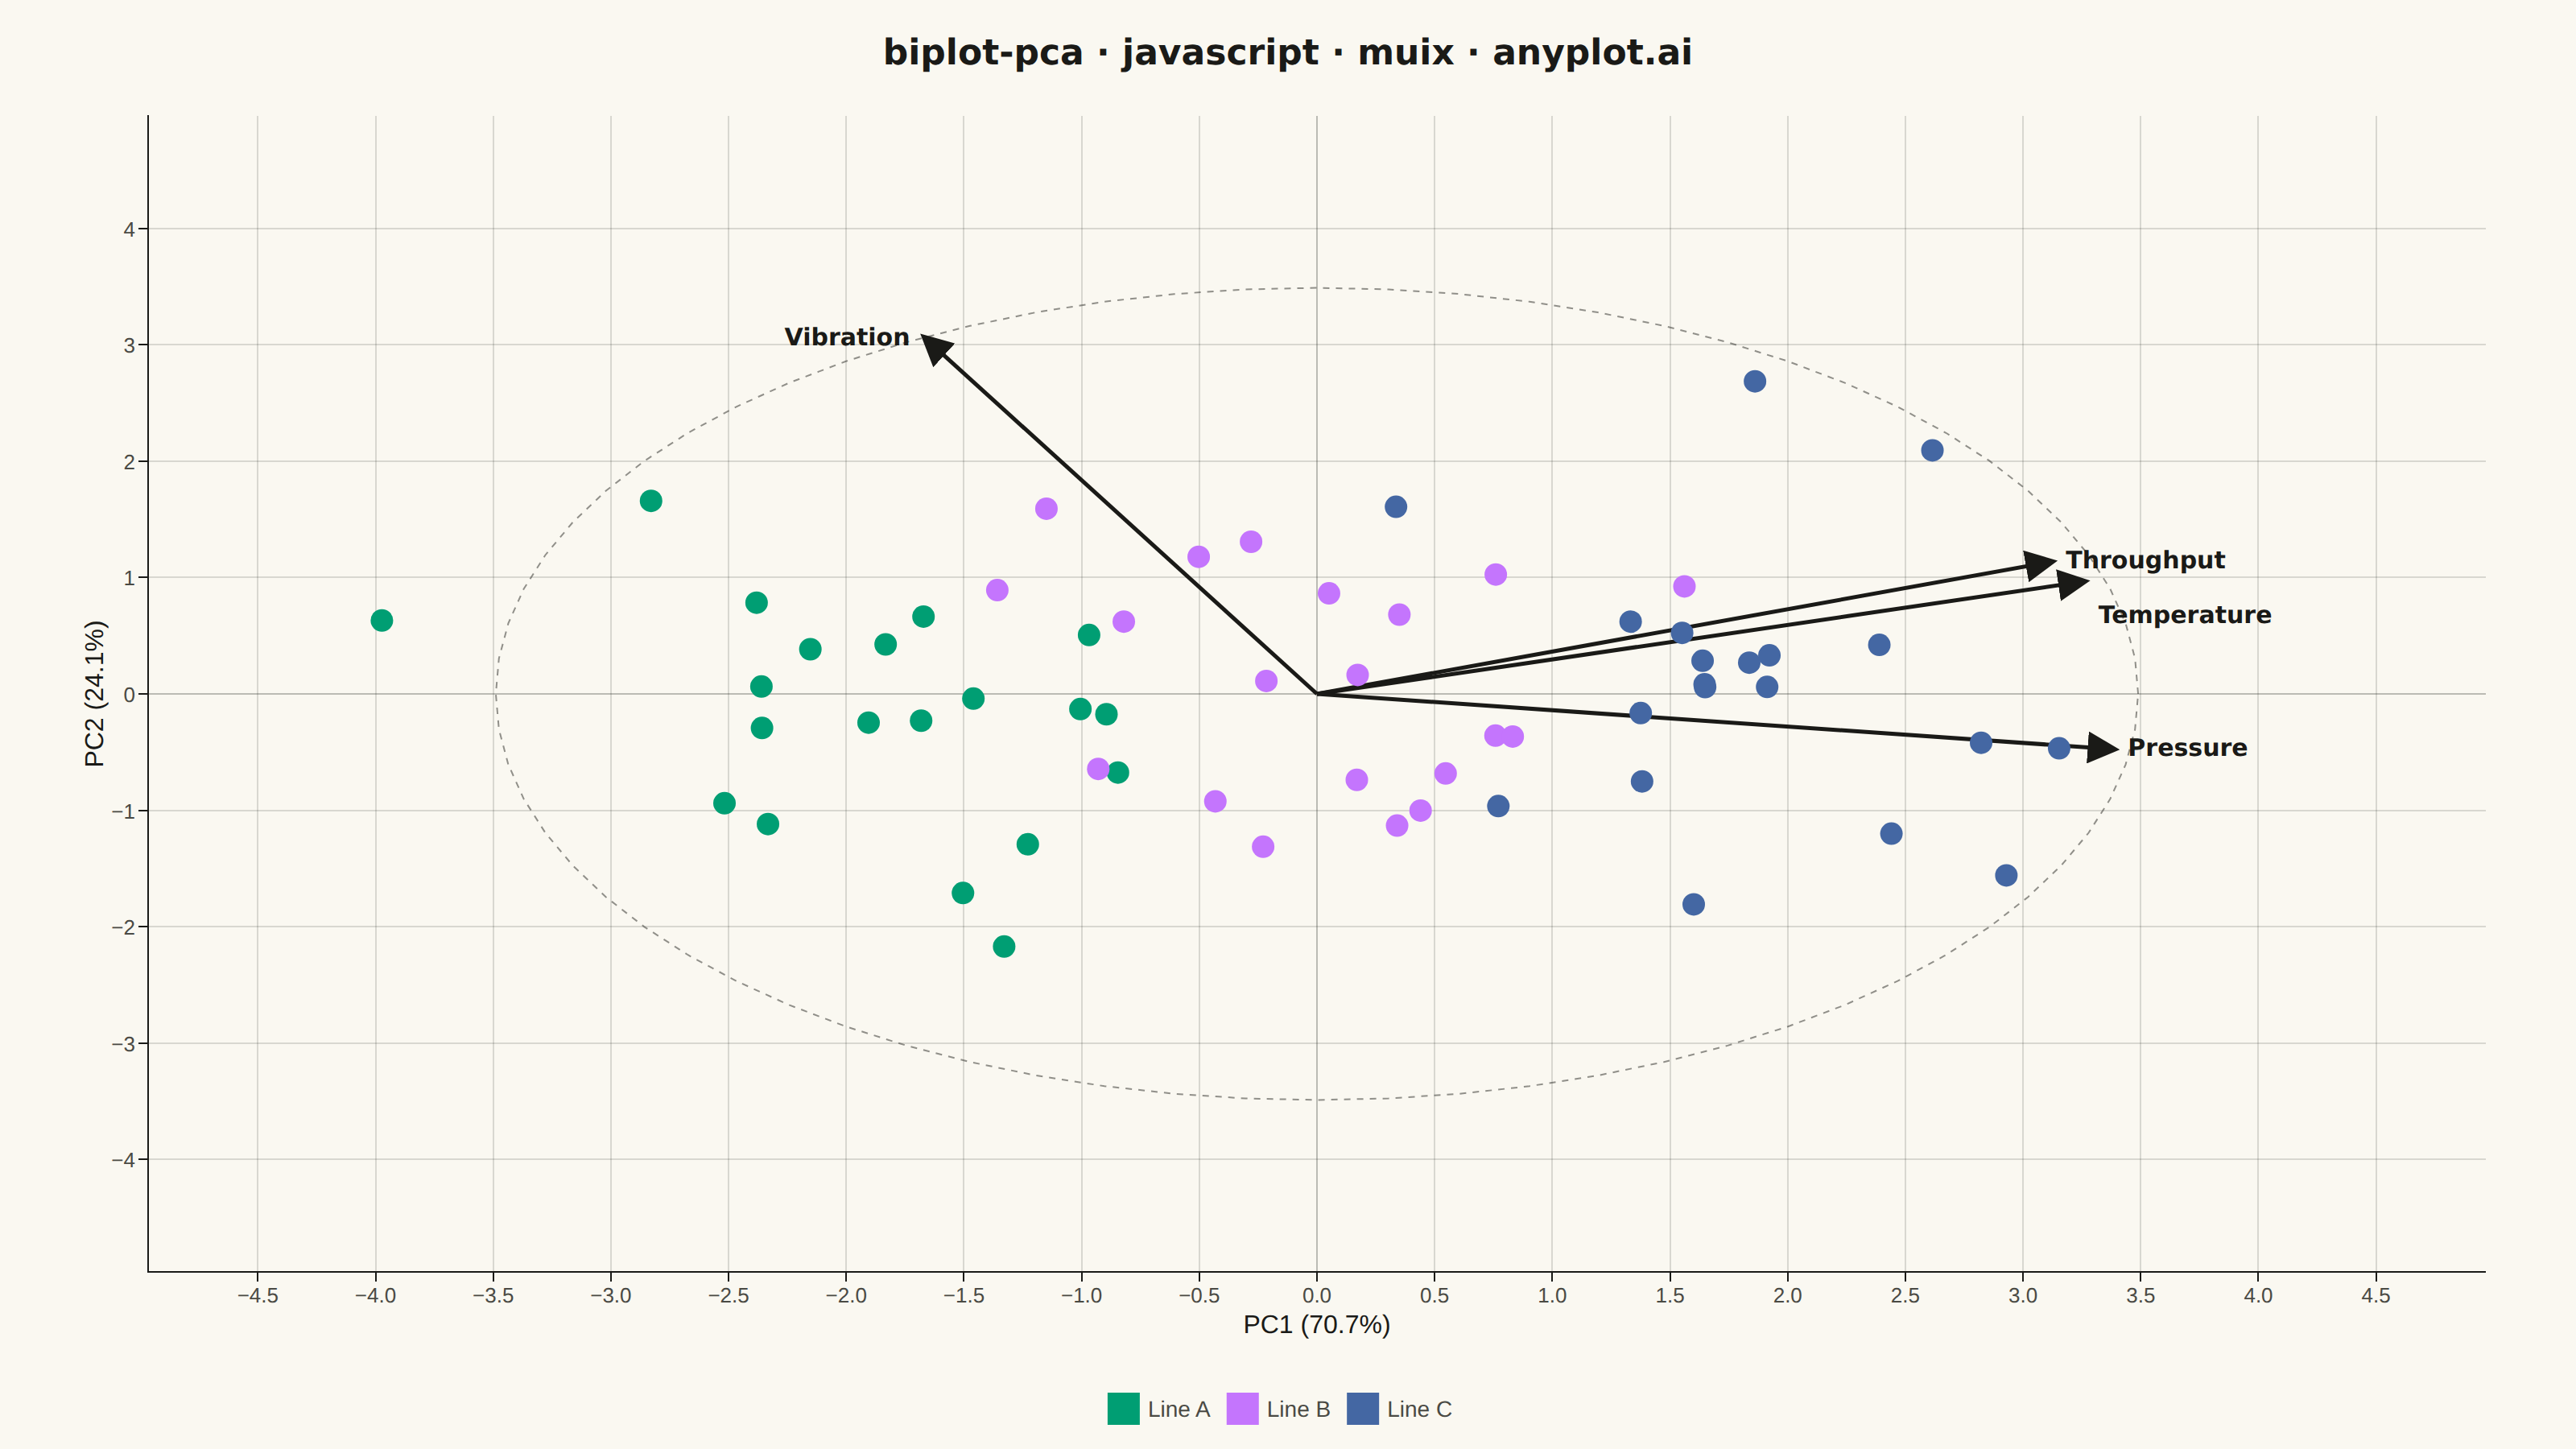
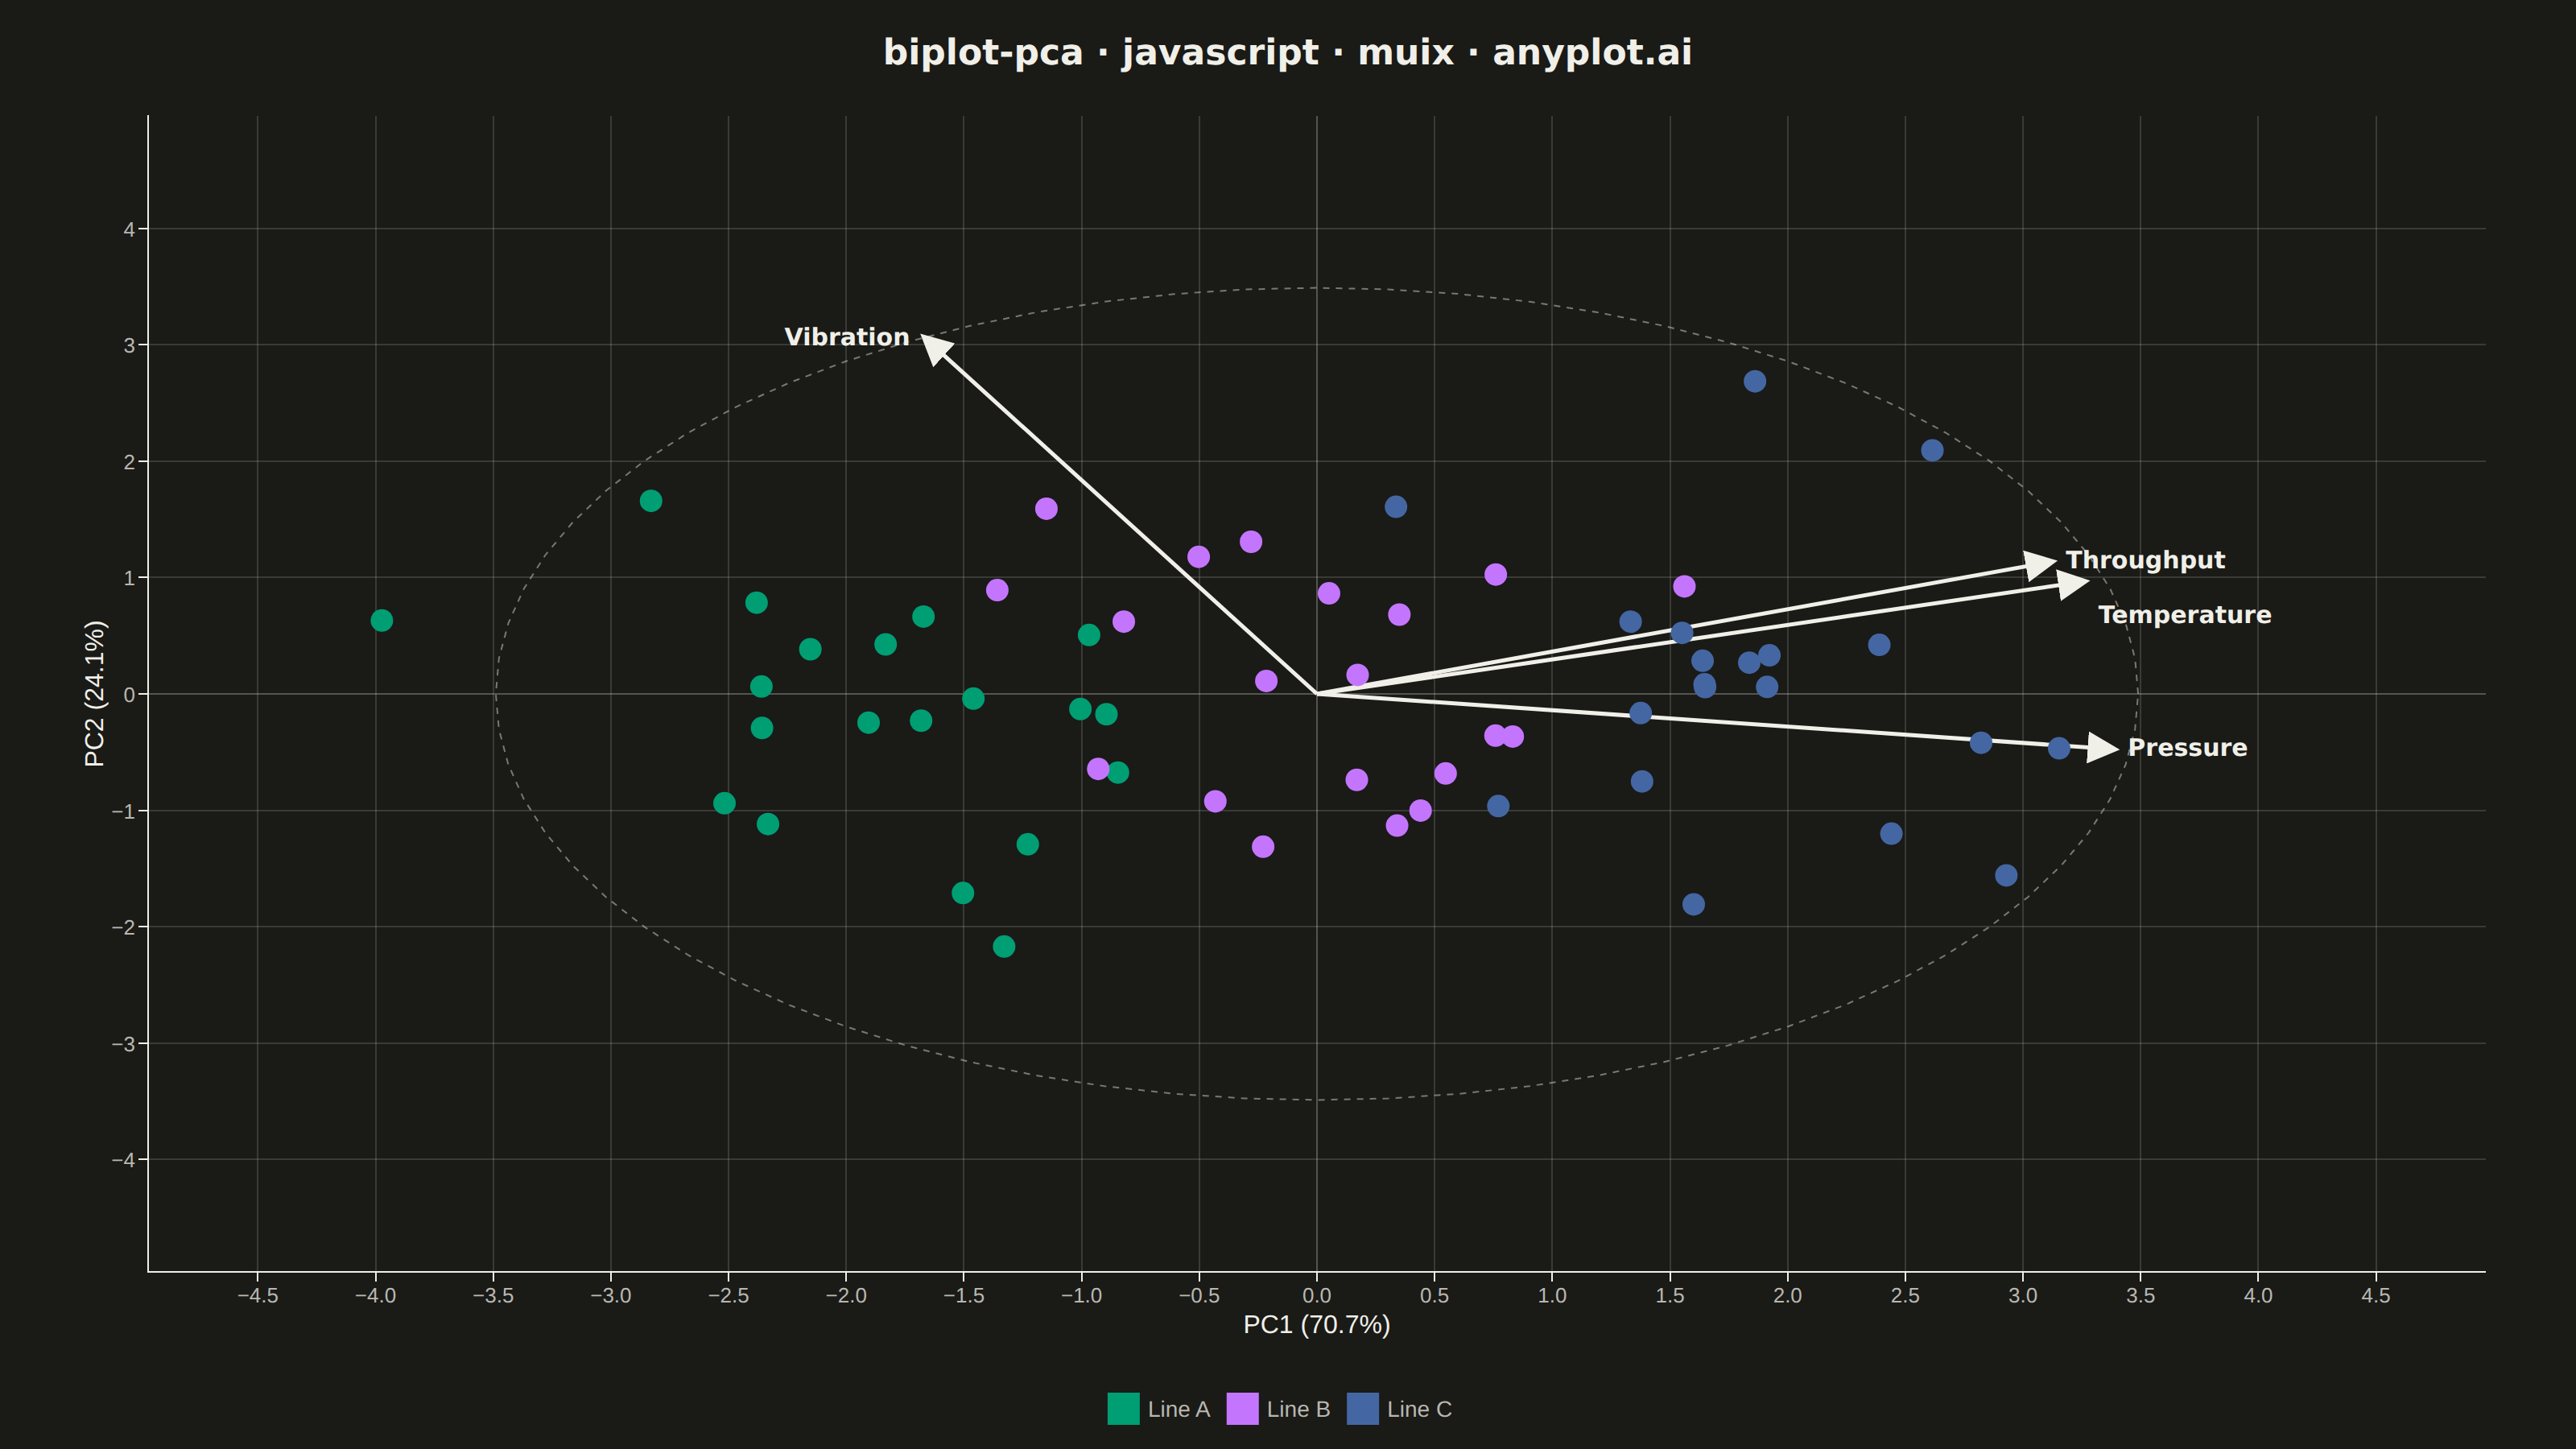
The same plot in 14 other libraries — JavaScript: Chart.js, D3.js, Apache ECharts, Highcharts; Python: Altair, Bokeh, lets-plot, Matplotlib, Plotly, plotnine, Pygal, Seaborn; R: ggplot2; Julia: Makie.jl. Compare all 15 side by side: PCA Biplot with Scores and Loading Vectors in Python, R, Julia and JavaScript.
A PCA biplot simultaneously displays both observation scores (as points) and variable loadings (as arrows) in the principal component space. This dual representation is essential for interpreting PCA results, revealing how observations relate to each other and which original variables drive the separation along each principal component. The length and direction of loading arrows indicate variable importance and correlation with the components.
// anyplot.ai
// biplot-pca: PCA Biplot with Scores and Loading Vectors
// Library: muix 7.29.1 | JavaScript 22.23.2
// Quality: 88/100 | Created: 2026-09-01
//# anyplot-orientation: landscape
// anyplot.ai
// biplot-pca: PCA Biplot with Scores and Loading Vectors
// Library: MUI X Charts | React | Node 22
// License: @mui/x-charts — MIT (community). Pro/Premium are out of scope.
// Quality: pending | Created: 2026-09-01
import { ChartContainer } from "@mui/x-charts/ChartContainer";
import { ScatterPlot } from "@mui/x-charts/ScatterChart";
import { ChartsXAxis } from "@mui/x-charts/ChartsXAxis";
import { ChartsYAxis } from "@mui/x-charts/ChartsYAxis";
import { ChartsGrid } from "@mui/x-charts/ChartsGrid";
import { ChartsLegend } from "@mui/x-charts/ChartsLegend";
import { ChartsTooltip } from "@mui/x-charts/ChartsTooltip";
import { useXScale, useYScale } from "@mui/x-charts/hooks";

const t = window.ANYPLOT_TOKENS;
const size = window.ANYPLOT_SIZE;

// --- Deterministic PRNG (LCG + Box-Muller, no seeded RNG in the browser) ----
function createLcg(seed) {
  let state = seed;
  return function nextUniform() {
    state = (state * 16807) % 2147483647;
    return (state - 1) / 2147483646;
  };
}
const nextUniform = createLcg(42);
function nextGaussian() {
  const u1 = Math.max(nextUniform(), 1e-9);
  const u2 = nextUniform();
  return Math.sqrt(-2 * Math.log(u1)) * Math.cos(2 * Math.PI * u2);
}

// --- Data: simulated production-line QC sensor readings (4 correlated vars) -
const PRODUCTION_LINES = ["Line A", "Line B", "Line C"];
const LINE_BATCH_OFFSETS = [-1.4, 0, 1.4];
const OBSERVATIONS_PER_LINE = 20;
const VARIABLE_NAMES = ["Temperature", "Pressure", "Vibration", "Throughput"];
const FEATURE_KEYS = ["temperature", "pressure", "vibration", "throughput"];

const observations = [];
PRODUCTION_LINES.forEach((line, lineIndex) => {
  for (let i = 0; i < OBSERVATIONS_PER_LINE; i += 1) {
    // Two independent latent drivers behind the four sensor readings: process
    // intensity separates the lines, calibration drift varies within a line.
    const processIntensity = LINE_BATCH_OFFSETS[lineIndex] + nextGaussian() * 0.5;
    const calibrationDrift = nextGaussian();
    observations.push({
      line,
      temperature:
        68 + 4.2 * processIntensity + 1.0 * calibrationDrift + nextGaussian() * 1.4, // deg C
      pressure:
        120 + 5.5 * processIntensity - 2.4 * calibrationDrift + nextGaussian() * 1.8, // kPa
      vibration:
        3.2 - 1.2 * processIntensity + 2.6 * calibrationDrift + nextGaussian() * 0.35, // mm/s
      throughput:
        480 + 6.0 * processIntensity + 0.6 * calibrationDrift + nextGaussian() * 4.5, // units/min
    });
  }
});
const sampleCount = observations.length;
const featureCount = FEATURE_KEYS.length;

// --- Standardize each variable to mean 0 / unit variance ---------------------
const featureMeans = FEATURE_KEYS.map(
  (key) => observations.reduce((sum, row) => sum + row[key], 0) / sampleCount
);
const featureStds = FEATURE_KEYS.map((key, j) =>
  Math.sqrt(
    observations.reduce((sum, row) => sum + (row[key] - featureMeans[j]) ** 2, 0) /
      sampleCount
  )
);
const standardized = observations.map((row) =>
  FEATURE_KEYS.map((key, j) => (row[key] - featureMeans[j]) / featureStds[j])
);

// --- Correlation matrix (covariance of standardized data) -------------------
const correlationMatrix = Array.from({ length: featureCount }, (_, rowIdx) =>
  Array.from({ length: featureCount }, (_, colIdx) => {
    let sum = 0;
    for (let obs = 0; obs < sampleCount; obs += 1) {
      sum += standardized[obs][rowIdx] * standardized[obs][colIdx];
    }
    return sum / sampleCount;
  })
);

// --- Jacobi eigenvalue decomposition (symmetric matrices only) --------------
function jacobiEigen(inputMatrix) {
  const matrixSize = inputMatrix.length;
  const workingMatrix = inputMatrix.map((row) => row.slice());
  const eigenvectorMatrix = Array.from({ length: matrixSize }, (_, rowIdx) =>
    Array.from({ length: matrixSize }, (_, colIdx) => (rowIdx === colIdx ? 1 : 0))
  );

  for (let sweep = 0; sweep < 100; sweep += 1) {
    let offDiagonalMagnitude = 0;
    for (let rowIdx = 0; rowIdx < matrixSize; rowIdx += 1) {
      for (let colIdx = rowIdx + 1; colIdx < matrixSize; colIdx += 1) {
        offDiagonalMagnitude += workingMatrix[rowIdx][colIdx] ** 2;
      }
    }
    if (offDiagonalMagnitude < 1e-12) break;

    for (let p = 0; p < matrixSize; p += 1) {
      for (let q = p + 1; q < matrixSize; q += 1) {
        if (Math.abs(workingMatrix[p][q]) < 1e-12) continue;
        const theta = (workingMatrix[q][q] - workingMatrix[p][p]) / (2 * workingMatrix[p][q]);
        const tan = Math.sign(theta || 1) / (Math.abs(theta) + Math.sqrt(theta * theta + 1));
        const cos = 1 / Math.sqrt(tan * tan + 1);
        const sin = tan * cos;
        const app = workingMatrix[p][p];
        const aqq = workingMatrix[q][q];
        const apq = workingMatrix[p][q];
        workingMatrix[p][p] = cos * cos * app - 2 * sin * cos * apq + sin * sin * aqq;
        workingMatrix[q][q] = sin * sin * app + 2 * sin * cos * apq + cos * cos * aqq;
        workingMatrix[p][q] = 0;
        workingMatrix[q][p] = 0;
        for (let k = 0; k < matrixSize; k += 1) {
          if (k !== p && k !== q) {
            const akp = workingMatrix[k][p];
            const akq = workingMatrix[k][q];
            workingMatrix[k][p] = cos * akp - sin * akq;
            workingMatrix[p][k] = workingMatrix[k][p];
            workingMatrix[k][q] = sin * akp + cos * akq;
            workingMatrix[q][k] = workingMatrix[k][q];
          }
        }
        for (let k = 0; k < matrixSize; k += 1) {
          const vkp = eigenvectorMatrix[k][p];
          const vkq = eigenvectorMatrix[k][q];
          eigenvectorMatrix[k][p] = cos * vkp - sin * vkq;
          eigenvectorMatrix[k][q] = sin * vkp + cos * vkq;
        }
      }
    }
  }

  const eigenvalues = workingMatrix.map((row, i) => row[i]);
  return { eigenvalues, eigenvectors: eigenvectorMatrix };
}

const { eigenvalues, eigenvectors } = jacobiEigen(correlationMatrix);
const componentOrder = eigenvalues
  .map((value, index) => ({ value, index }))
  .sort((a, b) => b.value - a.value);
const pc1Index = componentOrder[0].index;
const pc2Index = componentOrder[1].index;
const totalVariance = eigenvalues.reduce((sum, value) => sum + value, 0);
const pc1VarianceShare = (eigenvalues[pc1Index] / totalVariance) * 100;
const pc2VarianceShare = (eigenvalues[pc2Index] / totalVariance) * 100;

// --- Scores (component coordinates) and loadings (variable correlations) ----
const scores = standardized.map((row) => ({
  x: row.reduce((sum, value, j) => sum + value * eigenvectors[j][pc1Index], 0),
  y: row.reduce((sum, value, j) => sum + value * eigenvectors[j][pc2Index], 0),
}));

const rawLoadings = FEATURE_KEYS.map((_, j) => ({
  x: eigenvectors[j][pc1Index] * Math.sqrt(eigenvalues[pc1Index]),
  y: eigenvectors[j][pc2Index] * Math.sqrt(eigenvalues[pc2Index]),
}));

const maxScoreExtent = Math.max(
  ...scores.map((s) => Math.max(Math.abs(s.x), Math.abs(s.y)))
);
const maxLoadingExtent = Math.max(
  ...rawLoadings.map((l) => Math.max(Math.abs(l.x), Math.abs(l.y)))
);
const loadingDisplayScale = (maxScoreExtent * 0.85) / maxLoadingExtent;
const loadingVectors = rawLoadings.map((loading, j) => ({
  variable: VARIABLE_NAMES[j],
  x: loading.x * loadingDisplayScale,
  y: loading.y * loadingDisplayScale,
}));

const axisPadding = maxScoreExtent * 0.25;
const axisMin = -(maxScoreExtent + axisPadding);
const axisMax = maxScoreExtent + axisPadding;

// --- One scatter series per production line, Imprint categorical colors -----
const series = PRODUCTION_LINES.map((line, lineIndex) => ({
  type: "scatter",
  id: line,
  label: line,
  color: t.palette[lineIndex],
  markerSize: 7,
  data: observations
    .map((row, i) => ({ row, i }))
    .filter(({ row }) => row.line === line)
    .map(({ i }) => ({ x: scores[i].x, y: scores[i].y, id: `${line}-${i}` })),
}));

// --- Push label y-positions apart on each side so nearly-parallel loading
// arrows (e.g. Throughput/Temperature above) don't print overlapping text ---
const MIN_LABEL_GAP = 34;
function declutterLabels(items) {
  const sides = [true, false].map((pointsRight) =>
    items
      .filter((item) => item.pointsRight === pointsRight)
      .sort((a, b) => a.tipY - b.tipY)
  );
  sides.forEach((side) => {
    side.forEach((item, i) => {
      const minY = i === 0 ? -Infinity : side[i - 1].labelY + MIN_LABEL_GAP;
      item.labelY = Math.max(item.tipY, minY);
    });
  });
  return sides.flat();
}

// --- Unit-circle reference for correlation-biplot scaling: a loading vector
// reaching this radius represents a variable perfectly captured by PC1+PC2 ---
const UNIT_CIRCLE_STEPS = 72;
const unitCirclePoints = Array.from({ length: UNIT_CIRCLE_STEPS + 1 }, (_, i) => {
  const angle = (i / UNIT_CIRCLE_STEPS) * 2 * Math.PI;
  return { x: Math.cos(angle) * loadingDisplayScale, y: Math.sin(angle) * loadingDisplayScale };
});

// --- Loading-vector overlay, drawn in data space via the chart scale hooks --
function LoadingArrows() {
  const xScale = useXScale();
  const yScale = useYScale();
  const originX = xScale(0);
  const originY = yScale(0);

  return (
    <g>
      <defs>
        <marker
          id="biplot-arrowhead"
          markerWidth={8}
          markerHeight={8}
          refX={6}
          refY={4}
          orient="auto"
        >
          <path d="M0,0 L8,4 L0,8 Z" fill={t.ink} />
        </marker>
      </defs>
      <polyline
        points={unitCirclePoints.map((p) => `${xScale(p.x)},${yScale(p.y)}`).join(" ")}
        fill="none"
        stroke={t.inkSoft}
        strokeWidth={1}
        strokeDasharray="4 4"
        opacity={0.6}
      />
      <line
        x1={xScale(axisMin)}
        x2={xScale(axisMax)}
        y1={originY}
        y2={originY}
        stroke={t.grid}
        strokeWidth={1}
      />
      <line
        x1={originX}
        x2={originX}
        y1={yScale(axisMin)}
        y2={yScale(axisMax)}
        stroke={t.grid}
        strokeWidth={1}
      />
      {declutterLabels(
        loadingVectors.map((loading) => ({
          variable: loading.variable,
          tipX: xScale(loading.x),
          tipY: yScale(loading.y),
          pointsRight: loading.x >= 0,
        }))
      ).map((loading) => (
        <g key={loading.variable}>
          <line
            x1={originX}
            y1={originY}
            x2={loading.tipX}
            y2={loading.tipY}
            stroke={t.ink}
            strokeWidth={2.5}
            markerEnd="url(#biplot-arrowhead)"
          />
          <text
            x={loading.tipX + (loading.pointsRight ? 10 : -10)}
            y={loading.labelY}
            fill={t.ink}
            fontSize={15}
            fontWeight={600}
            fontFamily="system-ui, sans-serif"
            textAnchor={loading.pointsRight ? "start" : "end"}
            dominantBaseline="middle"
          >
            {loading.variable}
          </text>
        </g>
      ))}
    </g>
  );
}

const chartTitle = "biplot-pca · javascript · muix · anyplot.ai";

// --- Chart (default-exported component — the harness mounts it) ------------
export default function Chart() {
  return (
    <ChartContainer
      width={size.width}
      height={size.height}
      series={series}
      xAxis={[
        {
          id: "pc1",
          scaleType: "linear",
          min: axisMin,
          max: axisMax,
          label: `PC1 (${pc1VarianceShare.toFixed(1)}%)`,
          labelStyle: { fontSize: 16, fill: t.ink },
          tickLabelStyle: { fontSize: 13, fill: t.inkSoft },
        },
      ]}
      yAxis={[
        {
          id: "pc2",
          scaleType: "linear",
          min: axisMin,
          max: axisMax,
          label: `PC2 (${pc2VarianceShare.toFixed(1)}%)`,
          labelStyle: { fontSize: 16, fill: t.ink },
          tickLabelStyle: { fontSize: 13, fill: t.inkSoft },
        },
      ]}
      margin={{ top: 72, right: 56, bottom: 110, left: 92 }}
      disableVoronoi
      skipAnimation
    >
      <text
        x={size.width / 2}
        y={40}
        textAnchor="middle"
        fontSize={22}
        fontWeight={600}
        fill={t.ink}
        fontFamily="system-ui, sans-serif"
      >
        {chartTitle}
      </text>
      <ChartsGrid horizontal vertical />
      <LoadingArrows />
      <ScatterPlot />
      <ChartsXAxis />
      <ChartsYAxis />
      <ChartsLegend
        direction="row"
        position={{ vertical: "bottom", horizontal: "middle" }}
        labelStyle={{ fontSize: 14, fill: t.inkSoft }}
      />
      <ChartsTooltip trigger="item" />
    </ChartContainer>
  );
}
Runnable source as JSON, for any HTTP client: https://api.anyplot.ai/specs/biplot-pca/muix/code. Any spec id and library id listed in llms-full.txt fit the same URL shape; every URL below is complete and callable.
{
  "spec_id": "biplot-pca",
  "language": "javascript",
  "library": "muix",
  "page": "https://anyplot.ai/biplot-pca/javascript/muix",
  "hub": "https://anyplot.ai/biplot-pca",
  "code_json": "https://api.anyplot.ai/specs/biplot-pca/muix/code",
  "spec_json": "https://api.anyplot.ai/specs/biplot-pca",
  "render_light_png": "https://storage.googleapis.com/anyplot-images/plots/biplot-pca/javascript/muix/plot-light.png",
  "render_dark_png": "https://storage.googleapis.com/anyplot-images/plots/biplot-pca/javascript/muix/plot-dark.png",
  "interactive_light_html": "https://storage.googleapis.com/anyplot-images/plots/biplot-pca/javascript/muix/plot-light.html",
  "interactive_dark_html": "https://storage.googleapis.com/anyplot-images/plots/biplot-pca/javascript/muix/plot-dark.html",
  "quality_score": 88.0,
  "license": "MIT",
  "guide": "https://anyplot.ai/llms.txt"
}
Part of PCA Biplot with Scores and Loading Vectors on anyplot.ai.