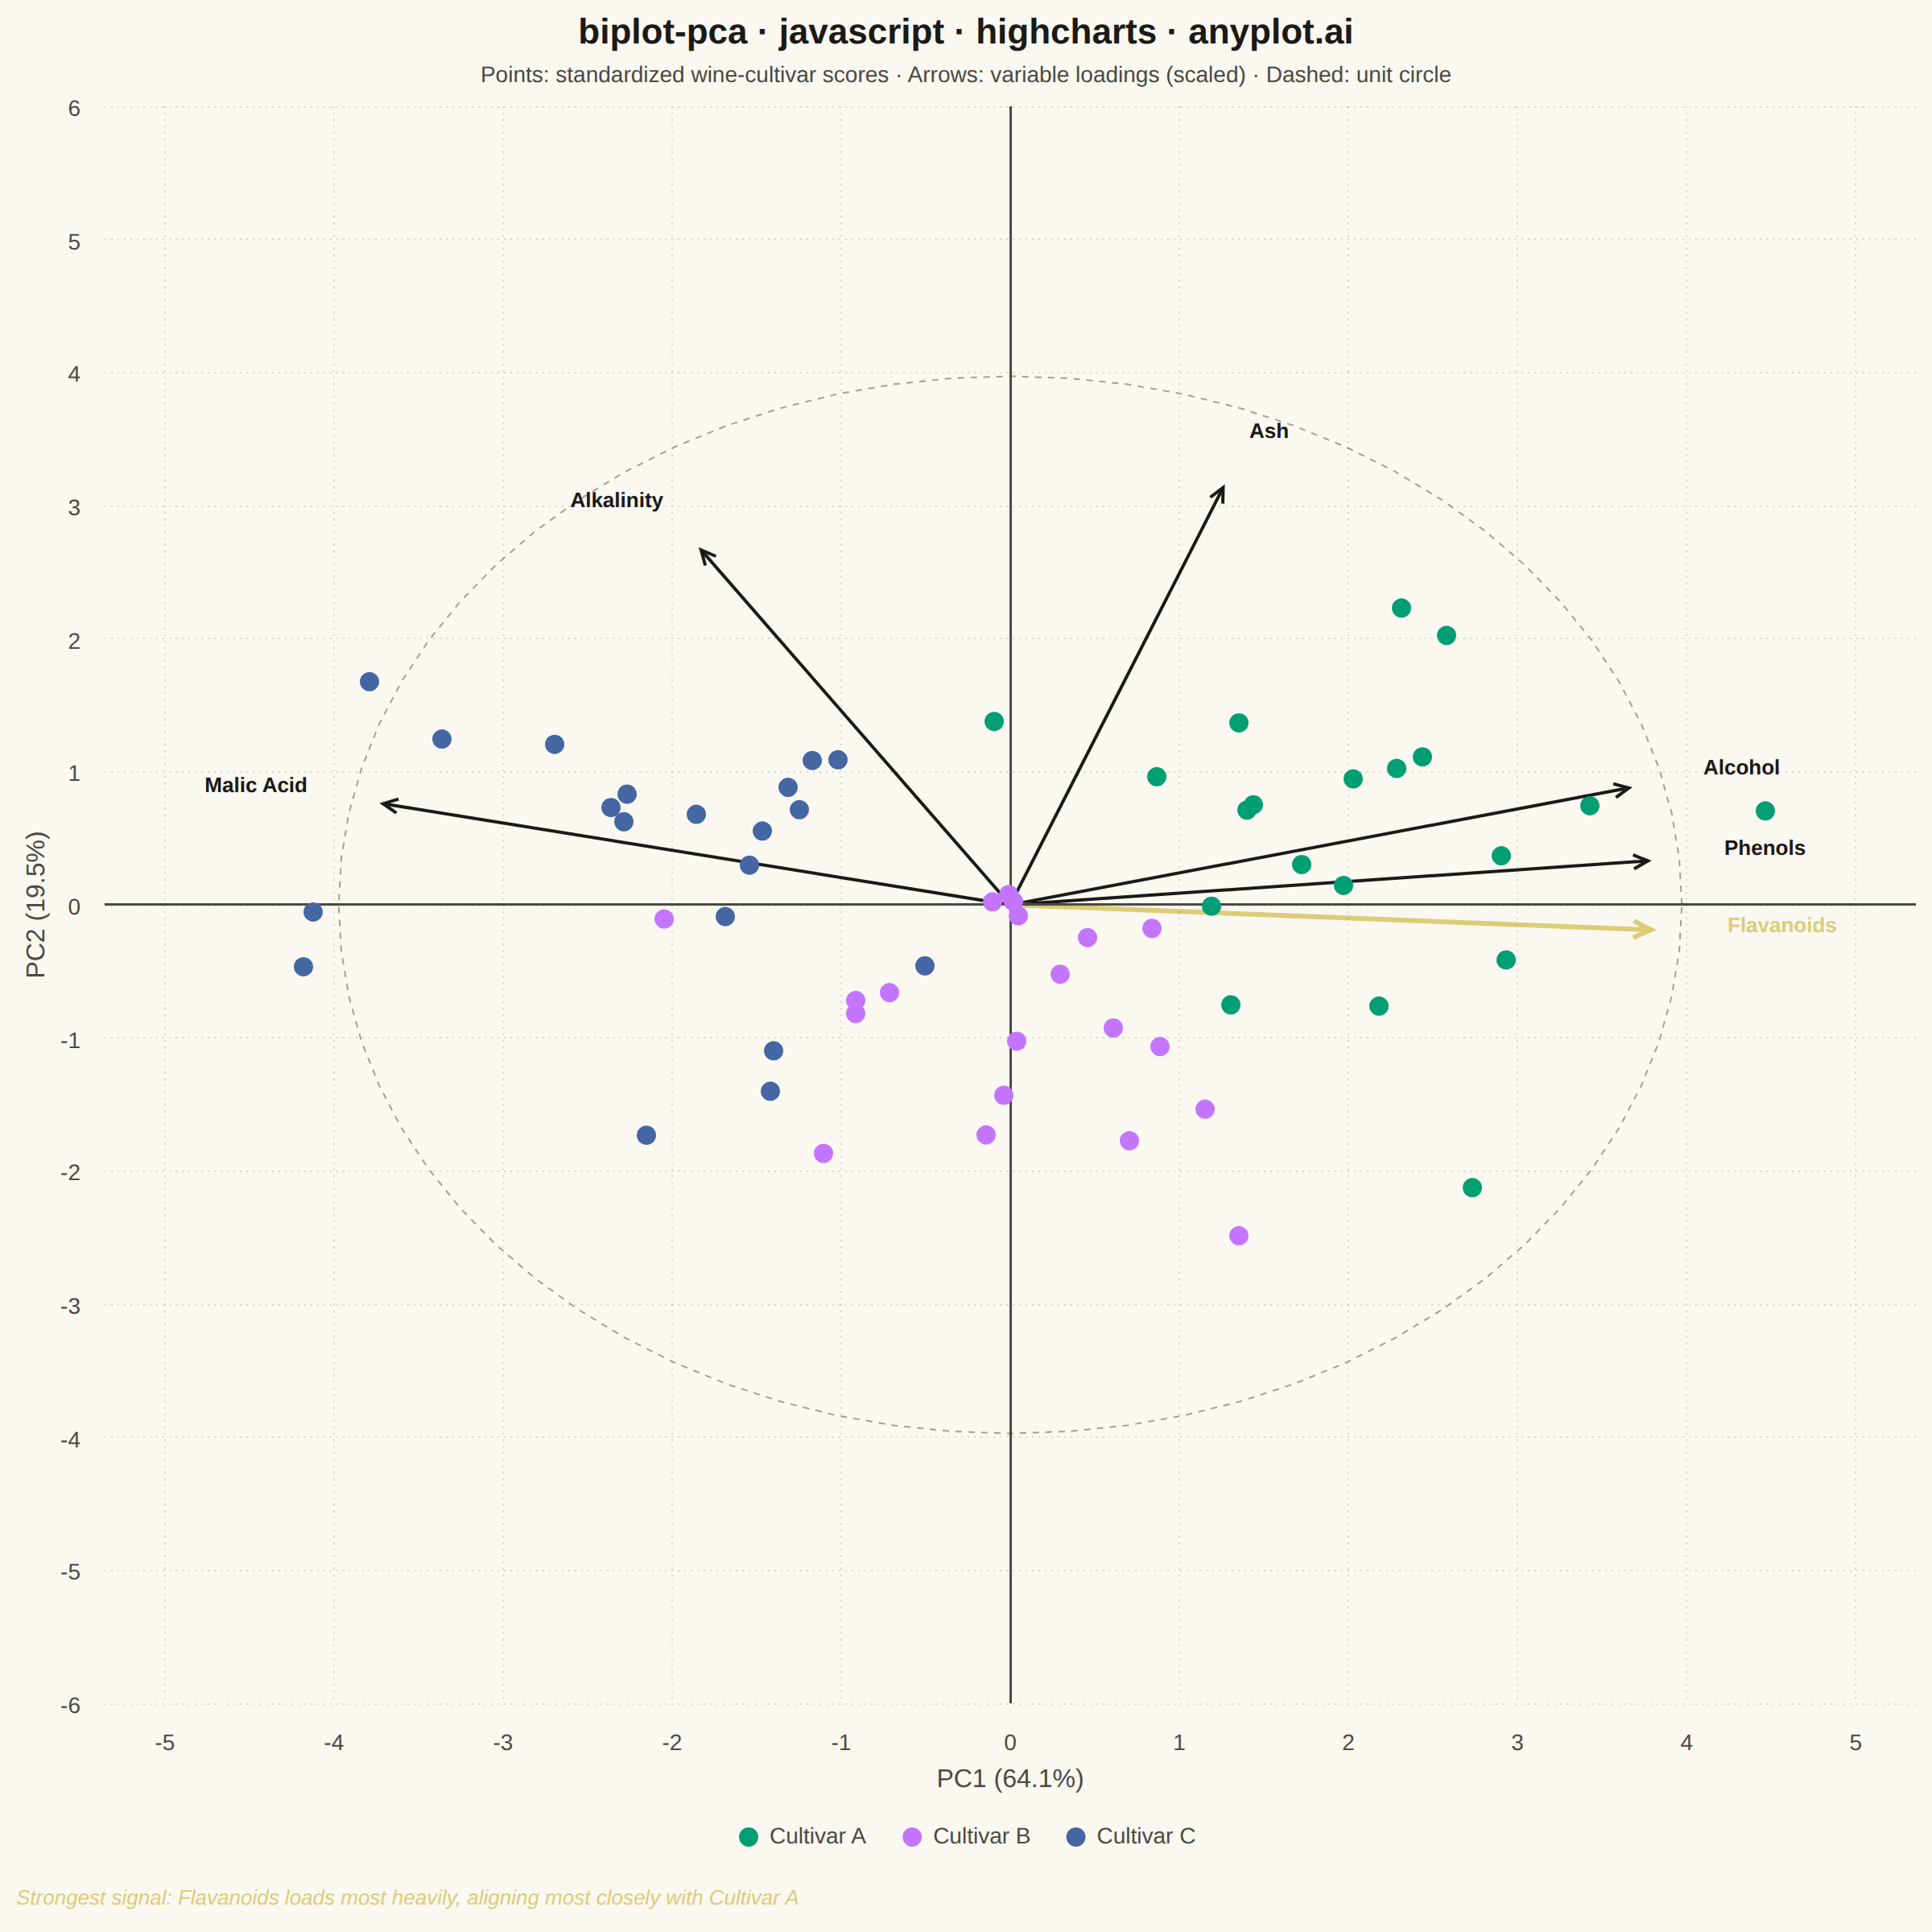
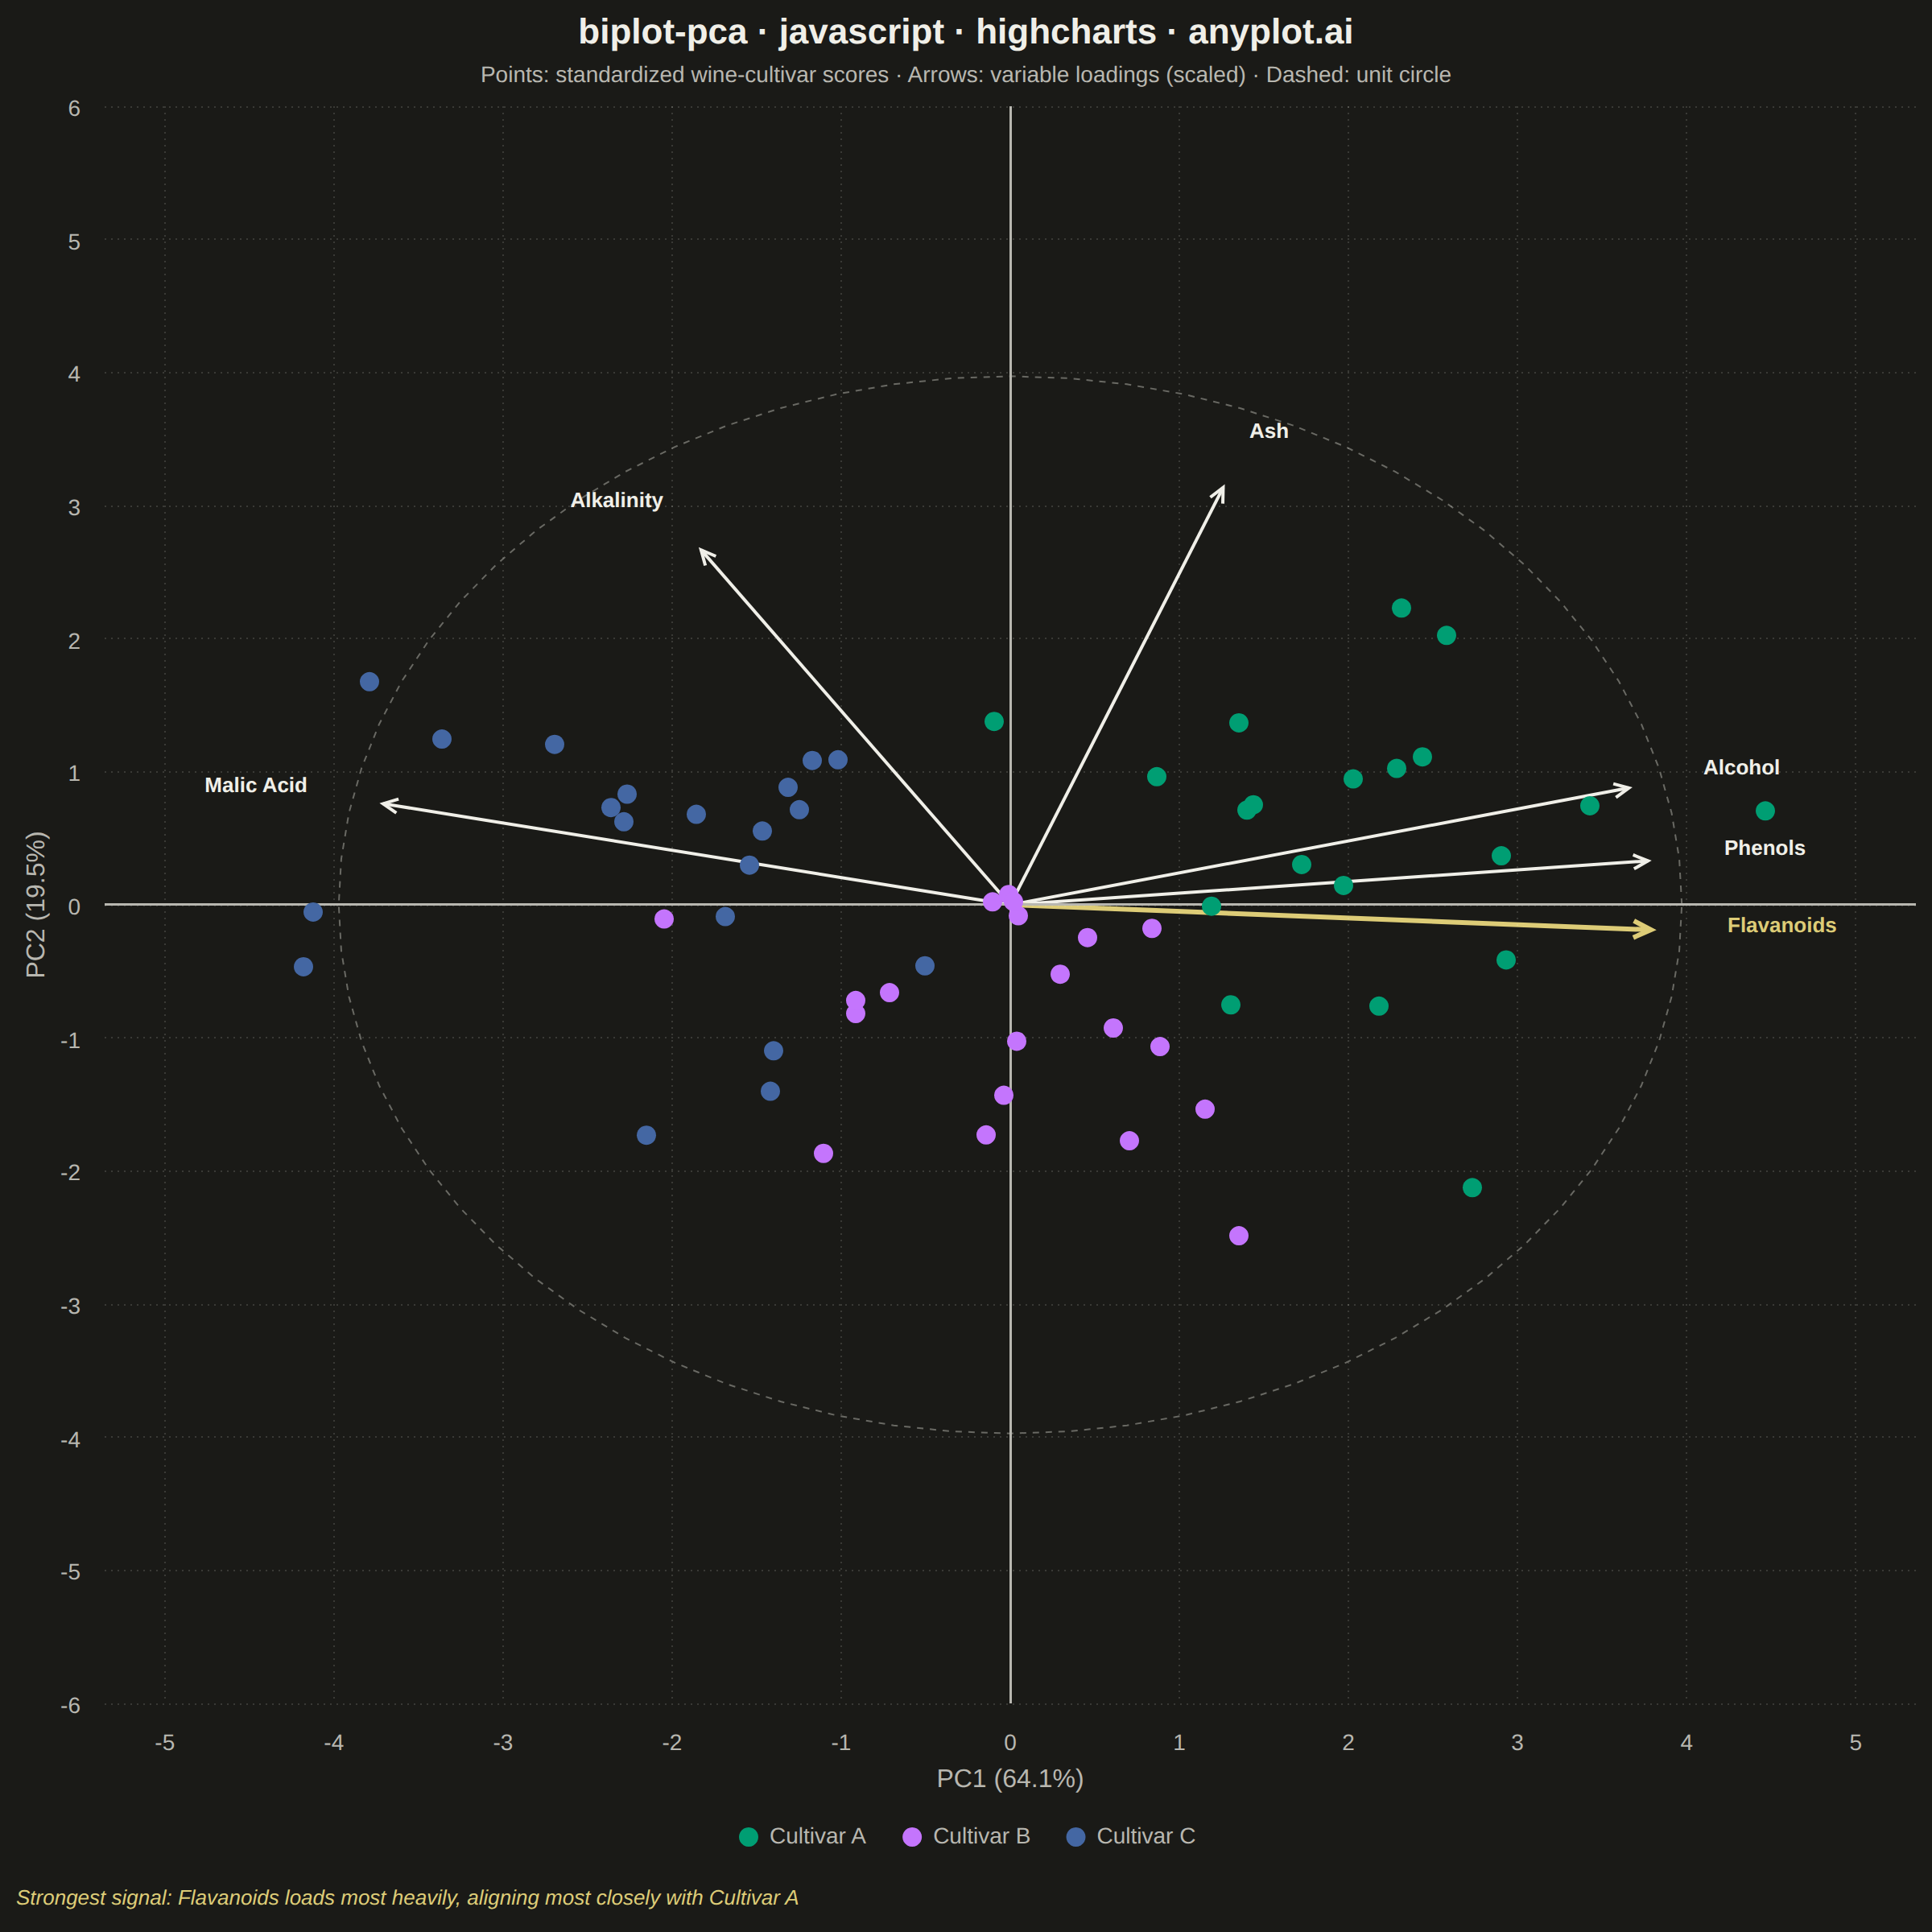
The same plot in 14 other libraries — JavaScript: Chart.js, D3.js, Apache ECharts, MUI X Charts; Python: Altair, Bokeh, lets-plot, Matplotlib, Plotly, plotnine, Pygal, Seaborn; R: ggplot2; Julia: Makie.jl. Compare all 15 side by side: PCA Biplot with Scores and Loading Vectors in Python, R, Julia and JavaScript.
A PCA biplot simultaneously displays both observation scores (as points) and variable loadings (as arrows) in the principal component space. This dual representation is essential for interpreting PCA results, revealing how observations relate to each other and which original variables drive the separation along each principal component. The length and direction of loading arrows indicate variable importance and correlation with the components.
// anyplot.ai
// biplot-pca: PCA Biplot with Scores and Loading Vectors
// Library: highcharts 12.6.0 | JavaScript 22.23.2
// Quality: 93/100 | Created: 2026-09-01

//# anyplot-orientation: square
const t = window.ANYPLOT_TOKENS;

// --- Reproducible PRNG (LCG + Box-Muller) -----------------------------------
let seed = 42;
function lcg() {
  seed = (seed * 1103515245 + 12345) & 0x7fffffff;
  return seed / 0x7fffffff;
}
function randNormal() {
  const u1 = Math.max(lcg(), 1e-9);
  const u2 = lcg();
  return Math.sqrt(-2 * Math.log(u1)) * Math.cos(2 * Math.PI * u2);
}

// --- Data: synthetic wine-cultivar physicochemical measurements ------------
// Six correlated features driven by two latent factors, three cultivar groups.
const featureNames = ["Alcohol", "Malic Acid", "Ash", "Alkalinity", "Phenols", "Flavanoids"];
const featureCoefs = [
  { base: 13.0, c1: 0.9, c2: 0.15, noise: 0.35 },
  { base: 2.4, c1: -0.7, c2: 0.25, noise: 0.4 },
  { base: 2.3, c1: 0.05, c2: 0.35, noise: 0.25 },
  { base: 19.5, c1: -0.55, c2: 0.6, noise: 1.2 },
  { base: 2.3, c1: 0.8, c2: -0.15, noise: 0.3 },
  { base: 2.0, c1: 0.85, c2: -0.2, noise: 0.3 },
];
const groups = [
  { name: "Cultivar A", latent1: 1.3, latent2: 0.4 },
  { name: "Cultivar B", latent1: 0.0, latent2: -0.7 },
  { name: "Cultivar C", latent1: -1.3, latent2: 0.3 },
];
const nPerGroup = 20;
const nFeatures = featureNames.length;

const rawRows = [];
const groupIndex = [];
groups.forEach((g, gi) => {
  for (let i = 0; i < nPerGroup; i++) {
    const latent1 = g.latent1 + randNormal() * 0.5;
    const latent2 = g.latent2 + randNormal() * 0.5;
    const row = featureCoefs.map(
      (f) => f.base + f.c1 * latent1 + f.c2 * latent2 + randNormal() * f.noise
    );
    rawRows.push(row);
    groupIndex.push(gi);
  }
});
const nObs = rawRows.length;

// --- Standardize (z-score) each feature — correlation-based PCA ------------
const means = featureCoefs.map((_, k) => rawRows.reduce((s, r) => s + r[k], 0) / nObs);
const stds = featureCoefs.map((_, k) => {
  const variance = rawRows.reduce((s, r) => s + (r[k] - means[k]) ** 2, 0) / (nObs - 1);
  return Math.sqrt(variance);
});
const standardized = rawRows.map((row) => row.map((v, k) => (v - means[k]) / stds[k]));

// --- Correlation matrix ------------------------------------------------------
const corr = Array.from({ length: nFeatures }, (_, i) =>
  Array.from({ length: nFeatures }, (_, j) => {
    let s = 0;
    for (let o = 0; o < nObs; o++) s += standardized[o][i] * standardized[o][j];
    return s / (nObs - 1);
  })
);

// --- Jacobi eigenvalue decomposition (symmetric matrix) ---------------------
function jacobiEigen(matrix, n) {
  const A = matrix.map((row) => row.slice());
  const V = Array.from({ length: n }, (_, i) =>
    Array.from({ length: n }, (_, j) => (i === j ? 1 : 0))
  );
  for (let sweep = 0; sweep < 100; sweep++) {
    let off = 0;
    for (let p = 0; p < n; p++) for (let q = p + 1; q < n; q++) off += A[p][q] * A[p][q];
    if (off < 1e-12) break;
    for (let p = 0; p < n; p++) {
      for (let q = p + 1; q < n; q++) {
        if (Math.abs(A[p][q]) < 1e-14) continue;
        const theta = (A[q][q] - A[p][p]) / (2 * A[p][q]);
        const sign = theta >= 0 ? 1 : -1;
        const tVal = sign / (Math.abs(theta) + Math.sqrt(theta * theta + 1));
        const c = 1 / Math.sqrt(tVal * tVal + 1);
        const s = tVal * c;
        const app = A[p][p];
        const aqq = A[q][q];
        const apq = A[p][q];
        A[p][p] = c * c * app - 2 * s * c * apq + s * s * aqq;
        A[q][q] = s * s * app + 2 * s * c * apq + c * c * aqq;
        A[p][q] = 0;
        A[q][p] = 0;
        for (let i = 0; i < n; i++) {
          if (i !== p && i !== q) {
            const aip = A[i][p];
            const aiq = A[i][q];
            A[i][p] = c * aip - s * aiq;
            A[p][i] = A[i][p];
            A[i][q] = s * aip + c * aiq;
            A[q][i] = A[i][q];
          }
        }
        for (let i = 0; i < n; i++) {
          const vip = V[i][p];
          const viq = V[i][q];
          V[i][p] = c * vip - s * viq;
          V[i][q] = s * vip + c * viq;
        }
      }
    }
  }
  const values = Array.from({ length: n }, (_, i) => A[i][i]);
  return { values, vectors: V };
}

const { values: eigenvalues, vectors: eigenvectors } = jacobiEigen(corr, nFeatures);
const order = eigenvalues.map((_, i) => i).sort((a, b) => eigenvalues[b] - eigenvalues[a]);
const eigen1 = eigenvalues[order[0]];
const eigen2 = eigenvalues[order[1]];
const pc1Vec = eigenvectors.map((row) => row[order[0]]);
const pc2Vec = eigenvectors.map((row) => row[order[1]]);
const totalVariance = eigenvalues.reduce((s, v) => s + v, 0);
const pc1Pct = (eigen1 / totalVariance) * 100;
const pc2Pct = (eigen2 / totalVariance) * 100;

// --- Scores (observations projected onto PC1/PC2) --------------------------
const scores = standardized.map((row) => [
  row.reduce((s, v, k) => s + v * pc1Vec[k], 0),
  row.reduce((s, v, k) => s + v * pc2Vec[k], 0),
]);

// --- Loadings (correlation between variable and component) -----------------
const loadings = featureNames.map((name, k) => ({
  name,
  x: pc1Vec[k] * Math.sqrt(eigen1),
  y: pc2Vec[k] * Math.sqrt(eigen2),
}));

// --- Scale loadings so arrows read alongside the score cloud ---------------
const maxScoreAbs = Math.max(...scores.flat().map(Math.abs));
const maxLoadingMag = Math.max(...loadings.map((l) => Math.hypot(l.x, l.y)));
const loadingScale = (maxScoreAbs * 0.85) / maxLoadingMag;
const scaledLoadings = loadings.map((l) => ({
  name: l.name,
  x: l.x * loadingScale,
  y: l.y * loadingScale,
}));
const axisMax = Math.max(maxScoreAbs, loadingScale) * 1.2;

// --- Dominant loading + its most-aligned cultivar (interpretive callout) ---
const loadingMagnitudes = loadings.map((l) => Math.hypot(l.x, l.y));
const dominantIdx = loadingMagnitudes.indexOf(Math.max(...loadingMagnitudes));
const dominantUnit = {
  x: loadings[dominantIdx].x / loadingMagnitudes[dominantIdx],
  y: loadings[dominantIdx].y / loadingMagnitudes[dominantIdx],
};
const groupCentroids = groups.map((g, gi) => {
  const groupScores = scores.filter((_, i) => groupIndex[i] === gi);
  const n = groupScores.length;
  return {
    name: g.name,
    meanX: groupScores.reduce((s, r) => s + r[0], 0) / n,
    meanY: groupScores.reduce((s, r) => s + r[1], 0) / n,
  };
});
const alignedGroup = groupCentroids.reduce((best, c) => {
  const proj = c.meanX * dominantUnit.x + c.meanY * dominantUnit.y;
  return proj > best.proj ? { name: c.name, proj } : best;
}, { name: null, proj: -Infinity });

// --- Group score series ------------------------------------------------------
const seriesData = groups.map((g, gi) => ({
  name: g.name,
  type: "scatter",
  color: t.palette[gi],
  data: scores.filter((_, i) => groupIndex[i] === gi),
  marker: { radius: 6, symbol: "circle" },
}));

// --- Chart -------------------------------------------------------------------
Highcharts.chart("container", {
  chart: {
    type: "scatter",
    backgroundColor: "transparent",
    animation: false,
    style: { fontFamily: "inherit" },
    events: {
      load: function () {
        const chart = this;
        const xAxis = chart.xAxis[0];
        const yAxis = chart.yAxis[0];
        const renderer = chart.renderer;

        // Reference unit circle (correlation biplot scaling)
        const circlePoints = 72;
        const circlePath = [];
        for (let i = 0; i <= circlePoints; i++) {
          const angle = (i / circlePoints) * 2 * Math.PI;
          const px = xAxis.toPixels(loadingScale * Math.cos(angle), false);
          const py = yAxis.toPixels(loadingScale * Math.sin(angle), false);
          circlePath.push(i === 0 ? "M" : "L", px, py);
        }
        circlePath.push("Z");
        renderer
          .path(circlePath)
          .attr({ stroke: t.inkSoft, "stroke-width": 1, "stroke-dasharray": "4,4", fill: "none", opacity: 0.5 })
          .add();

        // Loading vectors — arrows drawn from the origin
        const originX = xAxis.toPixels(0, false);
        const originY = yAxis.toPixels(0, false);

        // Precompute label anchors, then resolve vertical collisions per side
        // (right-side labels otherwise crowd together at mobile width).
        const labelAnchors = scaledLoadings.map((l) => ({
          x: xAxis.toPixels(l.x * 1.12, false),
          y: yAxis.toPixels(l.y * 1.12, false),
          align: l.x >= 0 ? "left" : "right",
        }));
        const minGap = 16;
        ["left", "right"].forEach((side) => {
          const group = labelAnchors
            .map((a, idx) => ({ ...a, idx }))
            .filter((a) => a.align === side)
            .sort((a, b) => a.y - b.y);
          for (let i = 1; i < group.length; i++) {
            if (group[i].y - group[i - 1].y < minGap) {
              group[i].y = group[i - 1].y + minGap;
            }
            labelAnchors[group[i].idx].y = group[i].y;
          }
        });

        scaledLoadings.forEach((l, idx) => {
          const isDominant = idx === dominantIdx;
          const strokeColor = isDominant ? t.amber : t.ink;
          const strokeWidth = isDominant ? 3 : 2;

          const tipX = xAxis.toPixels(l.x, false);
          const tipY = yAxis.toPixels(l.y, false);
          renderer
            .path(["M", originX, originY, "L", tipX, tipY])
            .attr({ stroke: strokeColor, "stroke-width": strokeWidth })
            .add();

          const angle = Math.atan2(tipY - originY, tipX - originX);
          const headLen = isDominant ? 12 : 10;
          const headAngle = 0.45;
          const h1x = tipX - headLen * Math.cos(angle - headAngle);
          const h1y = tipY - headLen * Math.sin(angle - headAngle);
          const h2x = tipX - headLen * Math.cos(angle + headAngle);
          const h2y = tipY - headLen * Math.sin(angle + headAngle);
          renderer
            .path(["M", h1x, h1y, "L", tipX, tipY, "L", h2x, h2y])
            .attr({ stroke: strokeColor, "stroke-width": strokeWidth, fill: "none" })
            .add();

          const anchor = labelAnchors[idx];
          renderer
            .text(l.name, anchor.x, anchor.y)
            .attr({ align: anchor.align })
            .css({
              color: isDominant ? t.amber : t.ink,
              fontSize: "13px",
              fontWeight: isDominant ? "700" : "600",
            })
            .add();
        });
      },
    },
  },
  credits: { enabled: false },
  colors: t.palette,
  title: {
    text: "biplot-pca · javascript · highcharts · anyplot.ai",
    style: { color: t.ink, fontSize: "22px", fontWeight: "600" },
  },
  subtitle: {
    text: "Points: standardized wine-cultivar scores · Arrows: variable loadings (scaled) · Dashed: unit circle",
    style: { color: t.inkSoft, fontSize: "14px" },
  },
  caption: {
    text:
      "Strongest signal: " +
      featureNames[dominantIdx] +
      " loads most heavily, aligning most closely with " +
      alignedGroup.name,
    align: "left",
    style: { color: t.amber, fontSize: "13px", fontStyle: "italic" },
  },
  xAxis: {
    title: {
      text: "PC1 (" + pc1Pct.toFixed(1) + "%)",
      style: { color: t.inkSoft, fontSize: "16px" },
    },
    min: -axisMax,
    max: axisMax,
    lineWidth: 0,
    tickLength: 0,
    gridLineColor: t.grid,
    gridLineWidth: 1,
    gridLineDashStyle: "Dot",
    labels: { style: { color: t.inkSoft, fontSize: "14px" } },
    plotLines: [{ value: 0, color: t.inkSoft, width: 1.5, zIndex: 1 }],
  },
  yAxis: {
    title: {
      text: "PC2 (" + pc2Pct.toFixed(1) + "%)",
      style: { color: t.inkSoft, fontSize: "16px" },
    },
    min: -axisMax,
    max: axisMax,
    lineWidth: 0,
    tickLength: 0,
    gridLineColor: t.grid,
    gridLineWidth: 1,
    gridLineDashStyle: "Dot",
    labels: { style: { color: t.inkSoft, fontSize: "14px" } },
    plotLines: [{ value: 0, color: t.inkSoft, width: 1.5, zIndex: 1 }],
  },
  legend: {
    enabled: true,
    verticalAlign: "bottom",
    itemStyle: { color: t.inkSoft, fontSize: "14px" },
    itemHoverStyle: { color: t.ink },
  },
  tooltip: { enabled: false },
  plotOptions: {
    scatter: {
      animation: false,
      states: { hover: { enabled: false } },
    },
    series: { animation: false },
  },
  series: seriesData,
});
Runnable source as JSON, for any HTTP client: https://api.anyplot.ai/specs/biplot-pca/highcharts/code. Any spec id and library id listed in llms-full.txt fit the same URL shape; every URL below is complete and callable.
{
  "spec_id": "biplot-pca",
  "language": "javascript",
  "library": "highcharts",
  "page": "https://anyplot.ai/biplot-pca/javascript/highcharts",
  "hub": "https://anyplot.ai/biplot-pca",
  "code_json": "https://api.anyplot.ai/specs/biplot-pca/highcharts/code",
  "spec_json": "https://api.anyplot.ai/specs/biplot-pca",
  "render_light_png": "https://storage.googleapis.com/anyplot-images/plots/biplot-pca/javascript/highcharts/plot-light.png",
  "render_dark_png": "https://storage.googleapis.com/anyplot-images/plots/biplot-pca/javascript/highcharts/plot-dark.png",
  "interactive_light_html": "https://storage.googleapis.com/anyplot-images/plots/biplot-pca/javascript/highcharts/plot-light.html",
  "interactive_dark_html": "https://storage.googleapis.com/anyplot-images/plots/biplot-pca/javascript/highcharts/plot-dark.html",
  "quality_score": 93.0,
  "license": "MIT",
  "guide": "https://anyplot.ai/llms.txt"
}
Part of PCA Biplot with Scores and Loading Vectors on anyplot.ai.