The same plot in 14 other libraries — JavaScript: Chart.js, D3.js, Apache ECharts, Highcharts; Python: Altair, Bokeh, lets-plot, Matplotlib, Plotly, plotnine, Pygal, Seaborn; R: ggplot2; Julia: Makie.jl. Compare all 15 side by side: Grouped Box Plot in Python, R, Julia and JavaScript.
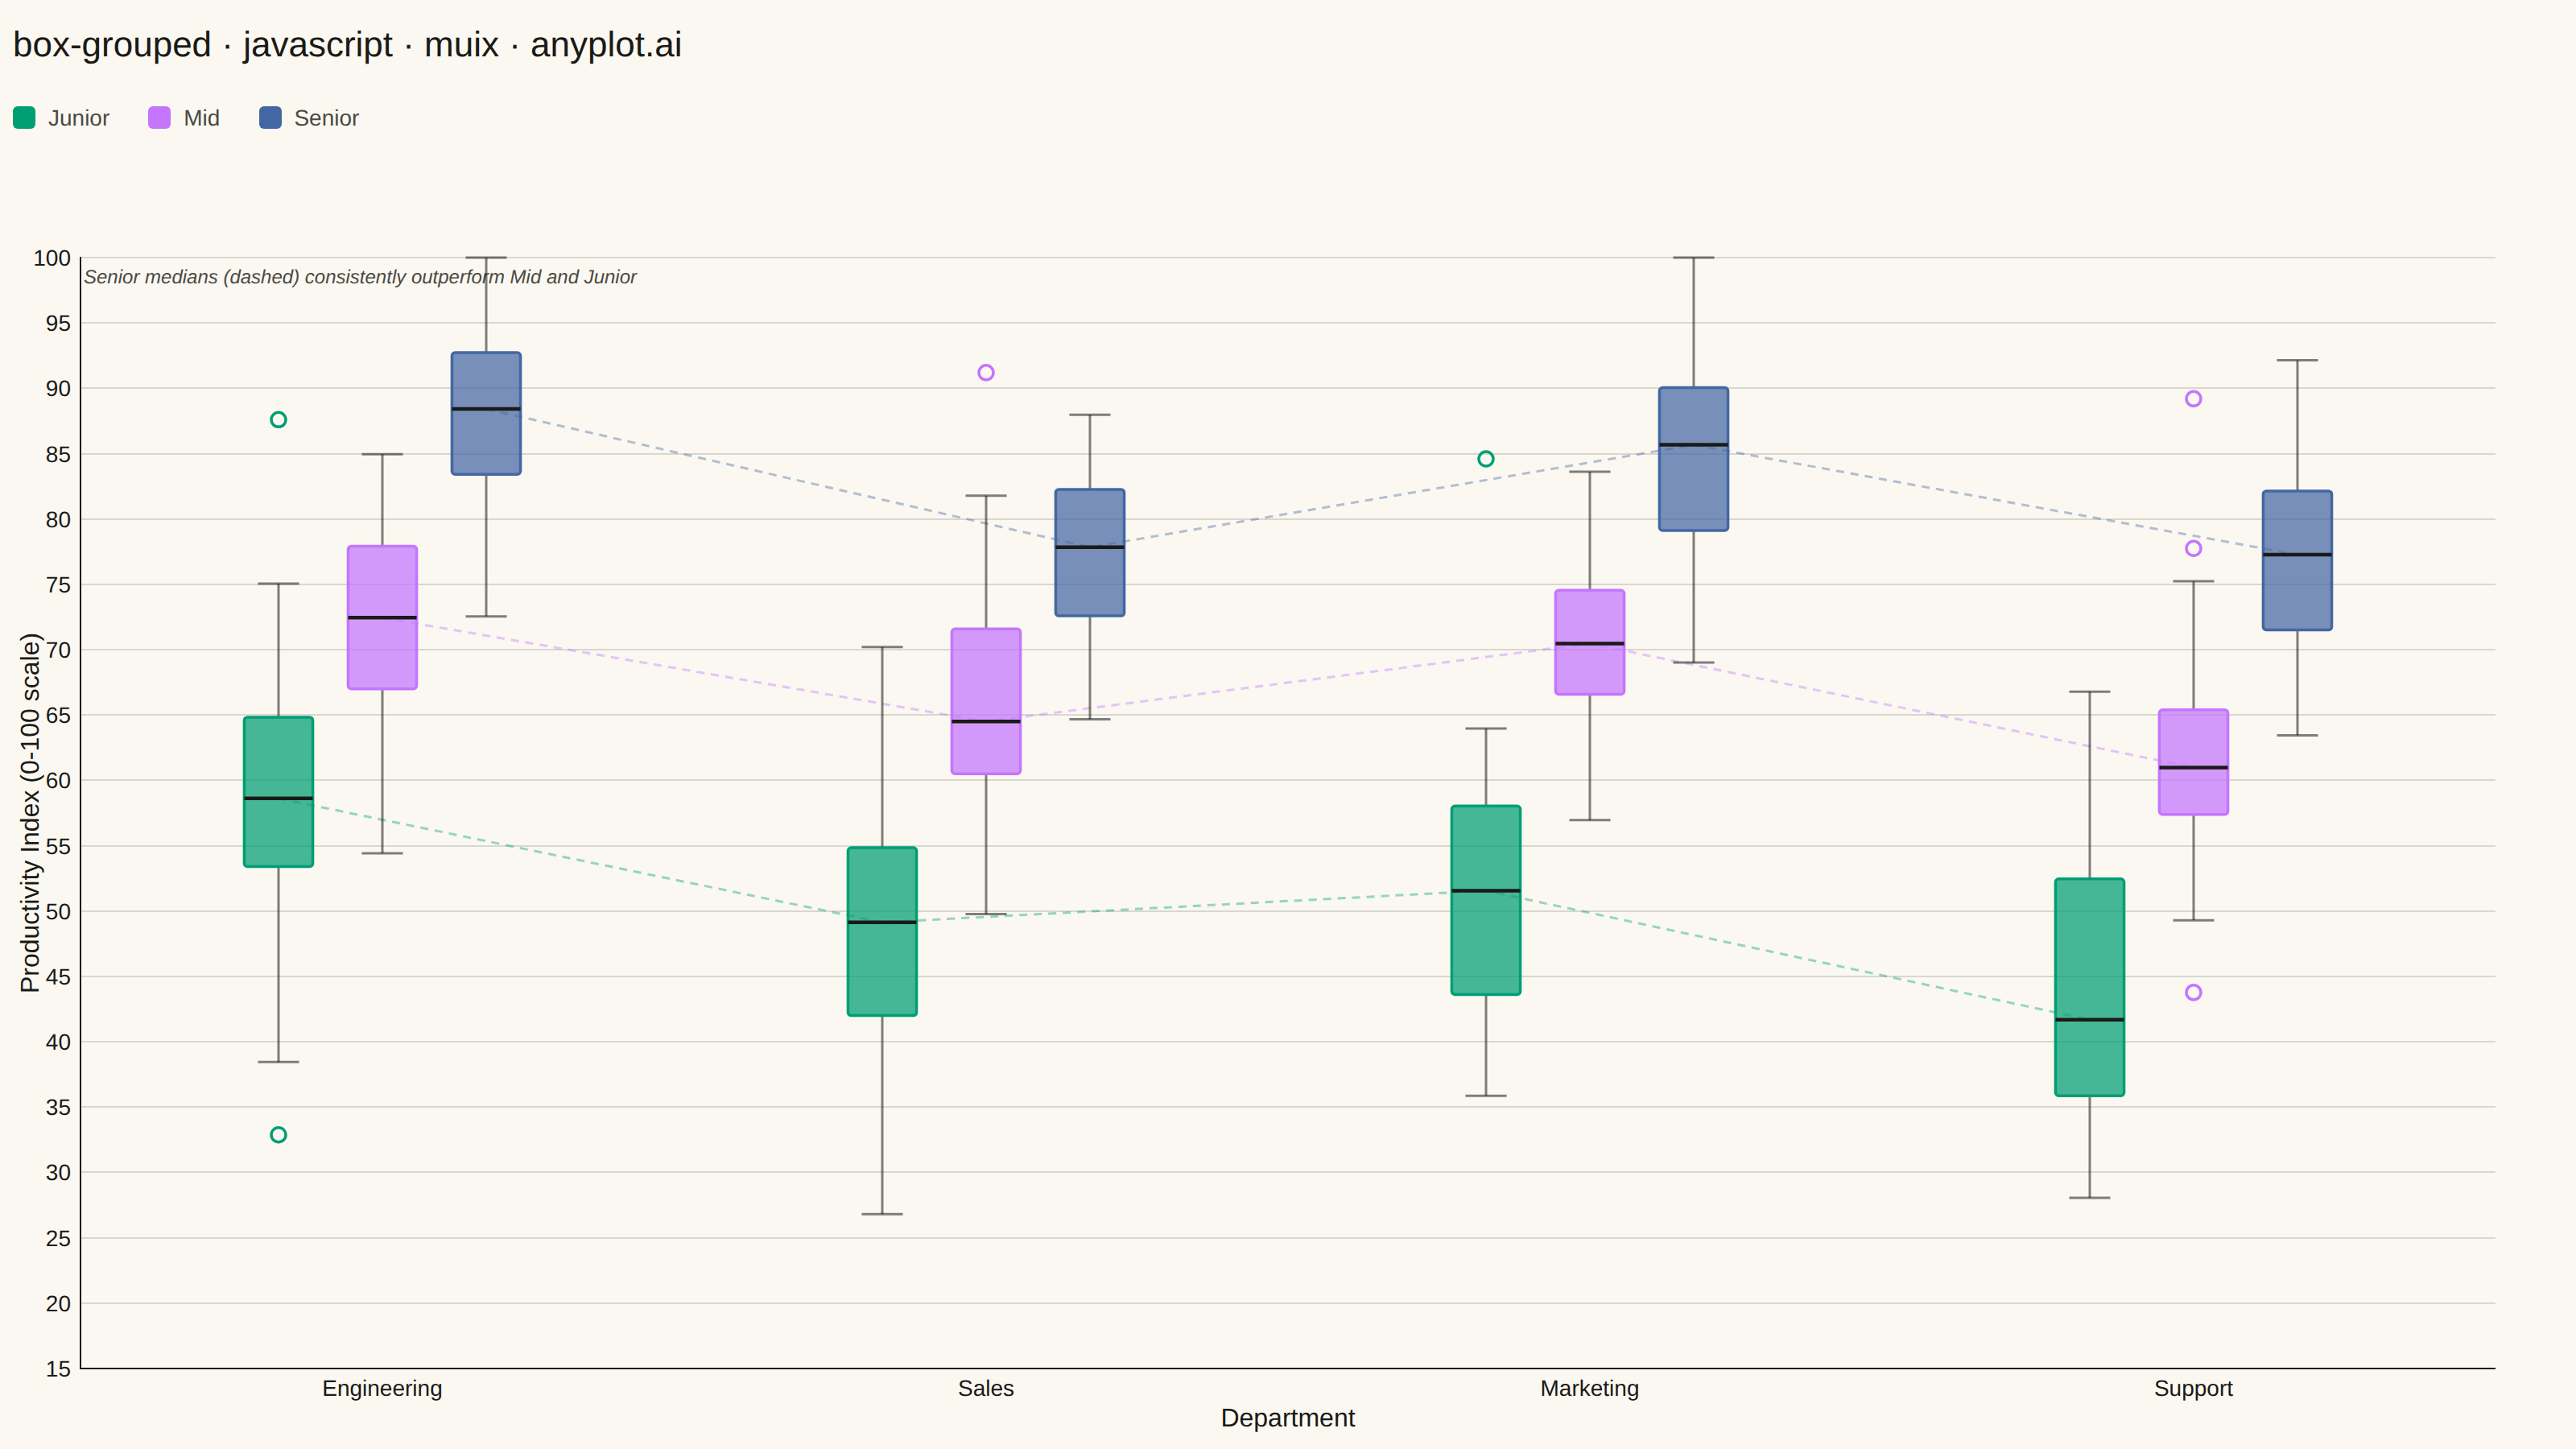
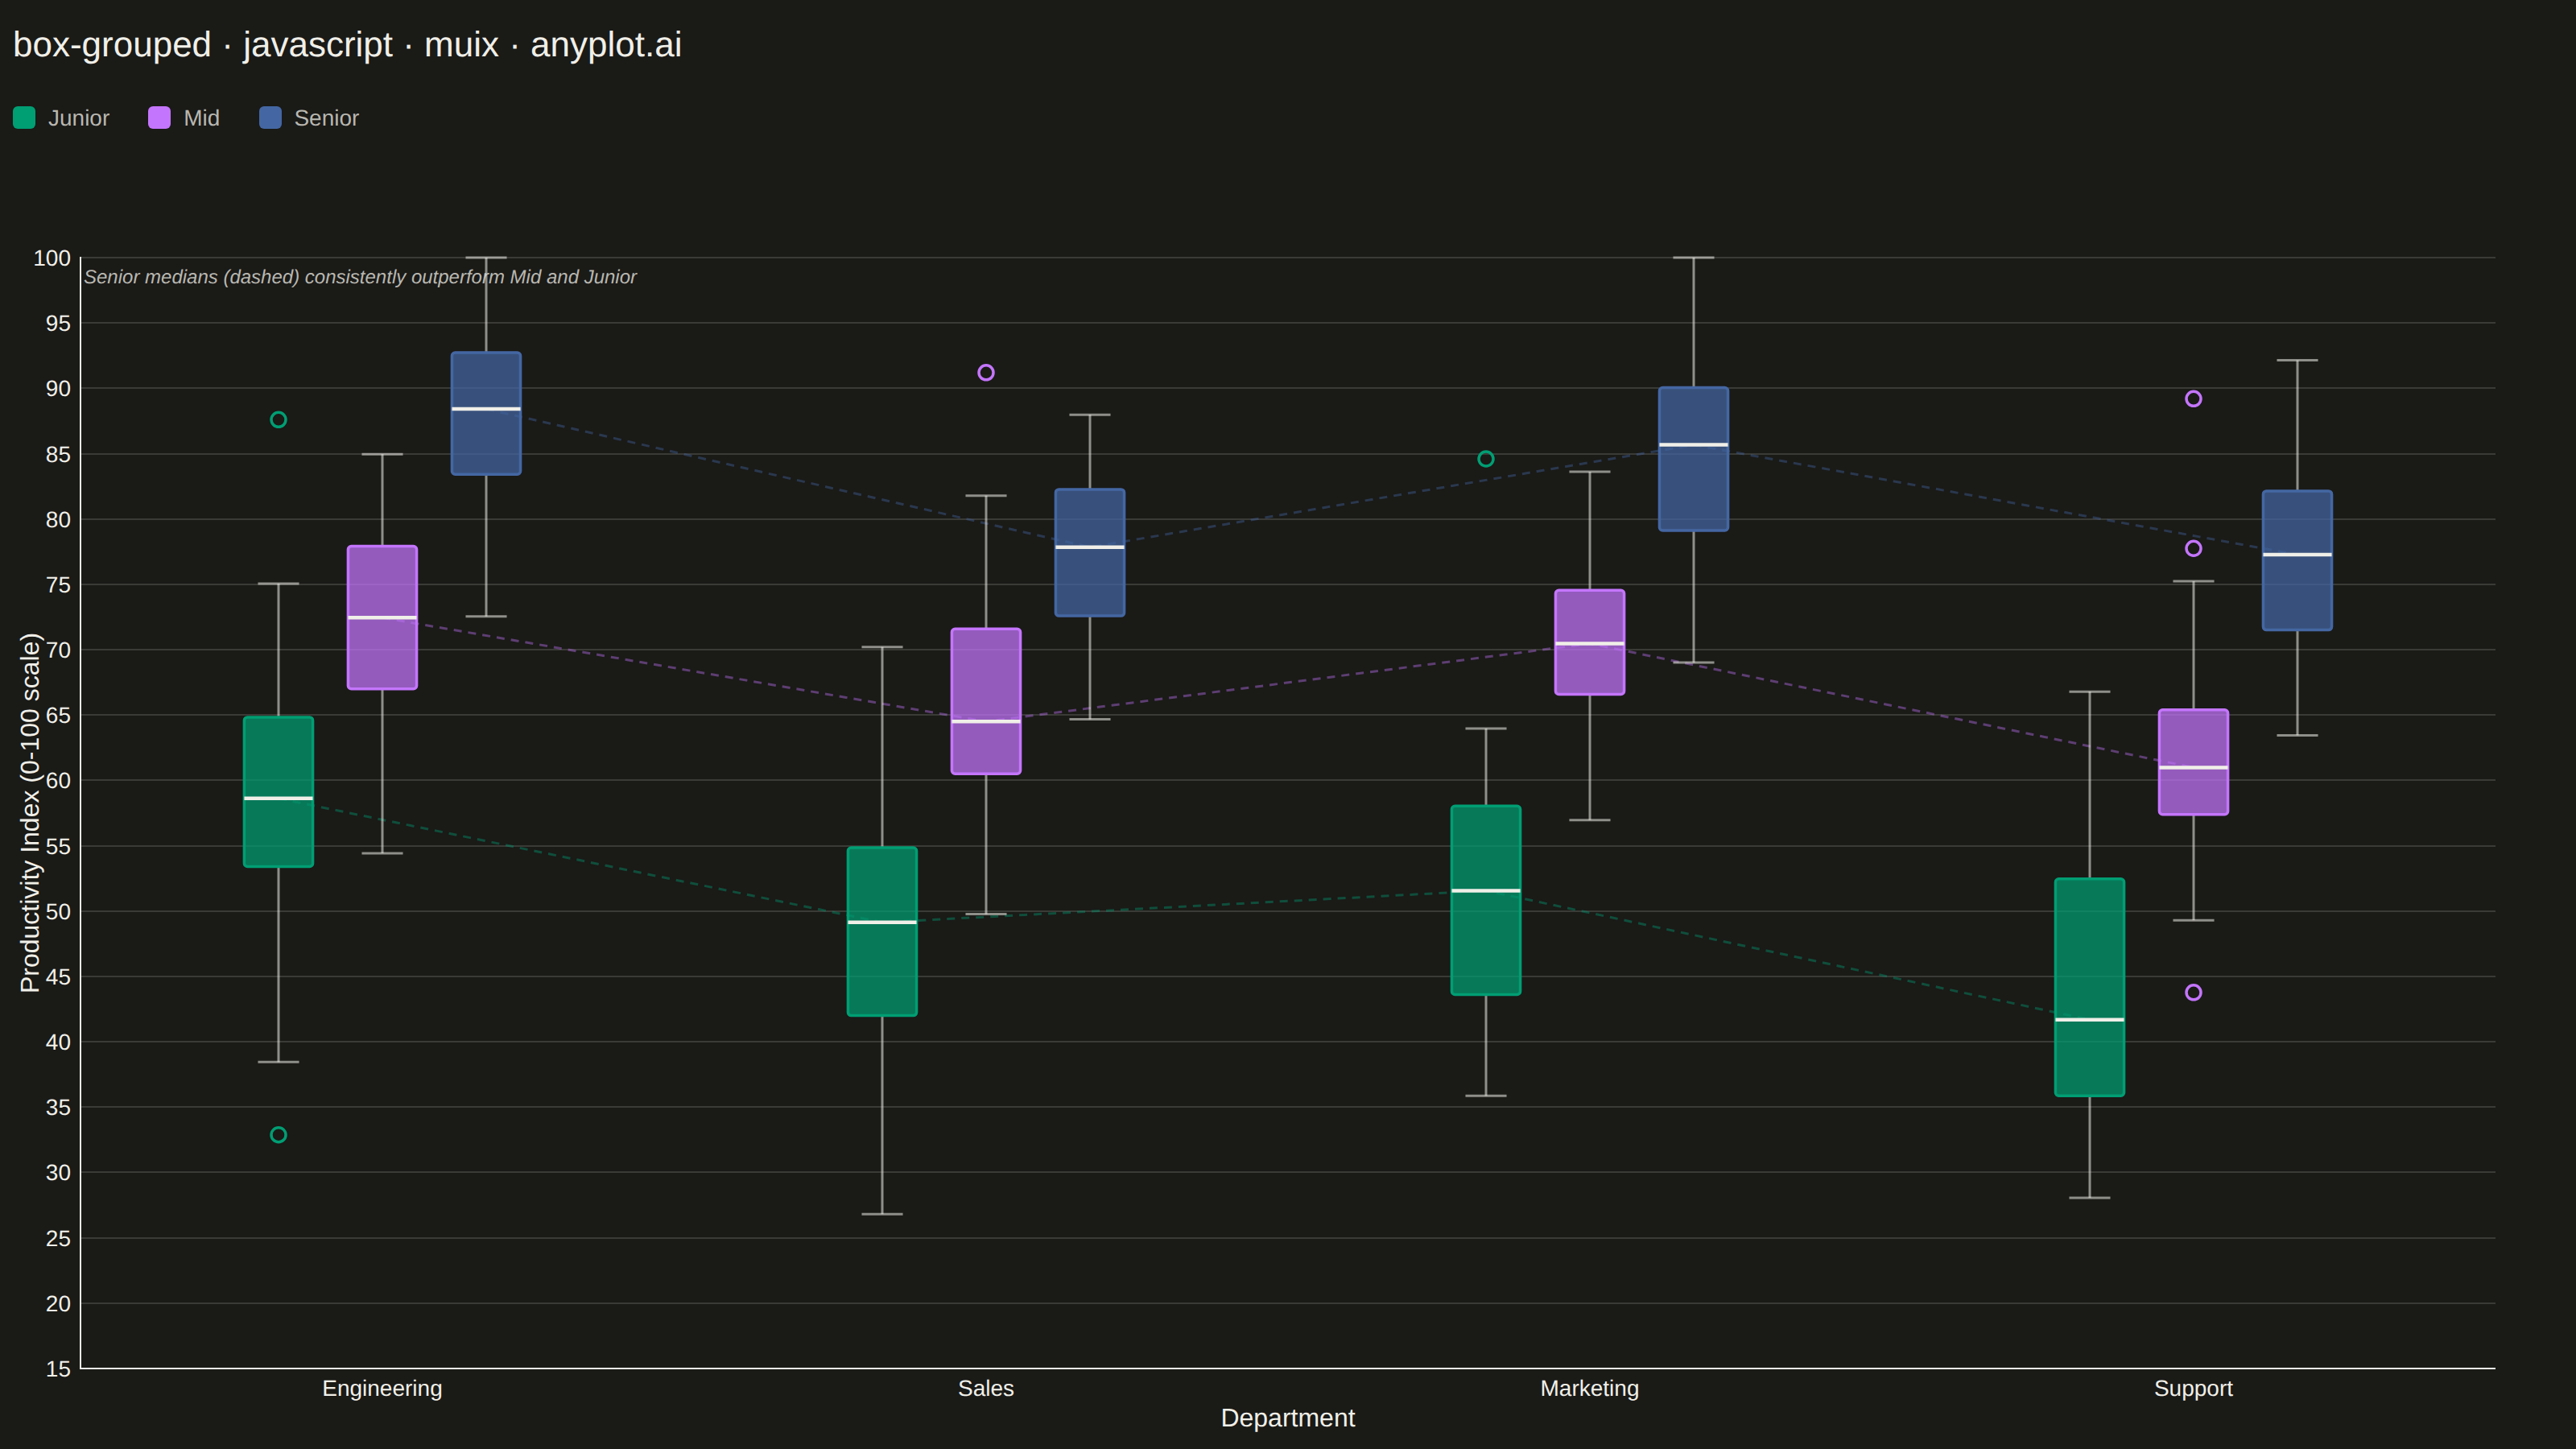
A grouped box plot displays multiple box plots side-by-side within each category, enabling comparison of distributions across subgroups. Each group contains boxes representing different subcategories or conditions, making it ideal for multi-factor comparisons and A/B testing scenarios with multiple metrics.
// anyplot.ai
// box-grouped: Grouped Box Plot
// Library: muix 7.29.1 | JavaScript 22.23.2
// Quality: 92/100 | Created: 2026-08-18
import { ChartContainer } from "@mui/x-charts/ChartContainer";
import { ChartsXAxis } from "@mui/x-charts/ChartsXAxis";
import { ChartsYAxis } from "@mui/x-charts/ChartsYAxis";
import { ChartsGrid } from "@mui/x-charts/ChartsGrid";
import { useXScale, useYScale } from "@mui/x-charts/hooks";

const t = window.ANYPLOT_TOKENS;

// --- Deterministic data (tiny fixed-seed LCG — the browser has no seeded RNG) ---
function makeLcg(seed) {
  let state = seed >>> 0;
  return function next() {
    state = (state * 1664525 + 1013904223) >>> 0;
    return state / 4294967296;
  };
}

function randomNormal(rng, mean, std) {
  const u1 = Math.max(rng(), 1e-9);
  const u2 = rng();
  const z = Math.sqrt(-2 * Math.log(u1)) * Math.cos(2 * Math.PI * u2);
  return mean + z * std;
}

const rng = makeLcg(42);
const departments = ["Engineering", "Sales", "Marketing", "Support"];
const levels = ["Junior", "Mid", "Senior"];
const levelParams = {
  Junior: { mean: 52, std: 9 },
  Mid: { mean: 68, std: 8 },
  Senior: { mean: 82, std: 7 },
};
const departmentOffset = {
  Engineering: 5,
  Sales: -4,
  Marketing: 2,
  Support: -6,
};

// productivity index per department + seniority level (0-100 composite score)
const rawValues = {};
departments.forEach((department, di) => {
  rawValues[department] = {};
  levels.forEach((level, li) => {
    const { mean, std } = levelParams[level];
    const sampleCount = 46;
    const values = [];
    for (let i = 0; i < sampleCount; i++) {
      const value = randomNormal(rng, mean + departmentOffset[department], std);
      values.push(Math.min(100, Math.max(0, value)));
    }
    // A handful of groups get a deliberate extreme performer so the chart
    // demonstrates the outlier convention the spec asks for.
    if ((di + li) % 2 === 0) {
      values.push(Math.min(100, Math.max(0, mean + departmentOffset[department] + 3.4 * std)));
    }
    rawValues[department][level] = values;
  });
});

function quantile(sortedValues, q) {
  const position = (sortedValues.length - 1) * q;
  const base = Math.floor(position);
  const rest = position - base;
  return sortedValues[base + 1] !== undefined
    ? sortedValues[base] + rest * (sortedValues[base + 1] - sortedValues[base])
    : sortedValues[base];
}

function boxStatistics(values) {
  const sorted = [...values].sort((a, b) => a - b);
  const q1 = quantile(sorted, 0.25);
  const median = quantile(sorted, 0.5);
  const q3 = quantile(sorted, 0.75);
  const iqr = q3 - q1;
  const lowerFence = q1 - 1.5 * iqr;
  const upperFence = q3 + 1.5 * iqr;
  const inliers = sorted.filter((value) => value >= lowerFence && value <= upperFence);
  return {
    q1,
    median,
    q3,
    whiskerMin: inliers.length ? inliers[0] : q1,
    whiskerMax: inliers.length ? inliers[inliers.length - 1] : q3,
    outliers: sorted.filter((value) => value < lowerFence || value > upperFence),
  };
}

const boxGroups = departments.map((department) => ({
  department,
  boxes: levels.map((level) => ({ level, stats: boxStatistics(rawValues[department][level]) })),
}));

const allValues = departments.flatMap((department) => levels.flatMap((level) => rawValues[department][level]));
const dataMin = Math.min(...allValues);
const dataMax = Math.max(...allValues);
const valuePadding = (dataMax - dataMin) * 0.12;
const yMin = Math.max(0, Math.floor((dataMin - valuePadding) / 5) * 5);
const yMax = Math.min(100, Math.ceil((dataMax + valuePadding) / 5) * 5);

function BoxWhiskerLayer() {
  const xScale = useXScale();
  const yScale = useYScale();

  const bandwidth = xScale.bandwidth();
  const groupWidth = bandwidth * 0.86;
  const boxSlot = groupWidth / levels.length;
  const boxWidth = boxSlot * 0.66;
  const capWidth = boxWidth * 0.6;

  // Dashed median trend per level makes the consistent Senior > Mid > Junior
  // pattern an explicit visual thread rather than something left for the
  // reader to infer box-by-box.
  const levelTrends = levels.map((level, levelIndex) => ({
    level,
    color: t.palette[levelIndex],
    points: boxGroups.map((group) => {
      const bandStart = xScale(group.department) ?? 0;
      const groupStart = bandStart + (bandwidth - groupWidth) / 2;
      const cx = groupStart + boxSlot * (levelIndex + 0.5);
      return { x: cx, y: yScale(group.boxes[levelIndex].stats.median) };
    }),
  }));

  return (
    <g>
      {levelTrends.map((trend) => (
        <polyline
          key={`trend-${trend.level}`}
          points={trend.points.map((p) => `${p.x},${p.y}`).join(" ")}
          fill="none"
          stroke={trend.color}
          strokeWidth={1.5}
          strokeDasharray="5 4"
          opacity={0.4}
        />
      ))}
      <text x={(xScale.range()?.[0] ?? 0) + 2} y={yScale(yMax) + 16} fontSize={12} fontStyle="italic" fill={t.inkSoft}>
        Senior medians (dashed) consistently outperform Mid and Junior
      </text>
      {boxGroups.map((group) => {
        const bandStart = xScale(group.department) ?? 0;
        const groupStart = bandStart + (bandwidth - groupWidth) / 2;
        return group.boxes.map((box, levelIndex) => {
          const cx = groupStart + boxSlot * (levelIndex + 0.5);
          const color = t.palette[levelIndex];
          const yQ1 = yScale(box.stats.q1);
          const yQ3 = yScale(box.stats.q3);
          const yMedian = yScale(box.stats.median);
          const yWhiskerHigh = yScale(box.stats.whiskerMax);
          const yWhiskerLow = yScale(box.stats.whiskerMin);
          return (
            <g key={`${group.department}-${box.level}`}>
              <line x1={cx} x2={cx} y1={yWhiskerHigh} y2={yQ3} stroke={t.ink} strokeWidth={1.5} opacity={0.55} />
              <line x1={cx} x2={cx} y1={yQ1} y2={yWhiskerLow} stroke={t.ink} strokeWidth={1.5} opacity={0.55} />
              <line
                x1={cx - capWidth / 2}
                x2={cx + capWidth / 2}
                y1={yWhiskerHigh}
                y2={yWhiskerHigh}
                stroke={t.ink}
                strokeWidth={1.5}
                opacity={0.55}
              />
              <line
                x1={cx - capWidth / 2}
                x2={cx + capWidth / 2}
                y1={yWhiskerLow}
                y2={yWhiskerLow}
                stroke={t.ink}
                strokeWidth={1.5}
                opacity={0.55}
              />
              <rect
                x={cx - boxWidth / 2}
                y={yQ3}
                width={boxWidth}
                height={Math.max(yQ1 - yQ3, 1)}
                rx={2}
                fill={color}
                fillOpacity={0.72}
                stroke={color}
                strokeWidth={1.75}
              />
              <line
                x1={cx - boxWidth / 2}
                x2={cx + boxWidth / 2}
                y1={yMedian}
                y2={yMedian}
                stroke={t.ink}
                strokeWidth={2.25}
              />
              {box.stats.outliers.map((value, outlierIndex) => (
                <circle
                  key={outlierIndex}
                  cx={cx}
                  cy={yScale(value)}
                  r={4.5}
                  fill="none"
                  stroke={color}
                  strokeWidth={1.75}
                />
              ))}
            </g>
          );
        });
      })}
    </g>
  );
}

const titleText = "box-grouped · javascript · muix · anyplot.ai";
const titleHeight = 56;
const legendHeight = 34;
const chartWidth = window.ANYPLOT_SIZE.width;
const chartHeight = window.ANYPLOT_SIZE.height - titleHeight - legendHeight - 20;

export default function Chart() {
  return (
    <div style={{ width: chartWidth, height: window.ANYPLOT_SIZE.height, display: "flex", flexDirection: "column" }}>
      <div style={{ height: titleHeight, display: "flex", alignItems: "center", paddingLeft: 8 }}>
        <span style={{ fontSize: 22, fontWeight: 500, color: t.ink }}>{titleText}</span>
      </div>
      <div style={{ height: legendHeight, display: "flex", alignItems: "center", gap: 24, paddingLeft: 8 }}>
        {levels.map((level, i) => (
          <div key={level} style={{ display: "flex", alignItems: "center", gap: 8 }}>
            <span style={{ width: 14, height: 14, borderRadius: 3, background: t.palette[i], display: "inline-block" }} />
            <span style={{ fontSize: 14, color: t.inkSoft }}>{level}</span>
          </div>
        ))}
      </div>
      <div style={{ height: 20 }} />
      <ChartContainer
        width={chartWidth}
        height={chartHeight}
        series={[]}
        xAxis={[
          {
            scaleType: "band",
            data: departments,
            categoryGapRatio: 0.4,
            disableTicks: true,
            label: "Department",
            labelStyle: { fontSize: 16 },
            tickLabelStyle: { fontSize: 14 },
          },
        ]}
        yAxis={[
          {
            min: yMin,
            max: yMax,
            disableTicks: true,
            label: "Productivity Index (0-100 scale)",
            labelStyle: { fontSize: 16 },
            tickLabelStyle: { fontSize: 14 },
          },
        ]}
      >
        <ChartsGrid horizontal />
        <BoxWhiskerLayer />
        <ChartsXAxis />
        <ChartsYAxis />
      </ChartContainer>
    </div>
  );
}
Runnable source as JSON, for any HTTP client: https://api.anyplot.ai/specs/box-grouped/muix/code. Any spec id and library id listed in llms-full.txt fit the same URL shape; every URL below is complete and callable.
{
  "spec_id": "box-grouped",
  "language": "javascript",
  "library": "muix",
  "page": "https://anyplot.ai/box-grouped/javascript/muix",
  "hub": "https://anyplot.ai/box-grouped",
  "code_json": "https://api.anyplot.ai/specs/box-grouped/muix/code",
  "spec_json": "https://api.anyplot.ai/specs/box-grouped",
  "render_light_png": "https://storage.googleapis.com/anyplot-images/plots/box-grouped/javascript/muix/plot-light.png",
  "render_dark_png": "https://storage.googleapis.com/anyplot-images/plots/box-grouped/javascript/muix/plot-dark.png",
  "interactive_light_html": "https://storage.googleapis.com/anyplot-images/plots/box-grouped/javascript/muix/plot-light.html",
  "interactive_dark_html": "https://storage.googleapis.com/anyplot-images/plots/box-grouped/javascript/muix/plot-dark.html",
  "quality_score": 92.0,
  "license": "MIT",
  "guide": "https://anyplot.ai/llms.txt"
}
Part of Grouped Box Plot on anyplot.ai.