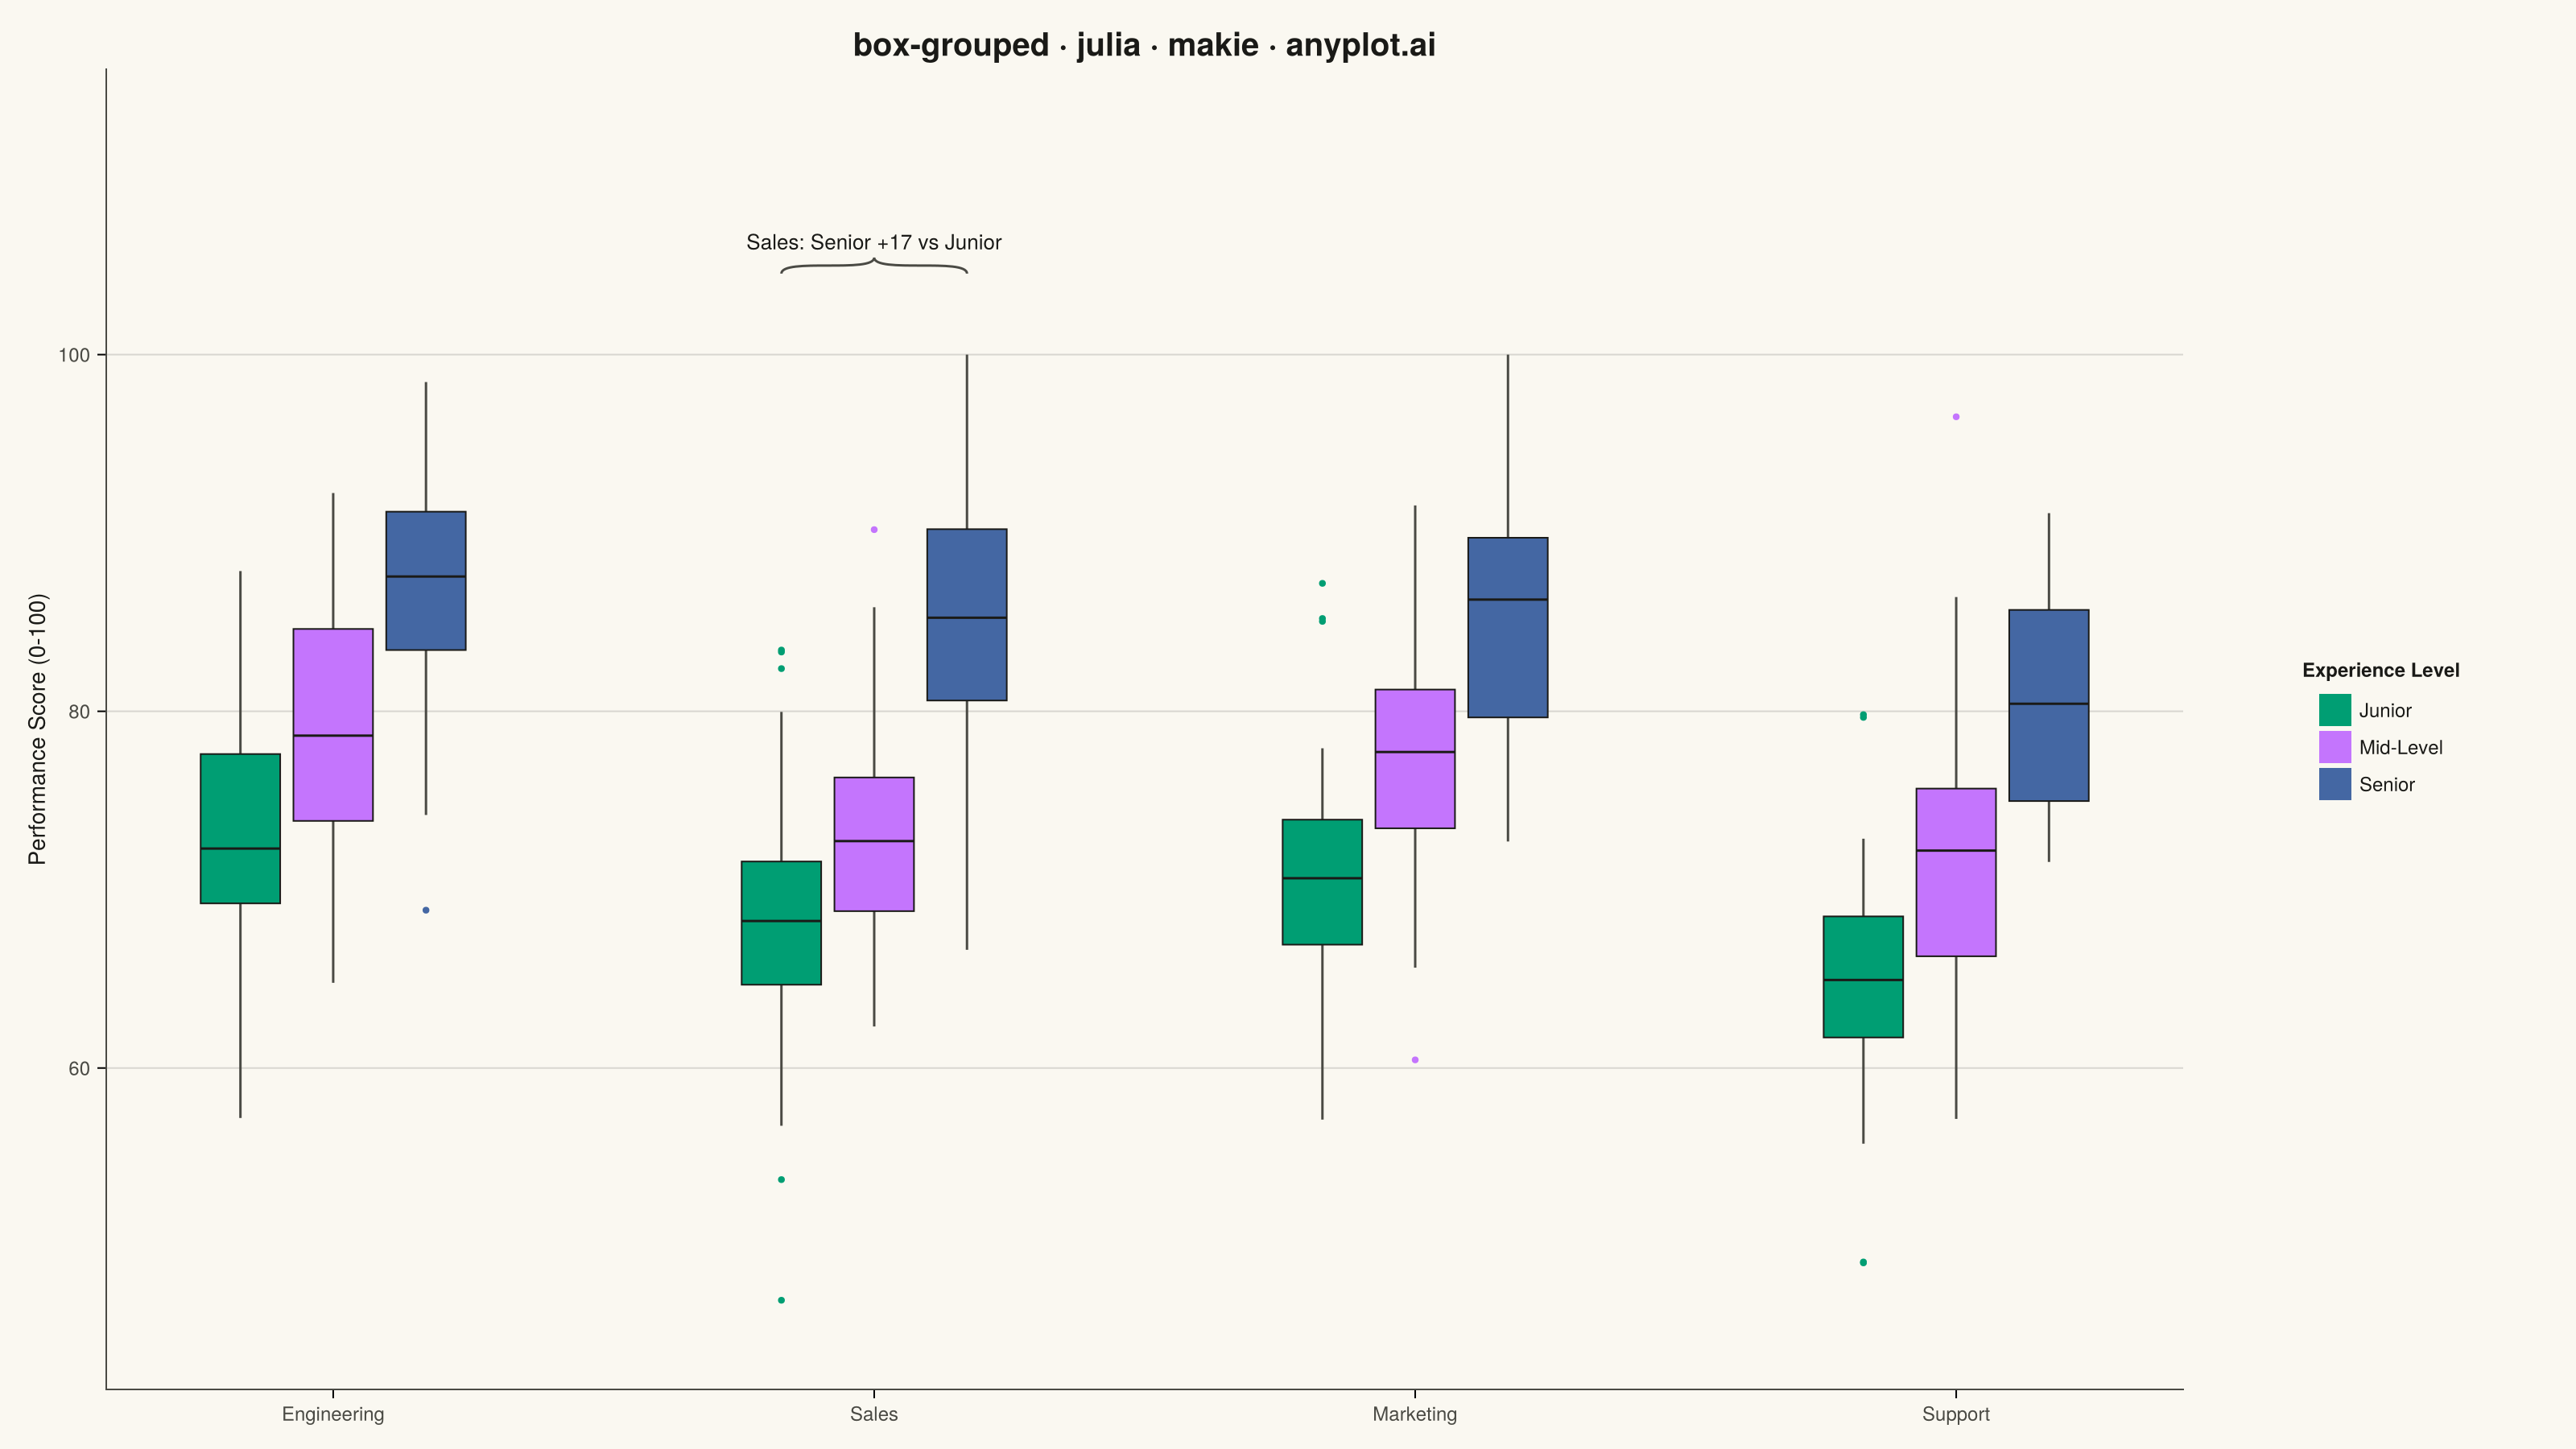
The same plot in 14 other libraries — Python: Altair, Bokeh, lets-plot, Matplotlib, Plotly, plotnine, Pygal, Seaborn; R: ggplot2; JavaScript: Chart.js, D3.js, Apache ECharts, Highcharts, MUI X Charts. Compare all 15 side by side: Grouped Box Plot in Python, R, Julia and JavaScript.
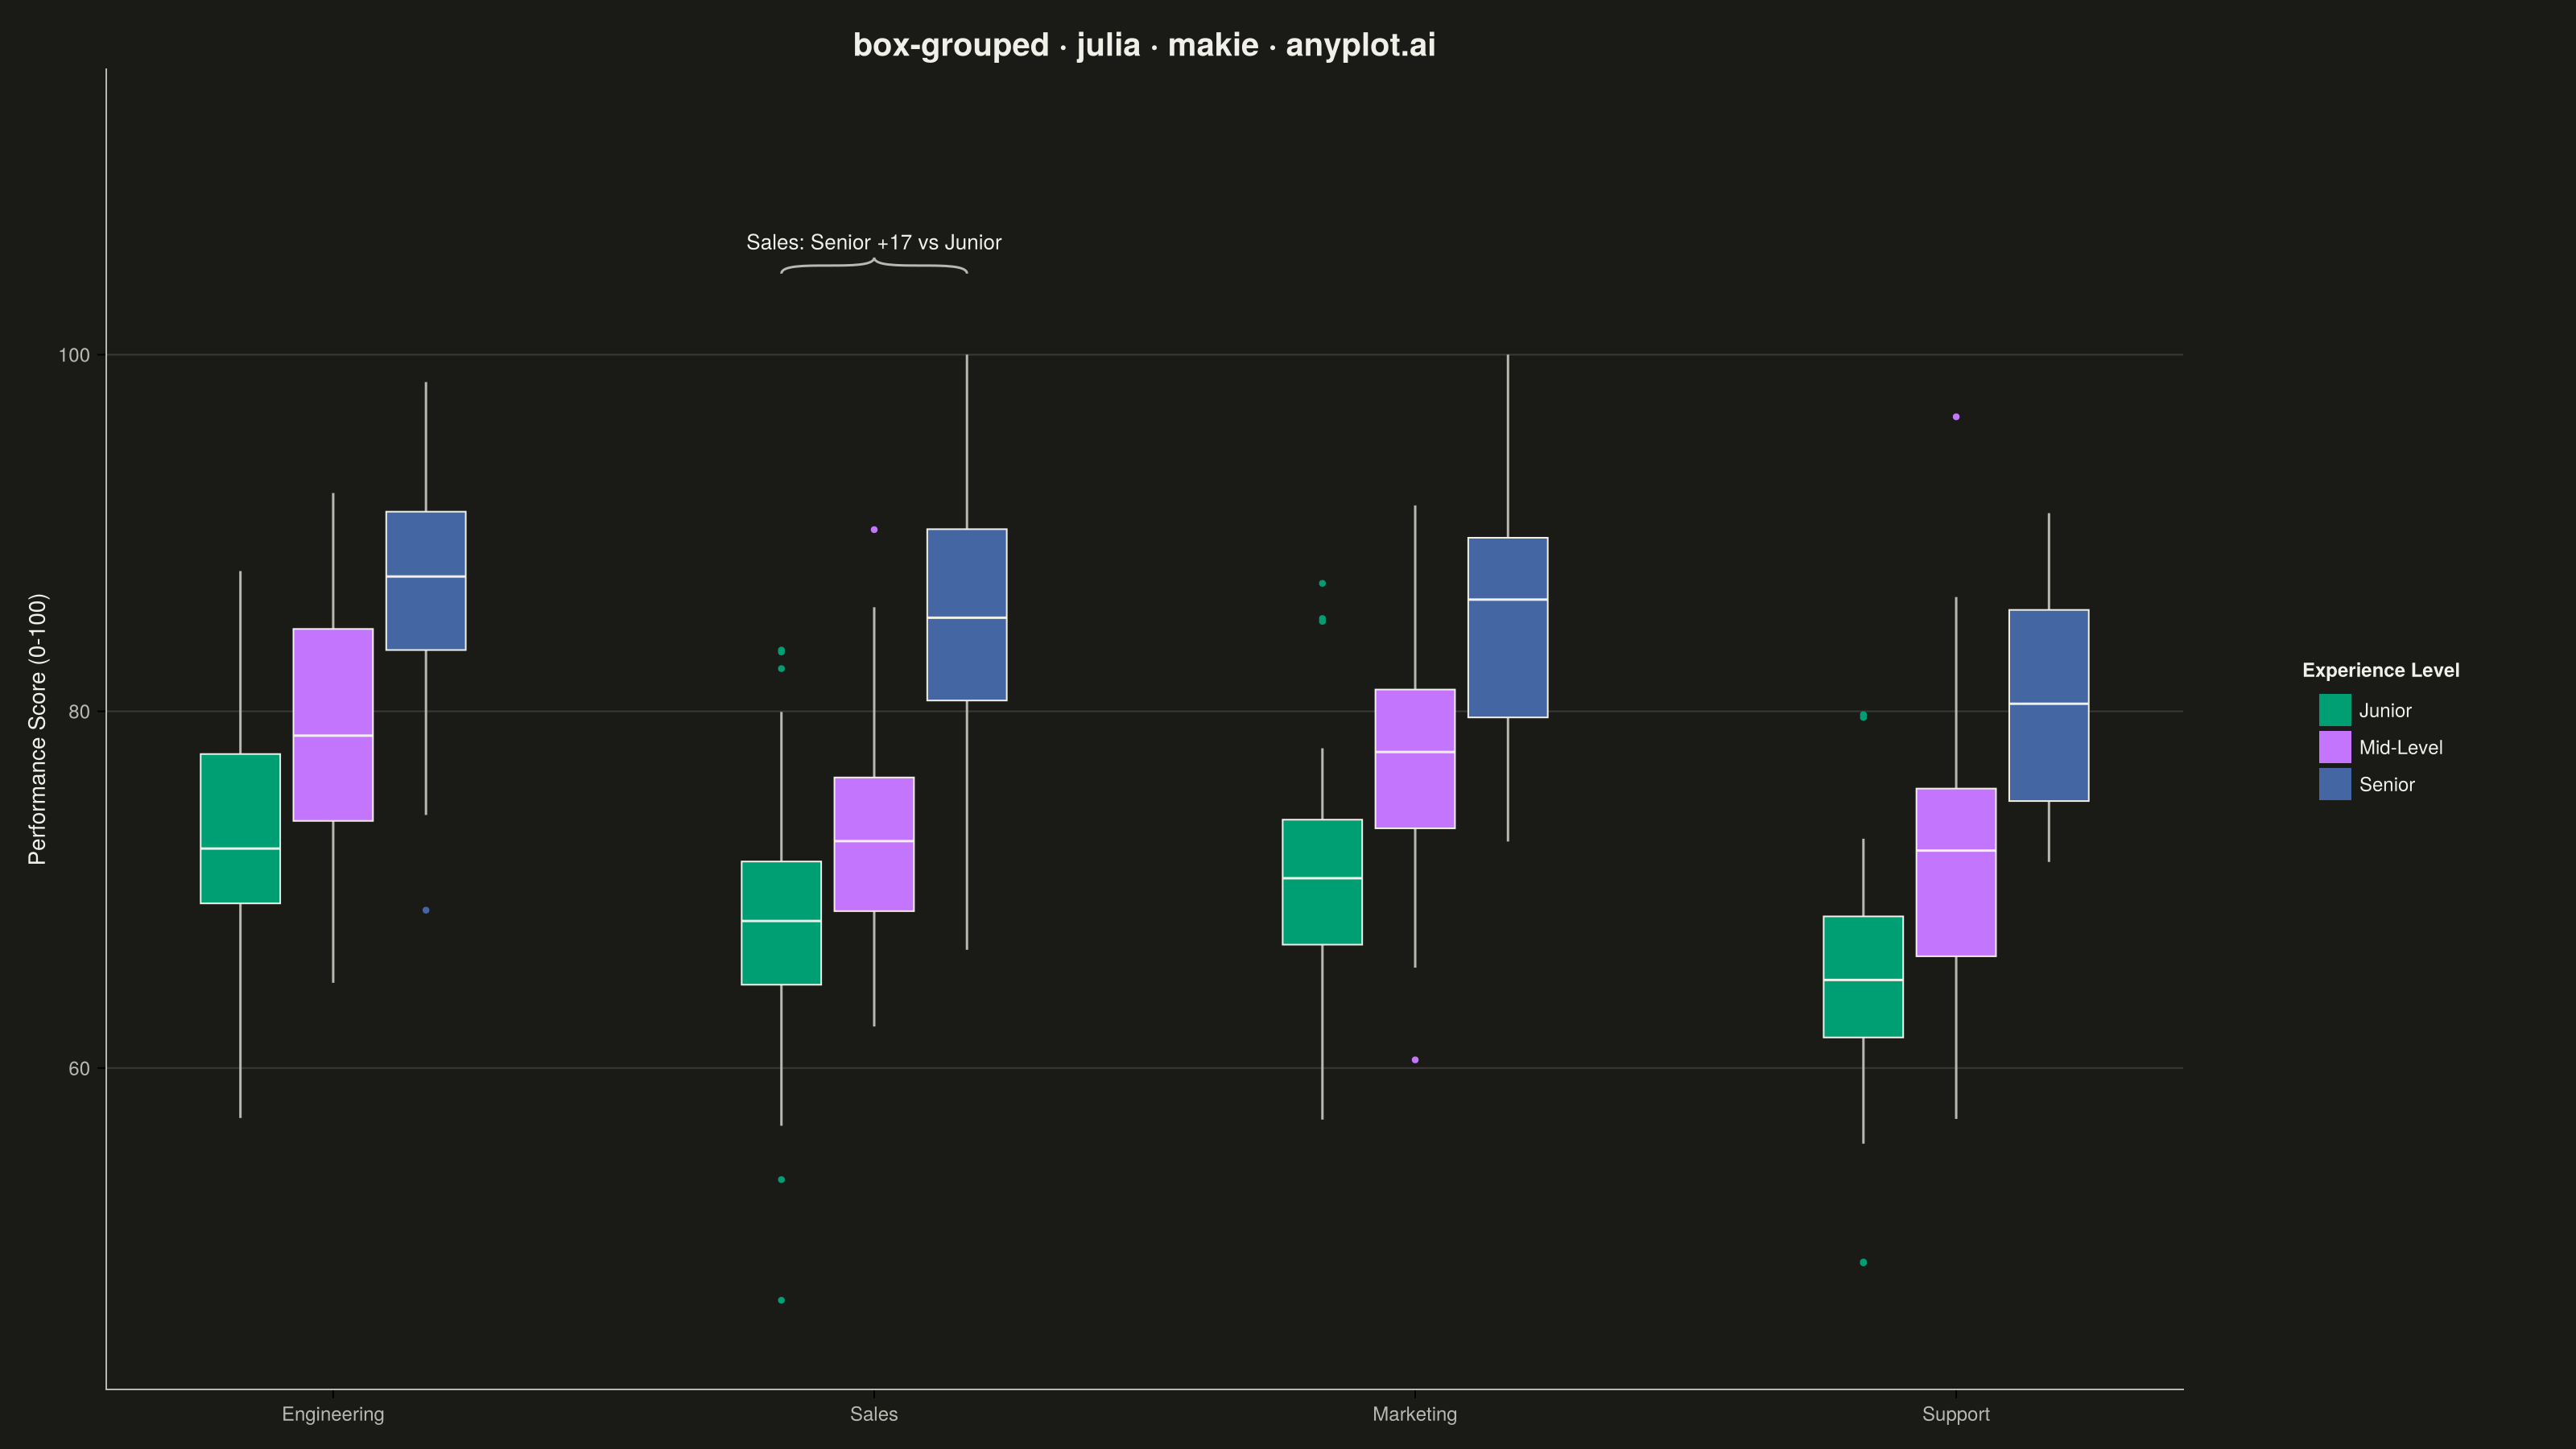
A grouped box plot displays multiple box plots side-by-side within each category, enabling comparison of distributions across subgroups. Each group contains boxes representing different subcategories or conditions, making it ideal for multi-factor comparisons and A/B testing scenarios with multiple metrics.
# anyplot.ai
# box-grouped: Grouped Box Plot
# Library: makie 0.21.9 | Julia 1.11.9
# Quality: 93/100 | Created: 2026-08-18

using CairoMakie
using Colors
using Random
using Statistics

Random.seed!(42)

# Theme tokens (see prompts/default-style-guide.md "Theme-adaptive Chrome")
const THEME    = get(ENV, "ANYPLOT_THEME", "light")
const PAGE_BG  = THEME == "light" ? colorant"#FAF8F1" : colorant"#1A1A17"
const INK      = THEME == "light" ? colorant"#1A1A17" : colorant"#F0EFE8"
const INK_SOFT = THEME == "light" ? colorant"#4A4A44" : colorant"#B8B7B0"

# Imprint categorical palette — 8 hues, theme-independent, hybrid-v3 sort
const IMPRINT_PALETTE = [
    colorant"#009E73",  # 1 — brand green
    colorant"#C475FD",  # 2 — lavender
    colorant"#4467A3",  # 3 — blue
]

# Data — quarterly performance review scores by department and experience level
const DEPARTMENTS = ["Engineering", "Sales", "Marketing", "Support"]
const EXPERIENCE_LEVELS = ["Junior", "Mid-Level", "Senior"]
const DEPT_BASELINE = [72.0, 68.0, 70.0, 65.0]
const EXPERIENCE_BONUS = [0.0, 7.0, 15.0]
const N_PER_GROUP = 45

category_idx = Int[]
subgroup_idx = Int[]
performance_scores = Float64[]

for (ci, baseline) in enumerate(DEPT_BASELINE)
    for (si, bonus) in enumerate(EXPERIENCE_BONUS)
        scores = clamp.(baseline .+ bonus .+ randn(N_PER_GROUP) .* 7.0, 20.0, 100.0)
        append!(performance_scores, scores)
        append!(category_idx, fill(ci, N_PER_GROUP))
        append!(subgroup_idx, fill(si, N_PER_GROUP))
    end
end

point_colors = IMPRINT_PALETTE[subgroup_idx]

# Storytelling focal point — find the department where the Senior/Junior
# experience-tier gap is widest, to call it out with a comparison bracket.
const BOX_WIDTH     = 0.7
const BOX_GAP       = 0.3
const BOX_DODGE_GAP = 0.05
const N_DODGE       = length(EXPERIENCE_LEVELS)

# Mirrors Makie's internal `compute_x_and_width` dodge formula so the bracket
# lines up exactly with the boxplot's dodged box positions.
function dodge_x(category, subgroup_i)
    eff_width   = BOX_WIDTH * (1 - BOX_GAP)
    dodge_width = (1 - (N_DODGE - 1) * BOX_DODGE_GAP) / N_DODGE
    shift       = (dodge_width - 1) / 2 + (subgroup_i - 1) * (dodge_width + BOX_DODGE_GAP)
    return category + eff_width * shift
end

dept_gaps = [
    median(performance_scores[(category_idx .== ci) .& (subgroup_idx .== 3)]) -
    median(performance_scores[(category_idx .== ci) .& (subgroup_idx .== 1)])
    for ci in 1:length(DEPARTMENTS)
]
standout_ci  = argmax(dept_gaps)
standout_gap = dept_gaps[standout_ci]
bracket_x1   = dodge_x(standout_ci, 1)  # Junior box
bracket_x2   = dodge_x(standout_ci, 3)  # Senior box
bracket_y    = maximum(performance_scores[category_idx .== standout_ci]) + 4.0

# Plot — see default-style-guide.md "Visual Sizing Defaults" for canvas + sizing values
title_str = "box-grouped · julia · makie · anyplot.ai"

fig = Figure(
    resolution      = (1600, 900),
    fontsize        = 14,
    backgroundcolor = PAGE_BG,
)

ax = Axis(
    fig[1, 1];
    title             = title_str,
    titlesize         = 20,
    titlecolor        = INK,
    ylabel            = "Performance Score (0-100)",
    ylabelsize        = 14,
    ylabelcolor       = INK,
    xticks            = (1:length(DEPARTMENTS), DEPARTMENTS),
    xticklabelsize    = 12,
    yticklabelsize    = 12,
    xticklabelcolor   = INK_SOFT,
    yticklabelcolor   = INK_SOFT,
    backgroundcolor   = PAGE_BG,
    topspinevisible    = false,
    rightspinevisible  = false,
    leftspinecolor     = INK_SOFT,
    bottomspinecolor   = INK_SOFT,
    xgridvisible       = false,
    ygridcolor         = RGBAf(INK.r, INK.g, INK.b, 0.15),
)

boxplot!(
    ax, category_idx, performance_scores;
    dodge         = subgroup_idx,
    color         = point_colors,
    width         = 0.7,
    dodge_gap     = 0.05,
    gap           = 0.3,
    strokecolor   = INK,
    strokewidth   = 1,
    mediancolor   = INK,
    whiskercolor  = INK_SOFT,
    markersize    = 6,
)

bracket!(
    ax,
    bracket_x1, bracket_y, bracket_x2, bracket_y;
    text        = "$(DEPARTMENTS[standout_ci]): Senior +$(round(Int, standout_gap)) vs Junior",
    offset      = 6,
    width       = 10,
    orientation = :up,
    color       = INK_SOFT,
    textcolor   = INK,
    fontsize    = 13,
)
ylims!(ax, minimum(performance_scores) - 5.0, maximum(performance_scores) + 16.0)

legend_elements = [PolyElement(color = c, strokecolor = :transparent) for c in IMPRINT_PALETTE]
Legend(
    fig[1, 2], legend_elements, EXPERIENCE_LEVELS, "Experience Level";
    framevisible = false,
    labelcolor   = INK,
    titlecolor   = INK,
    labelsize    = 12,
    titlesize    = 12,
)
colsize!(fig.layout, 2, Relative(0.14))

# Save
save("plot-$(THEME).png", fig; px_per_unit = 2)
Runnable source as JSON, for any HTTP client: https://api.anyplot.ai/specs/box-grouped/makie/code. Any spec id and library id listed in llms-full.txt fit the same URL shape; every URL below is complete and callable.
{
  "spec_id": "box-grouped",
  "language": "julia",
  "library": "makie",
  "page": "https://anyplot.ai/box-grouped/julia/makie",
  "hub": "https://anyplot.ai/box-grouped",
  "code_json": "https://api.anyplot.ai/specs/box-grouped/makie/code",
  "spec_json": "https://api.anyplot.ai/specs/box-grouped",
  "render_light_png": "https://storage.googleapis.com/anyplot-images/plots/box-grouped/julia/makie/plot-light.png",
  "render_dark_png": "https://storage.googleapis.com/anyplot-images/plots/box-grouped/julia/makie/plot-dark.png",
  "quality_score": 93.0,
  "license": "MIT",
  "guide": "https://anyplot.ai/llms.txt"
}
Part of Grouped Box Plot on anyplot.ai.