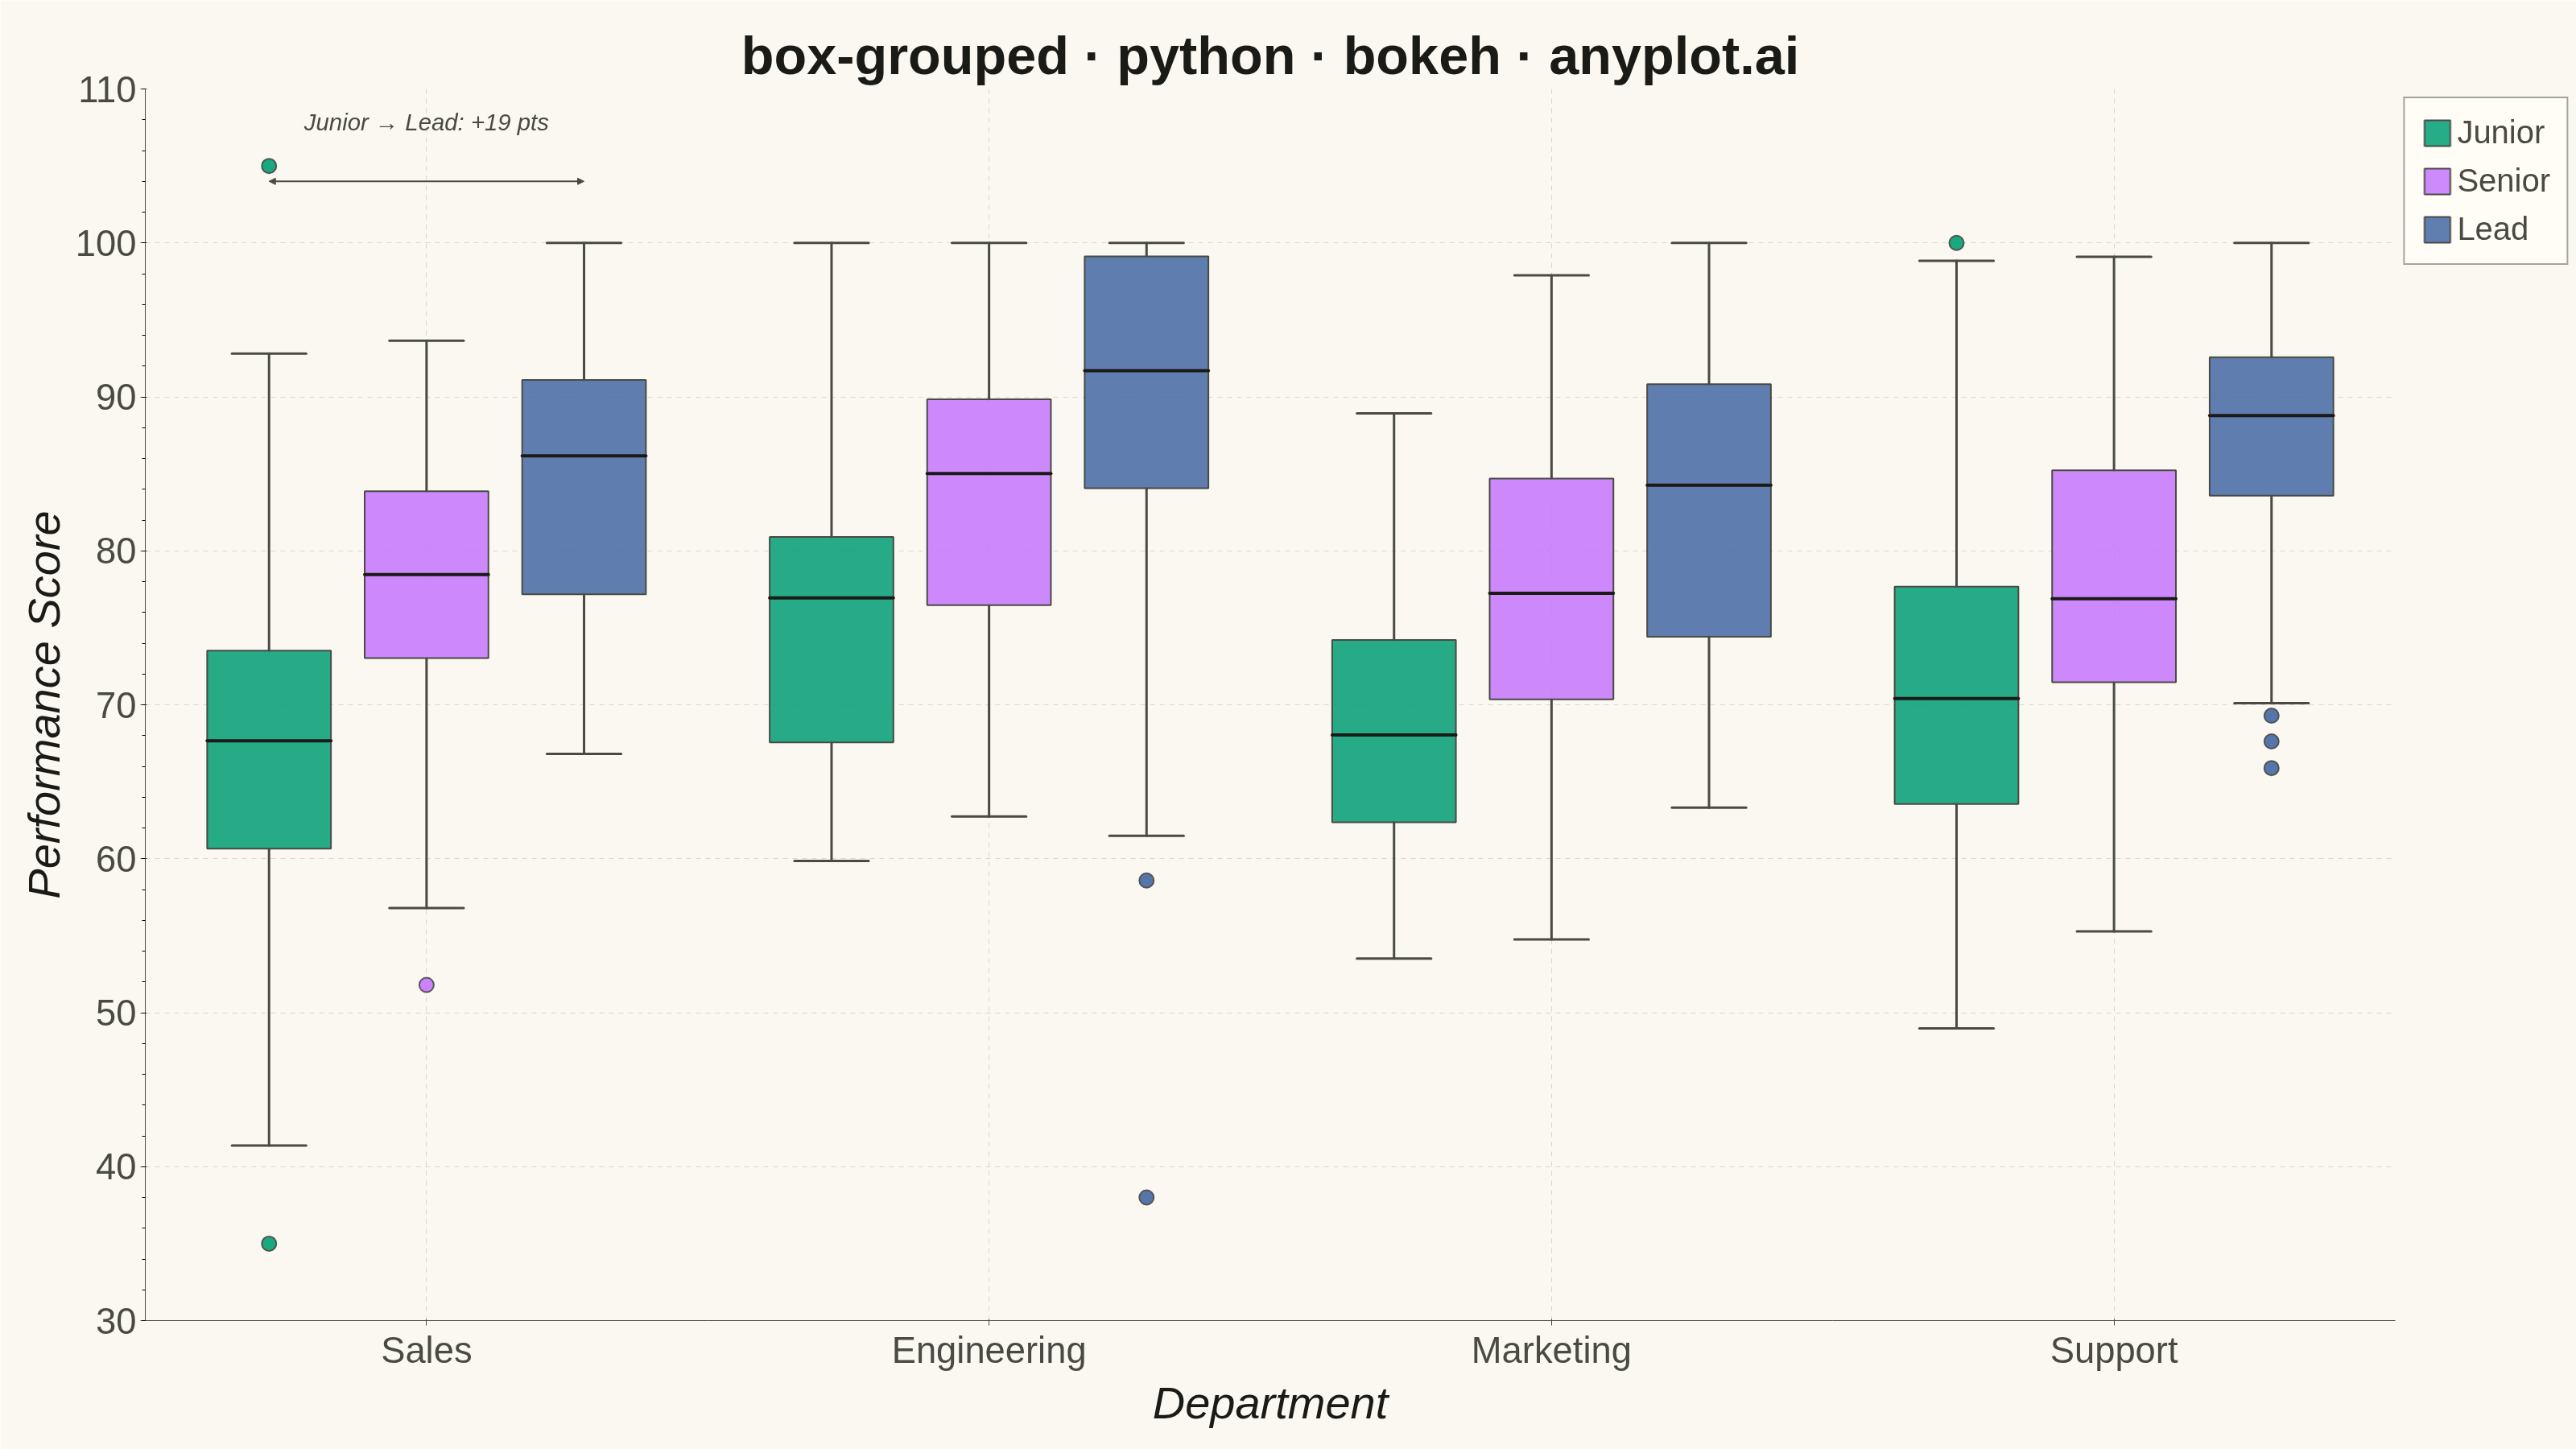
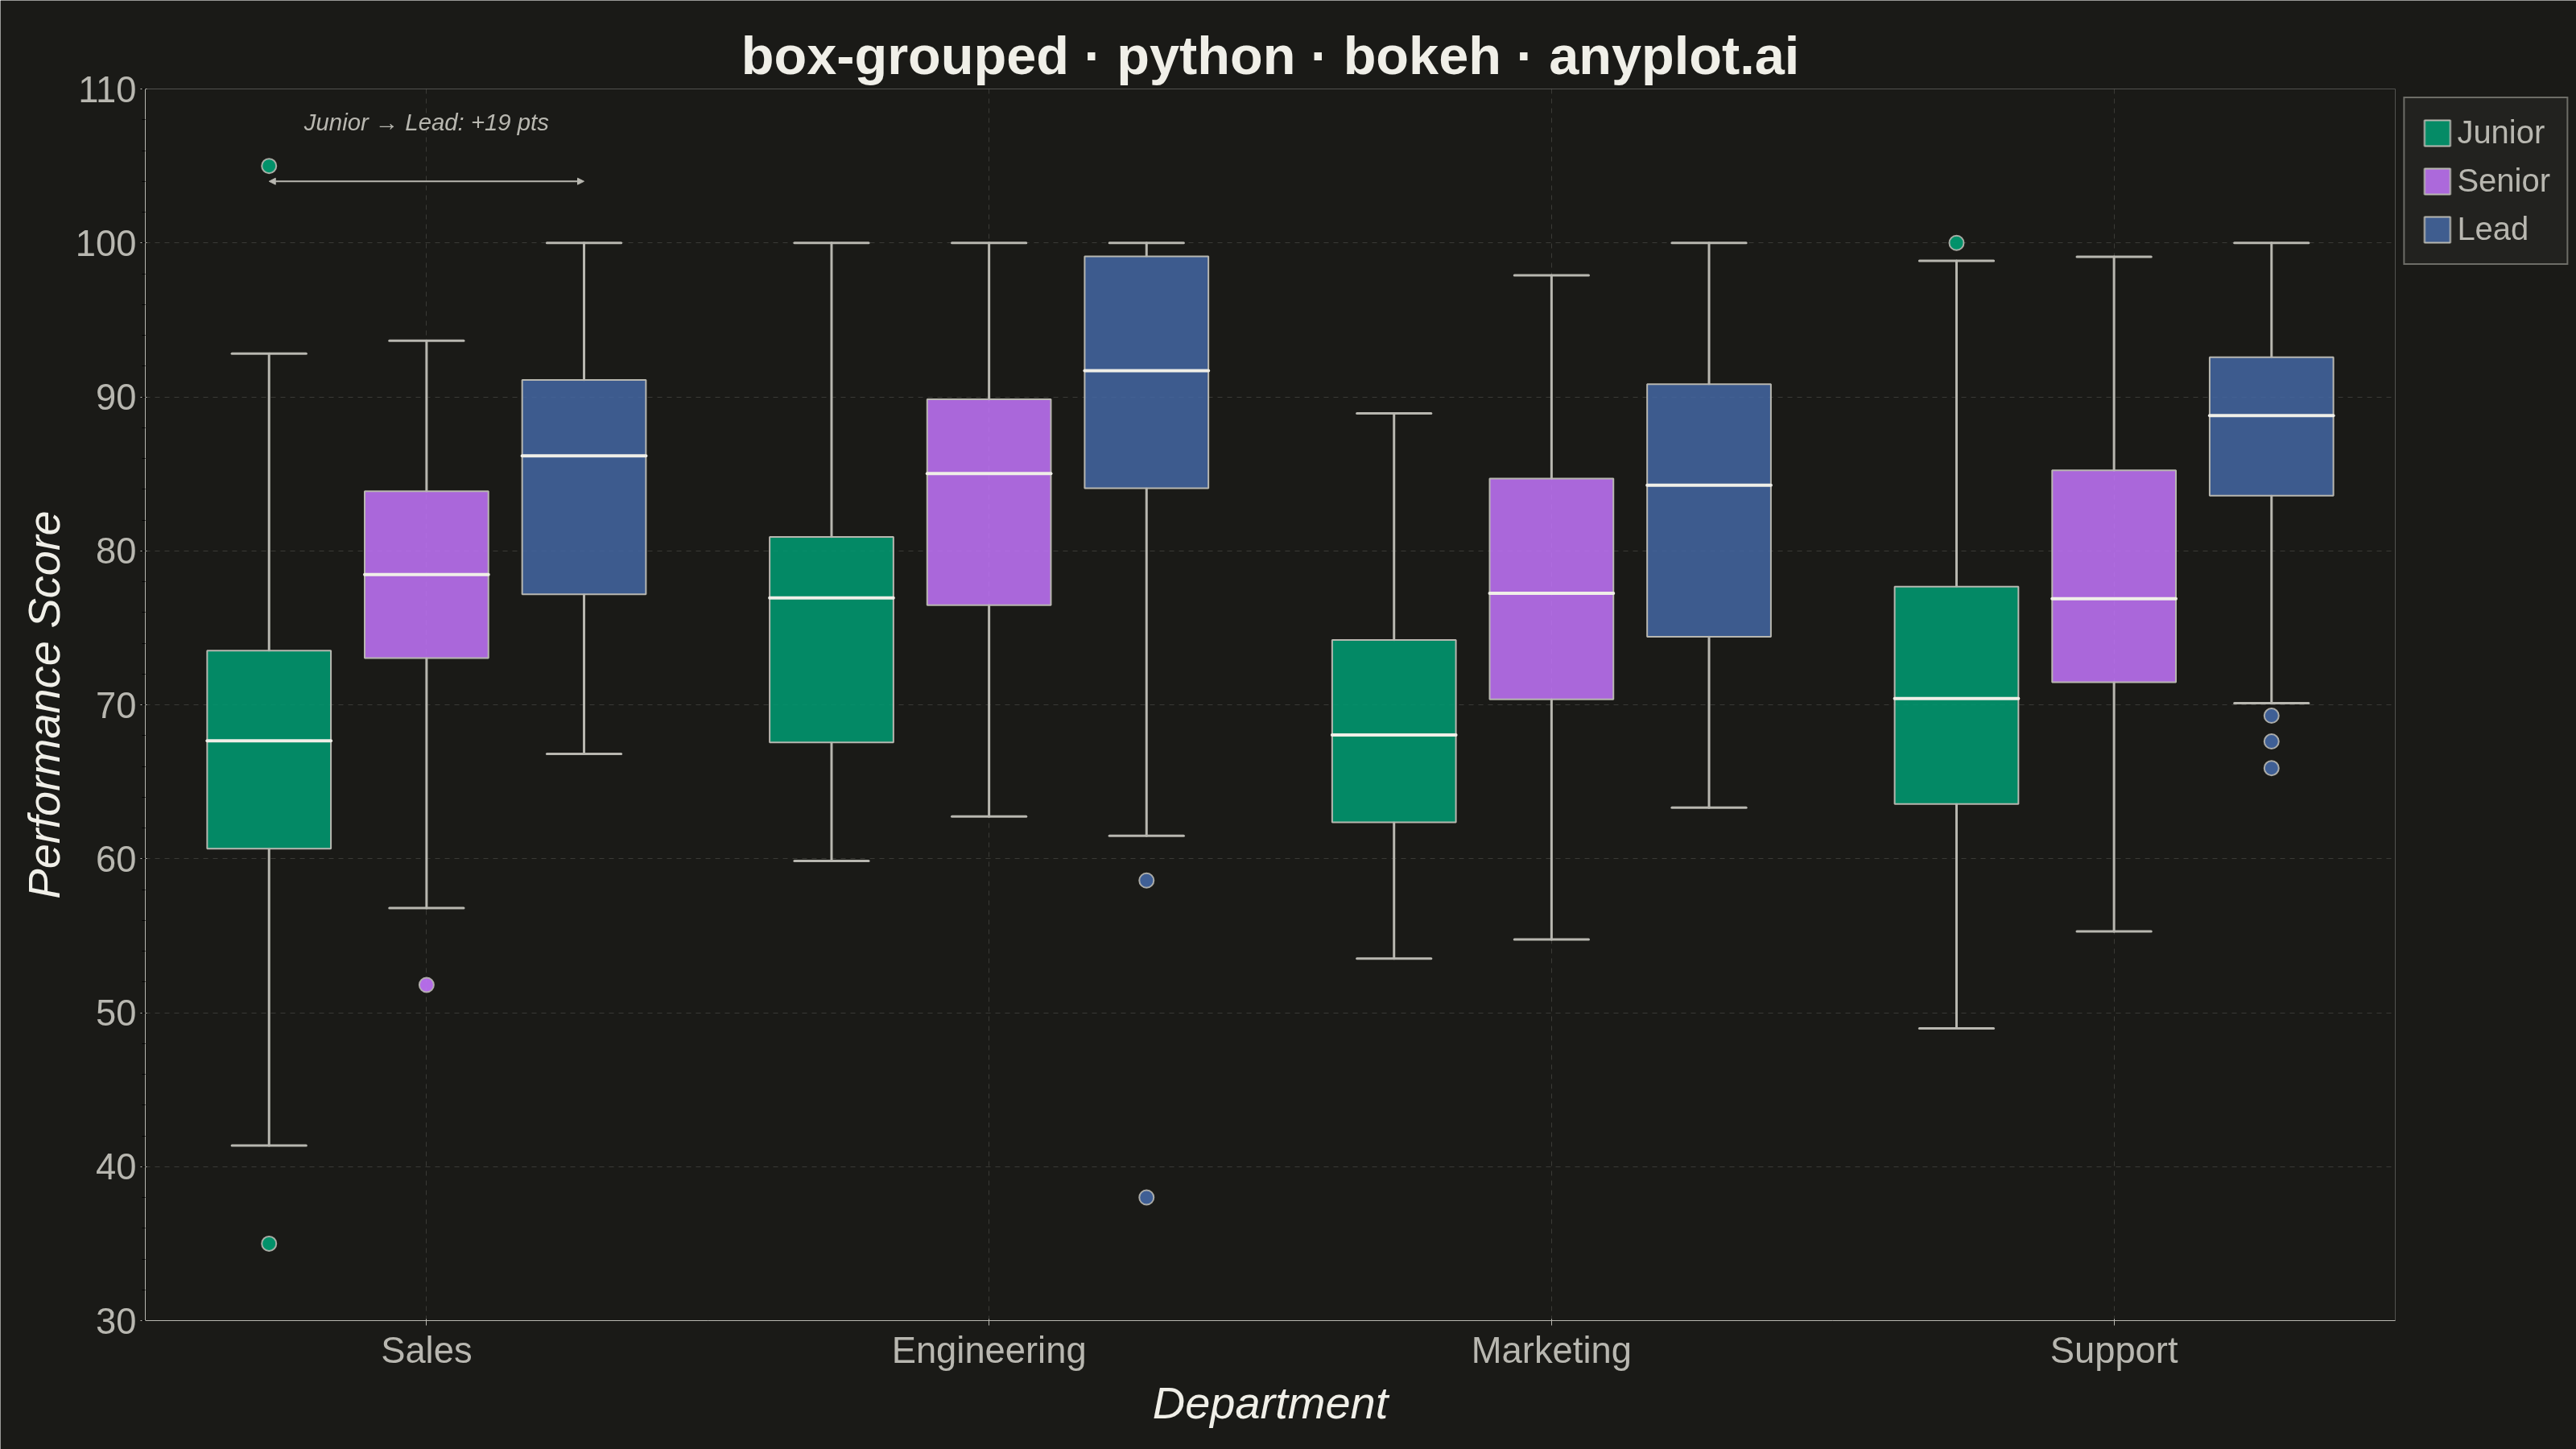
A grouped box plot displays multiple box plots side-by-side within each category, enabling comparison of distributions across subgroups. Each group contains boxes representing different subcategories or conditions, making it ideal for multi-factor comparisons and A/B testing scenarios with multiple metrics.
""" anyplot.ai
box-grouped: Grouped Box Plot
Library: bokeh 3.9.2 | Python 3.13.15
Quality: 91/100 | Updated: 2026-08-18
"""

import os
import time
from pathlib import Path

import numpy as np
from bokeh.io import output_file, save
from bokeh.models import Arrow, ColumnDataSource, FixedTicker, HoverTool, Label, Legend, LegendItem, NormalHead, Range1d
from bokeh.plotting import figure
from selenium import webdriver
from selenium.webdriver.chrome.options import Options


# Theme tokens (see prompts/default-style-guide.md "Theme-adaptive Chrome")
THEME = os.getenv("ANYPLOT_THEME", "light")
PAGE_BG = "#FAF8F1" if THEME == "light" else "#1A1A17"
ELEVATED_BG = "#FFFDF6" if THEME == "light" else "#242420"
INK = "#1A1A17" if THEME == "light" else "#F0EFE8"
INK_SOFT = "#4A4A44" if THEME == "light" else "#B8B7B0"

# Imprint palette — first categorical series is always #009E73
IMPRINT_PALETTE = ["#009E73", "#C475FD", "#4467A3"]

# Data - Employee performance scores across departments by experience level
np.random.seed(42)

categories = ["Sales", "Engineering", "Marketing", "Support"]
subcategories = ["Junior", "Senior", "Lead"]

# Generate performance data with different distributions per group
data = {}
for cat in categories:
    data[cat] = {}
    for i, sub in enumerate(subcategories):
        # Different base means for departments
        base = {"Sales": 70, "Engineering": 75, "Marketing": 68, "Support": 72}[cat]
        # Experience adds to mean
        exp_bonus = i * 8
        # Generate realistic performance scores (50-100 range)
        n_points = 50
        scores = np.random.normal(base + exp_bonus, 10, n_points)
        scores = np.clip(scores, 40, 100)
        # Add some outliers for visual interest
        if cat == "Engineering" and sub == "Lead":
            scores = np.append(scores, [38, 100, 100])  # Add outliers
        if cat == "Sales" and sub == "Junior":
            scores = np.append(scores, [35, 105])  # Add outliers
        data[cat][sub] = scores


# Calculate box plot statistics
def calc_boxplot_stats(values):
    q1 = np.percentile(values, 25)
    q2 = np.percentile(values, 50)  # median
    q3 = np.percentile(values, 75)
    iqr = q3 - q1
    upper_whisker = min(max(values), q3 + 1.5 * iqr)
    lower_whisker = max(min(values), q1 - 1.5 * iqr)
    outliers = values[(values < lower_whisker) | (values > upper_whisker)]
    return {"q1": q1, "q2": q2, "q3": q3, "lower": lower_whisker, "upper": upper_whisker, "outliers": outliers}


# Create figure — width/height are the TOTAL canvas (see prompts/library/bokeh.md "Canvas — hard rule")
p = figure(
    width=3200,
    height=1800,
    # A plain FactorRange's implicit padding isn't wide enough to fit boxes
    # offset from the first/last category (they clip against the frame edge)
    # — use an explicit numeric range with room for the widest box offset.
    x_range=Range1d(start=0.5, end=len(categories) + 0.5),
    y_range=(30, 110),
    title="box-grouped · python · bokeh · anyplot.ai",
    x_axis_label="Department",
    y_axis_label="Performance Score",
    tools="",
    toolbar_location=None,  # bokeh's default toolbar shrinks the saved PNG below the target height
    min_border_bottom=160,
    min_border_left=180,
    min_border_top=110,
    min_border_right=50,
)

# Styling
p.title.text_font_size = "50pt"
p.title.text_color = INK
p.title.align = "center"
p.xaxis.axis_label_text_font_size = "42pt"
p.yaxis.axis_label_text_font_size = "42pt"
p.xaxis.major_label_text_font_size = "34pt"
p.yaxis.major_label_text_font_size = "34pt"
p.xaxis.axis_label_text_color = INK
p.yaxis.axis_label_text_color = INK
p.xaxis.major_label_text_color = INK_SOFT
p.yaxis.major_label_text_color = INK_SOFT
p.xaxis.axis_line_color = INK_SOFT
p.yaxis.axis_line_color = INK_SOFT
p.xaxis.major_tick_line_color = INK_SOFT
p.yaxis.major_tick_line_color = INK_SOFT
p.xgrid.grid_line_color = INK
p.ygrid.grid_line_color = INK
p.xgrid.grid_line_alpha = 0.15
p.ygrid.grid_line_alpha = 0.15
p.xgrid.grid_line_dash = "dashed"
p.ygrid.grid_line_dash = "dashed"
p.background_fill_color = PAGE_BG
p.border_fill_color = PAGE_BG
p.outline_line_color = None  # despine-equivalent: no boxed plot border

# Box dimensions
box_width = 0.22
offsets = [-0.28, 0, 0.28]  # Position offsets for subcategories

# Store renderers for legend and hover tooltips
legend_items = []
box_renderers = []

# Track medians and the highest visible point per category — used below to
# build a data-driven "Junior -> Lead" trend annotation (DE-03).
medians = {sub: {} for sub in subcategories}
max_y_per_cat = dict.fromkeys(categories, -np.inf)

# Draw grouped box plots
for sub_idx, sub in enumerate(subcategories):
    color = IMPRINT_PALETTE[sub_idx]
    offset = offsets[sub_idx]

    # Collect data for this subcategory across all categories
    boxes_lower = []
    boxes_upper = []
    boxes_q1 = []
    boxes_q2 = []
    boxes_q3 = []
    x_positions = []
    all_outliers_x = []
    all_outliers_y = []

    for cat_idx, cat in enumerate(categories):
        stats = calc_boxplot_stats(data[cat][sub])
        # bokeh's FactorRange places factors at synthetic coordinates 1, 2, 3, ...
        # (1-indexed), not 0-indexed — offset from (cat_idx + 1), not cat_idx.
        x_pos = (cat_idx + 1) + offset
        x_positions.append(x_pos)

        boxes_lower.append(stats["lower"])
        boxes_upper.append(stats["upper"])
        boxes_q1.append(stats["q1"])
        boxes_q2.append(stats["q2"])
        boxes_q3.append(stats["q3"])

        medians[sub][cat] = stats["q2"]
        cat_top = max(stats["upper"], *stats["outliers"]) if len(stats["outliers"]) else stats["upper"]
        max_y_per_cat[cat] = max(max_y_per_cat[cat], cat_top)

        # Collect outliers
        for outlier in stats["outliers"]:
            all_outliers_x.append(x_pos)
            all_outliers_y.append(outlier)

    # Draw whisker stems (vertical lines from lower to upper)
    for i, _cat in enumerate(categories):
        x_pos = x_positions[i]
        # Lower whisker
        p.segment(
            x0=[x_pos],
            y0=[boxes_lower[i]],
            x1=[x_pos],
            y1=[boxes_q1[i]],
            line_color=INK_SOFT,
            line_width=3,
            line_cap="round",
        )
        # Upper whisker
        p.segment(
            x0=[x_pos],
            y0=[boxes_q3[i]],
            x1=[x_pos],
            y1=[boxes_upper[i]],
            line_color=INK_SOFT,
            line_width=3,
            line_cap="round",
        )
        # Whisker caps
        cap_width = box_width * 0.6
        p.segment(
            x0=[x_pos - cap_width / 2],
            y0=[boxes_lower[i]],
            x1=[x_pos + cap_width / 2],
            y1=[boxes_lower[i]],
            line_color=INK_SOFT,
            line_width=3,
            line_cap="round",
        )
        p.segment(
            x0=[x_pos - cap_width / 2],
            y0=[boxes_upper[i]],
            x1=[x_pos + cap_width / 2],
            y1=[boxes_upper[i]],
            line_color=INK_SOFT,
            line_width=3,
            line_cap="round",
        )

    # Draw boxes (q1 to q3) — category/subcategory/median are only used by the
    # HoverTool tooltip on the HTML artifact (LM-02); they don't affect the PNG.
    box_source = ColumnDataSource(
        data={
            "x": x_positions,
            "bottom": boxes_q1,
            "top": boxes_q3,
            "category": categories,
            "subcategory": [sub] * len(categories),
            "median": boxes_q2,
        }
    )

    box_renderer = p.vbar(
        x="x",
        width=box_width,
        bottom="bottom",
        top="top",
        source=box_source,
        fill_color=color,
        fill_alpha=0.85,
        line_color=INK_SOFT,
        line_width=2,
    )
    box_renderers.append(box_renderer)

    # Draw median lines
    for i in range(len(categories)):
        p.segment(
            x0=[x_positions[i] - box_width / 2],
            y0=[boxes_q2[i]],
            x1=[x_positions[i] + box_width / 2],
            y1=[boxes_q2[i]],
            line_color=INK,
            line_width=4,
            line_cap="round",
        )

    # Draw outliers
    if all_outliers_x:
        p.scatter(
            x=all_outliers_x,
            y=all_outliers_y,
            size=18,
            color=color,
            alpha=0.9,
            line_color=INK_SOFT,
            line_width=2,
            marker="circle",
        )

    # Store for legend
    legend_items.append(LegendItem(label=sub, renderers=[box_renderer]))

# Add legend
legend = Legend(
    items=legend_items,
    location="top_right",
    label_text_font_size="30pt",
    label_text_color=INK_SOFT,
    glyph_width=40,
    glyph_height=40,
    spacing=15,
    padding=20,
    background_fill_color=ELEVATED_BG,
    background_fill_alpha=0.9,
    border_line_color=INK_SOFT,
    border_line_width=2,
)
p.add_layout(legend, "right")

# Bokeh-distinctive interactivity (LM-02): hover tooltips on the HTML
# artifact — no effect on the static PNG, which is captured without a
# mouse position.
hover = HoverTool(
    renderers=box_renderers,
    tooltips=[
        ("Department", "@category"),
        ("Level", "@subcategory"),
        ("Median", "@median{0.0}"),
        ("Q1 – Q3", "@bottom{0.0} – @top{0.0}"),
    ],
)
p.add_tools(hover)

# Ticks live at the same 1, 2, 3, ... synthetic positions used for x_pos above
p.xaxis.ticker = FixedTicker(ticks=list(range(1, len(categories) + 1)))
p.xaxis.major_label_overrides = {i + 1: cat for i, cat in enumerate(categories)}

# Data storytelling (DE-03): call out the department with the largest
# Junior -> Lead score gap with a connecting arrow + label, derived from the
# medians actually computed above (not hardcoded).
highlight_cat = max(categories, key=lambda cat: medians["Lead"][cat] - medians["Junior"][cat])
highlight_gap = medians["Lead"][highlight_cat] - medians["Junior"][highlight_cat]
highlight_idx = categories.index(highlight_cat) + 1  # 1-indexed synthetic x position
x_junior = highlight_idx + offsets[0]
x_lead = highlight_idx + offsets[-1]
annotation_y = min(104, max_y_per_cat[highlight_cat] + 6)

p.add_layout(
    Arrow(
        x_start=x_junior,
        y_start=annotation_y,
        x_end=x_lead,
        y_end=annotation_y,
        start=NormalHead(size=8, fill_color=INK_SOFT, line_color=INK_SOFT),
        end=NormalHead(size=8, fill_color=INK_SOFT, line_color=INK_SOFT),
        line_color=INK_SOFT,
        line_width=2,
    )
)
p.add_layout(
    Label(
        x=(x_junior + x_lead) / 2,
        y=annotation_y + 3,
        text=f"Junior → Lead: +{highlight_gap:.0f} pts",
        text_font_size="22pt",
        text_font_style="italic",
        text_color=INK_SOFT,
        text_align="center",
        text_baseline="bottom",
    )
)

# Save the interactive HTML (also a required catalog artifact)
output_file(f"plot-{THEME}.html", title="box-grouped · python · bokeh · anyplot.ai")
save(p)

# Screenshot it with headless Chrome — bokeh.export_png() is unreliable on this
# box (chromedriver snap shim), so render + screenshot the saved HTML instead,
# matching the pattern in prompts/library/bokeh.md.
W, H = 3200, 1800
opts = Options()
for arg in (
    "--headless=new",
    "--no-sandbox",
    "--disable-dev-shm-usage",
    "--disable-gpu",
    f"--window-size={W},{H}",
    "--hide-scrollbars",
):
    opts.add_argument(arg)
driver = webdriver.Chrome(options=opts)
driver.set_window_size(W, H)
driver.get(f"file://{Path(f'plot-{THEME}.html').resolve()}")
# Headless Chrome's --window-size sets the OUTER window; pin the viewport exactly via CDP.
driver.execute_cdp_cmd(
    "Emulation.setDeviceMetricsOverride", {"width": W, "height": H, "deviceScaleFactor": 1, "mobile": False}
)
time.sleep(3)  # let bokeh's JS render the canvas
driver.save_screenshot(f"plot-{THEME}.png")
driver.quit()
Runnable source as JSON, for any HTTP client: https://api.anyplot.ai/specs/box-grouped/bokeh/code. Any spec id and library id listed in llms-full.txt fit the same URL shape; every URL below is complete and callable.
{
  "spec_id": "box-grouped",
  "language": "python",
  "library": "bokeh",
  "page": "https://anyplot.ai/box-grouped/python/bokeh",
  "hub": "https://anyplot.ai/box-grouped",
  "code_json": "https://api.anyplot.ai/specs/box-grouped/bokeh/code",
  "spec_json": "https://api.anyplot.ai/specs/box-grouped",
  "render_light_png": "https://storage.googleapis.com/anyplot-images/plots/box-grouped/python/bokeh/plot-light.png",
  "render_dark_png": "https://storage.googleapis.com/anyplot-images/plots/box-grouped/python/bokeh/plot-dark.png",
  "interactive_light_html": "https://storage.googleapis.com/anyplot-images/plots/box-grouped/python/bokeh/plot-light.html",
  "interactive_dark_html": "https://storage.googleapis.com/anyplot-images/plots/box-grouped/python/bokeh/plot-dark.html",
  "quality_score": 91.0,
  "license": "MIT",
  "guide": "https://anyplot.ai/llms.txt"
}
Part of Grouped Box Plot on anyplot.ai.