The same plot in 14 other libraries — JavaScript: D3.js, Apache ECharts, Highcharts, MUI X Charts; Python: Altair, Bokeh, lets-plot, Matplotlib, Plotly, plotnine, Pygal, Seaborn; R: ggplot2; Julia: Makie.jl. Compare all 15 side by side: Bubble Map with Sized Geographic Markers in Python, R, Julia and JavaScript.
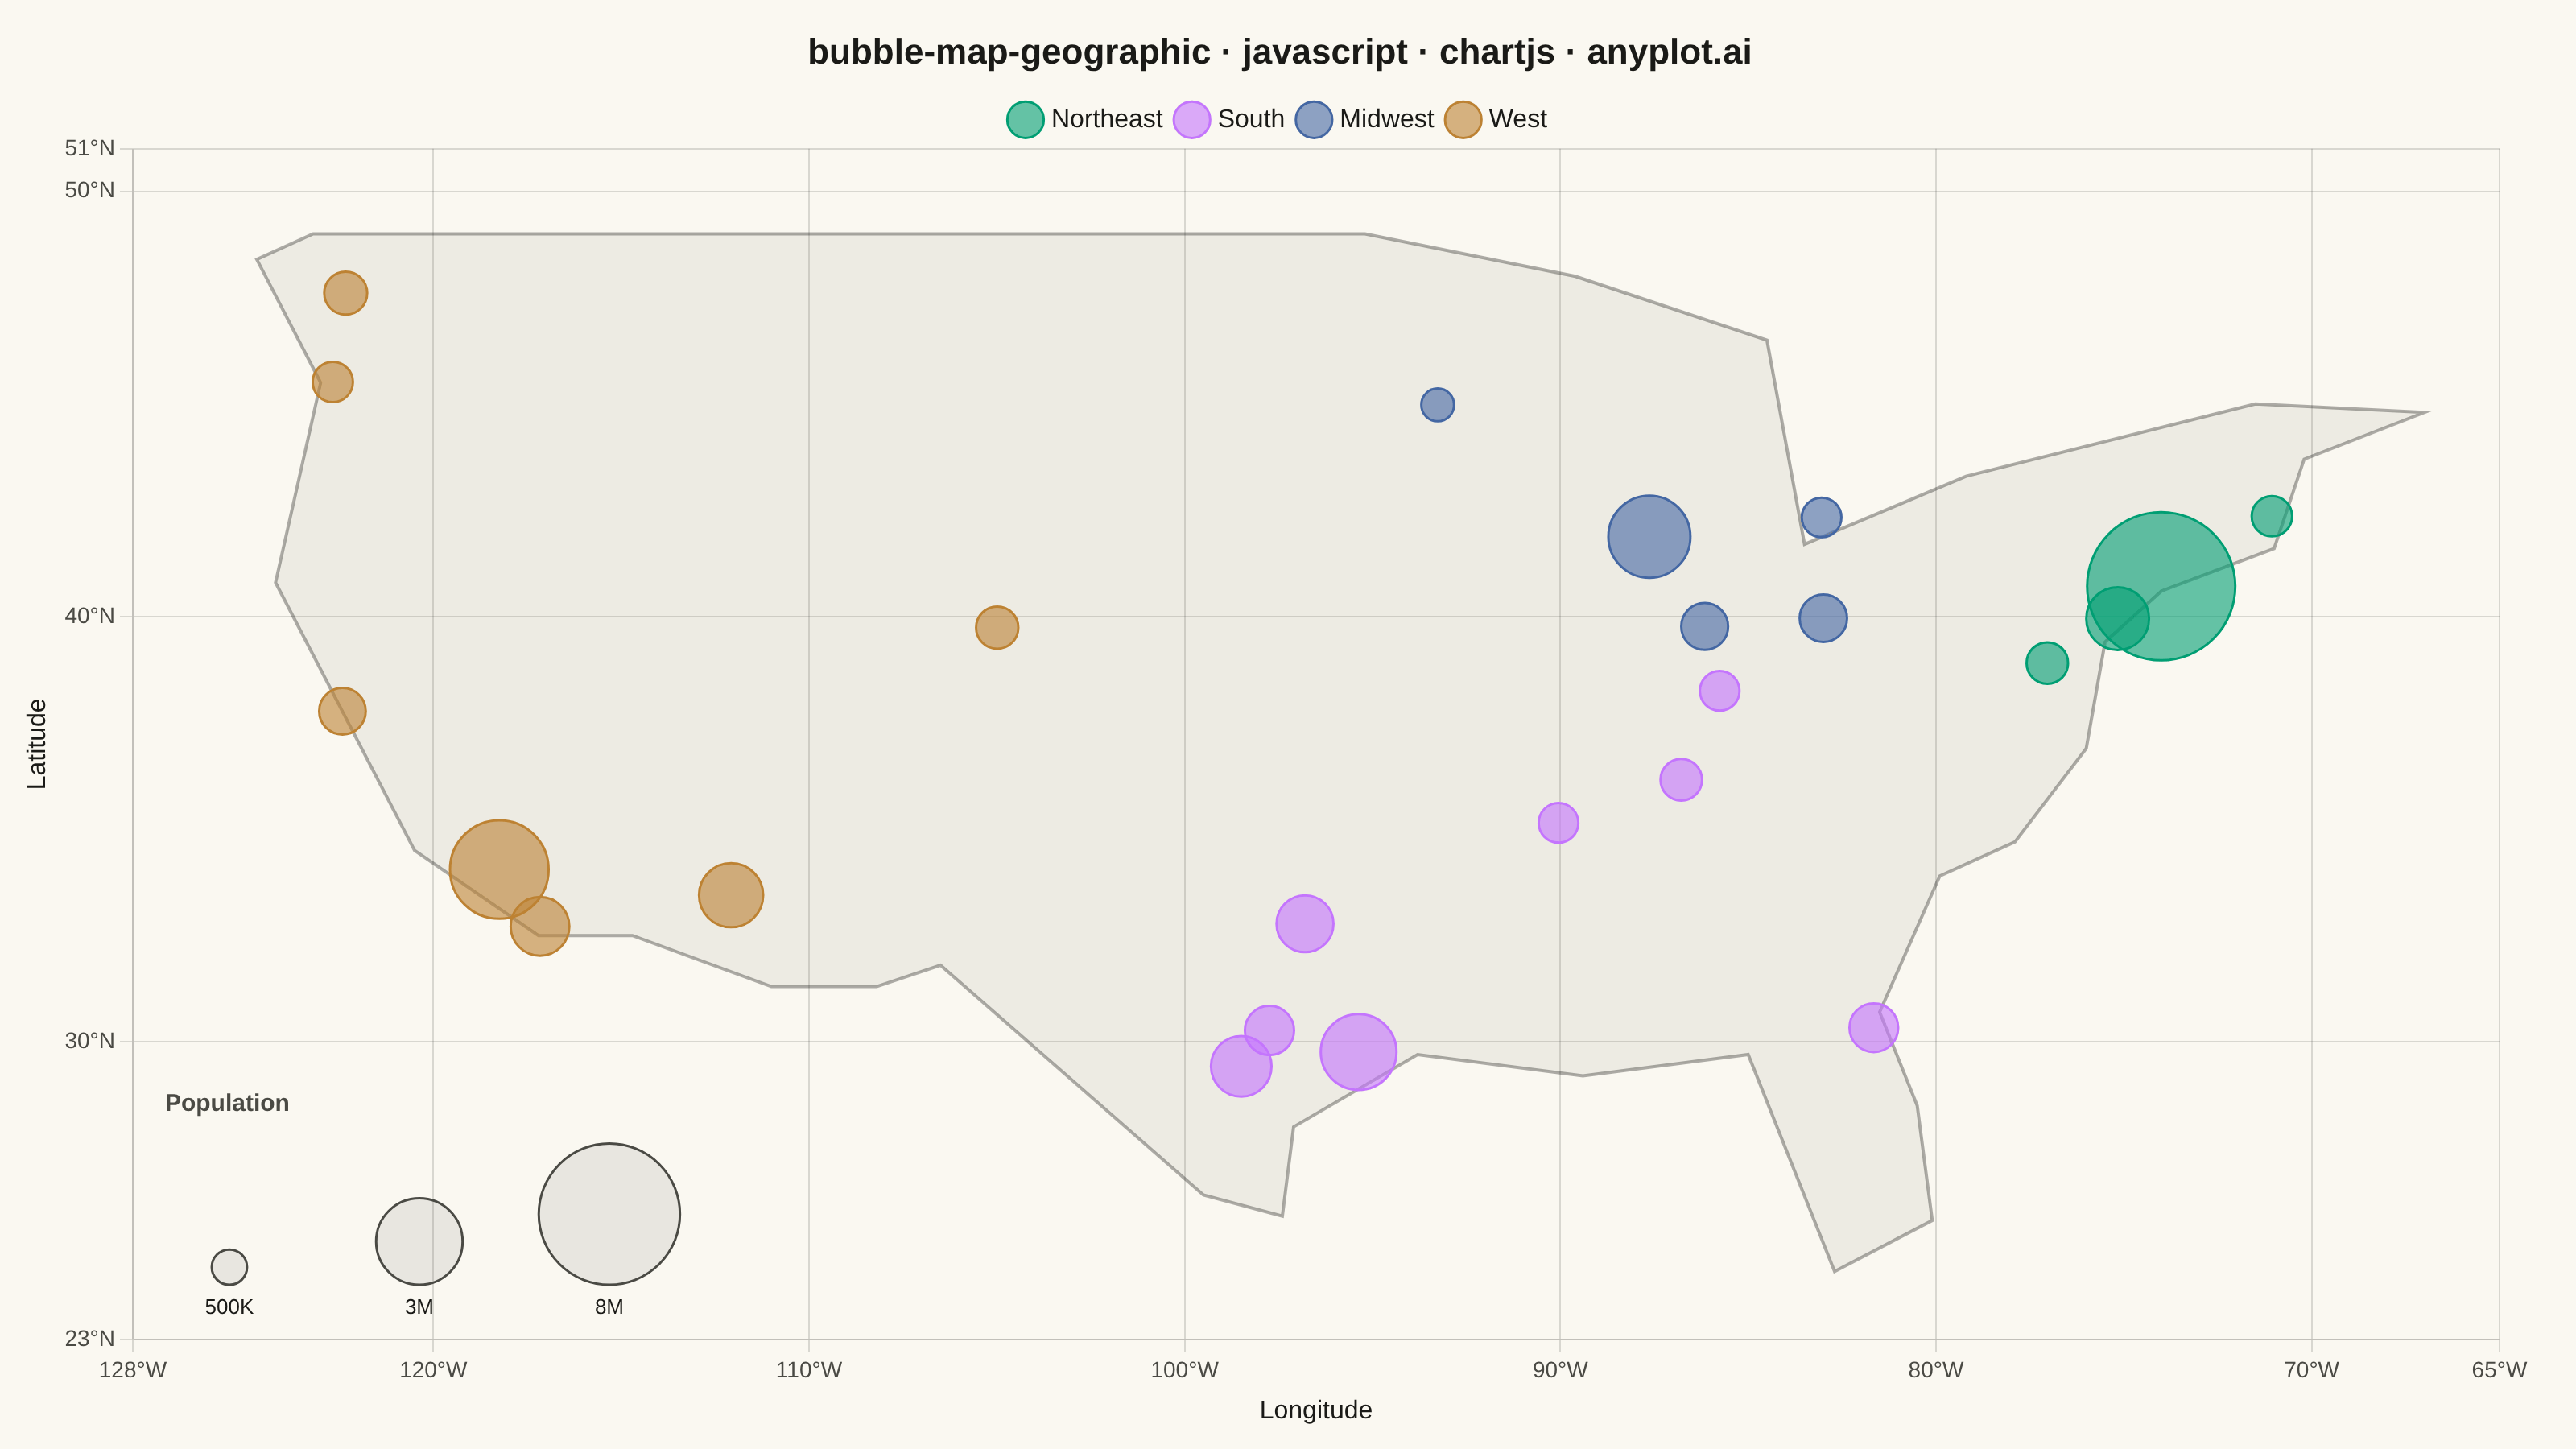
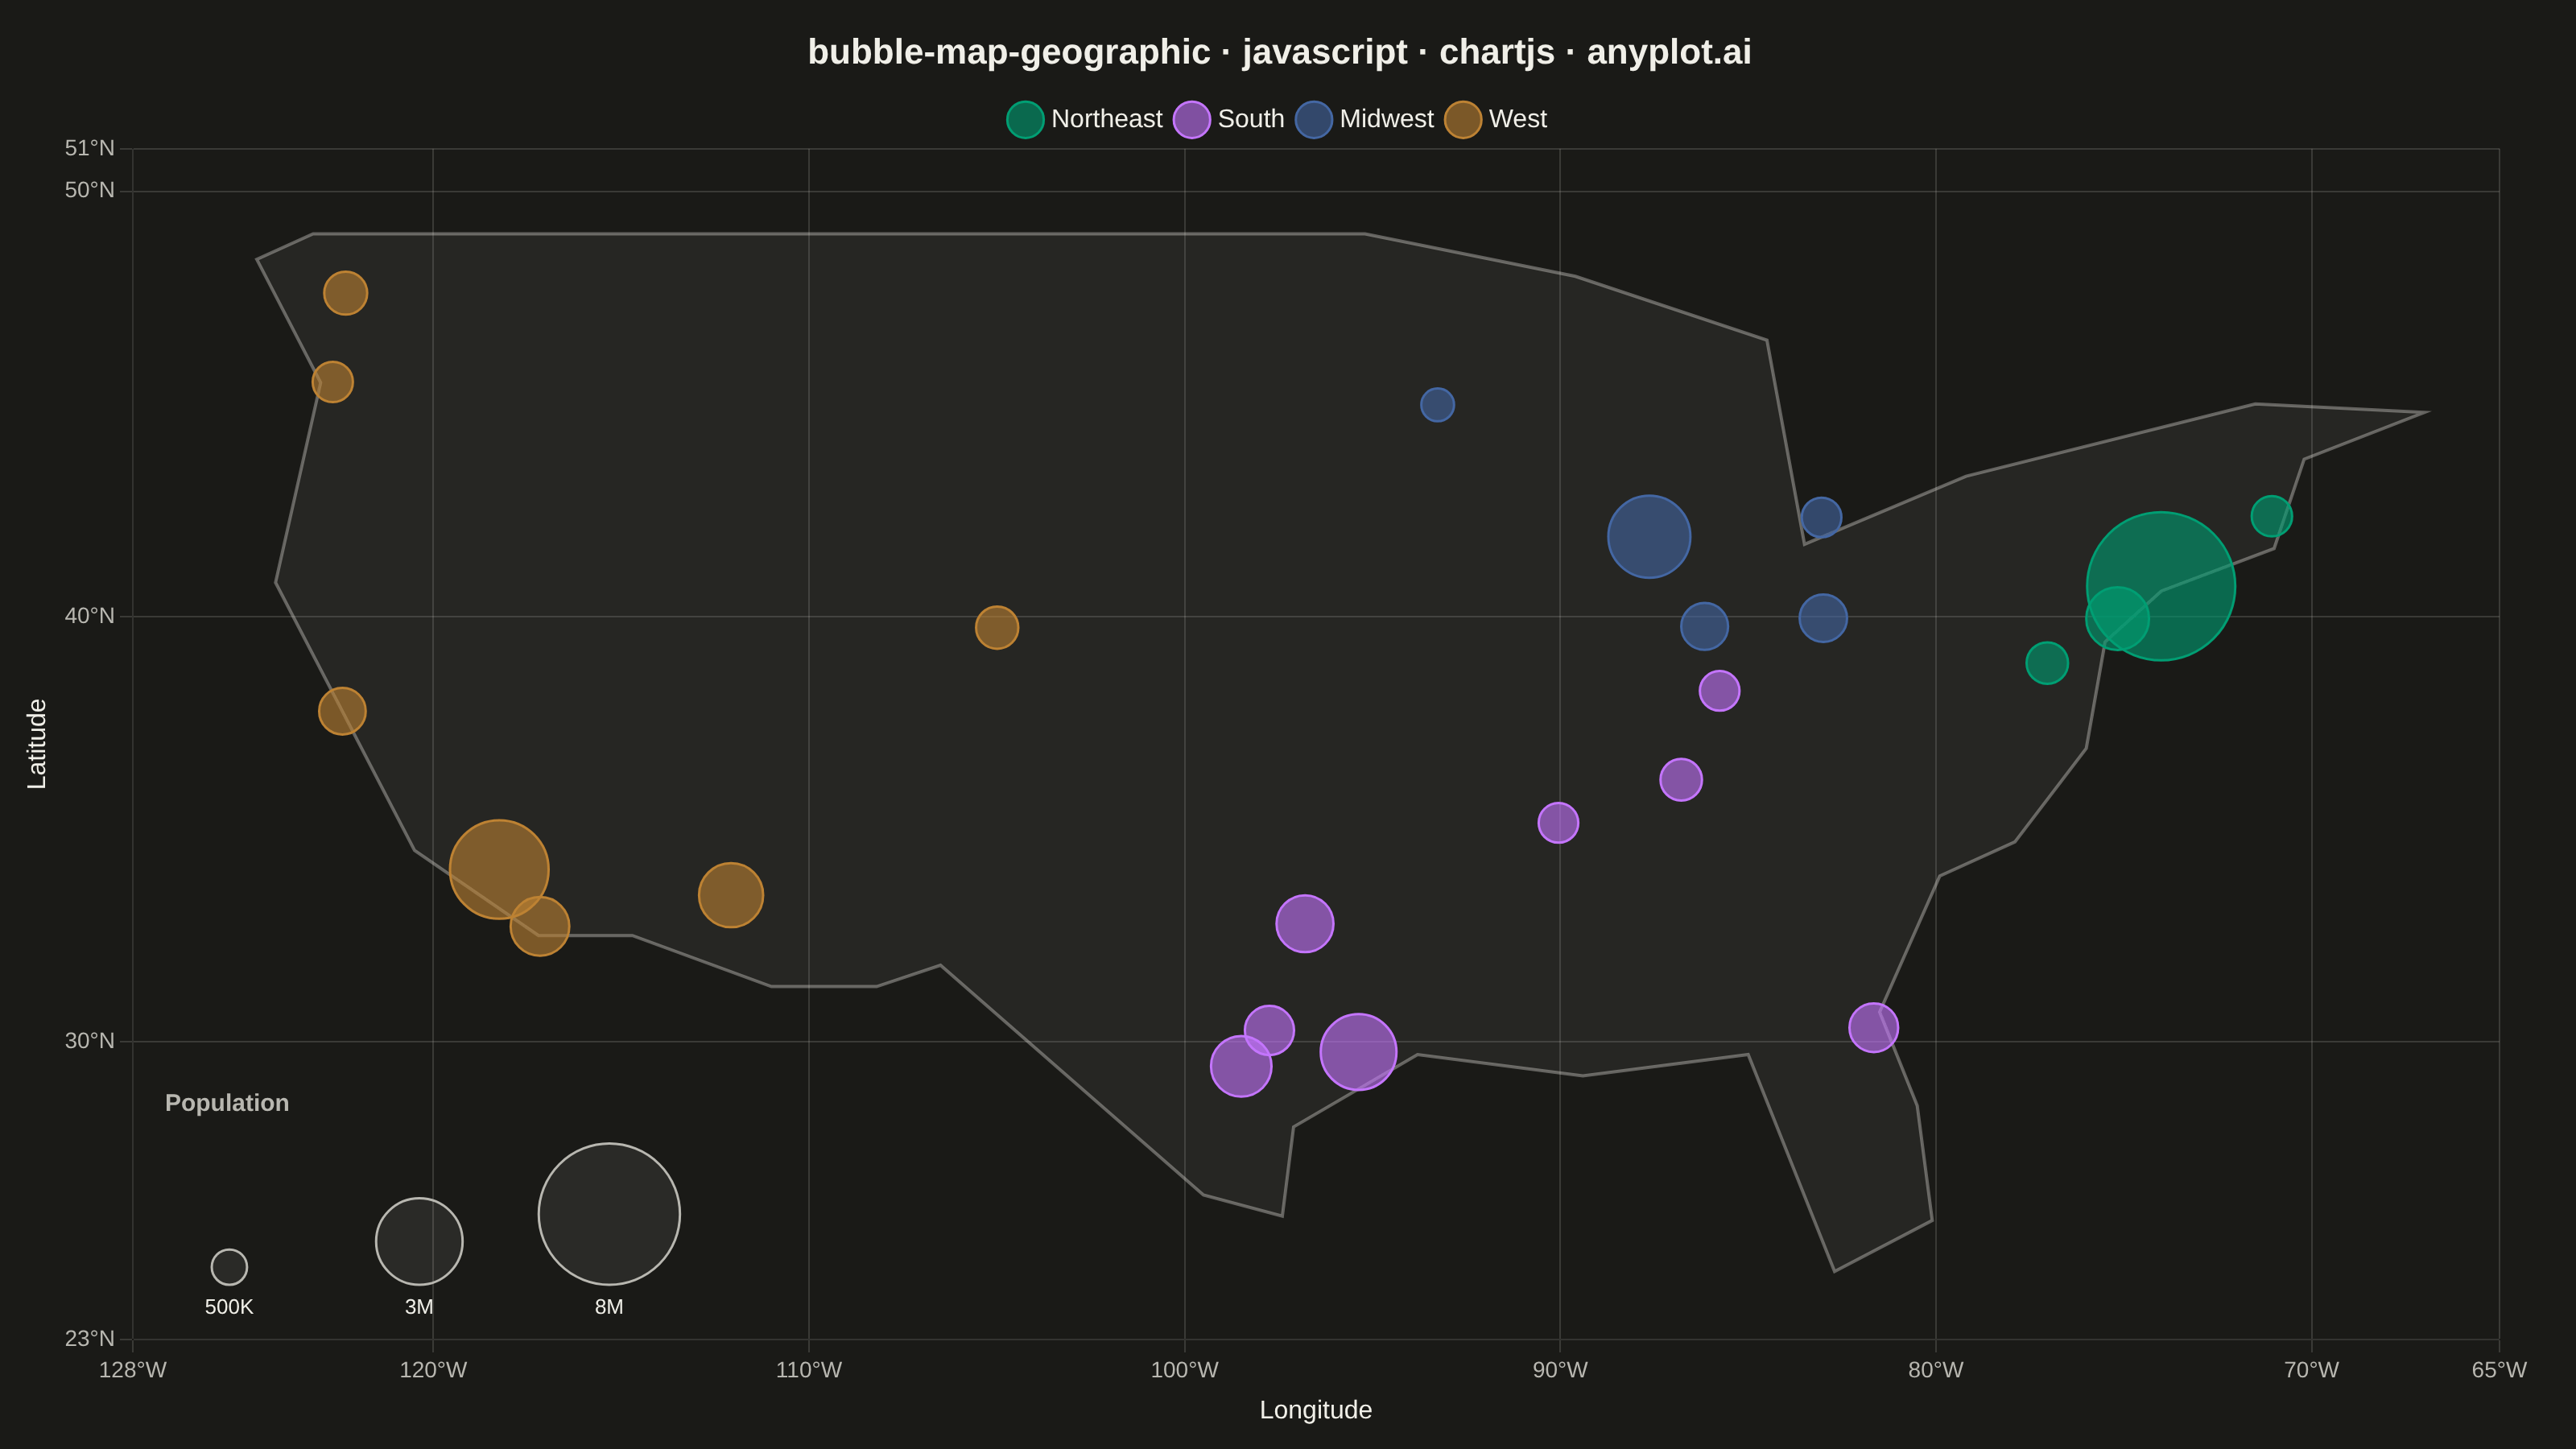
A geographic bubble map where markers are sized proportionally to quantitative data values at each location. Unlike scatter maps where size is optional, bubble maps use marker size as the primary visual encoding to show data magnitude across geographic regions. This visualization makes it immediately apparent where high and low values occur spatially, enabling intuitive comparison of quantities across locations.
// anyplot.ai
// bubble-map-geographic: Bubble Map with Sized Geographic Markers
// Library: chartjs 4.4.7 | JavaScript 22.23.2
// Quality: 93/100 | Created: 2026-09-01

const t = window.ANYPLOT_TOKENS;

// --- Data (in-memory, deterministic) — major US cities by population -------
const CITIES = [
  { label: "New York",      lon: -74.006,   lat: 40.7128, pop: 8_800_000, region: "Northeast" },
  { label: "Los Angeles",   lon: -118.2437, lat: 34.0522, pop: 3_900_000, region: "West" },
  { label: "Chicago",       lon: -87.6298,  lat: 41.8781, pop: 2_700_000, region: "Midwest" },
  { label: "Houston",       lon: -95.3698,  lat: 29.7604, pop: 2_300_000, region: "South" },
  { label: "Phoenix",       lon: -112.074,  lat: 33.4484, pop: 1_650_000, region: "West" },
  { label: "Philadelphia",  lon: -75.1652,  lat: 39.9526, pop: 1_580_000, region: "Northeast" },
  { label: "San Antonio",   lon: -98.4936,  lat: 29.4241, pop: 1_470_000, region: "South" },
  { label: "San Diego",     lon: -117.1611, lat: 32.7157, pop: 1_380_000, region: "West" },
  { label: "Dallas",        lon: -96.797,   lat: 32.7767, pop: 1_300_000, region: "South" },
  { label: "Austin",        lon: -97.7431,  lat: 30.2672, pop: 970_000,   region: "South" },
  { label: "Jacksonville",  lon: -81.6557,  lat: 30.3322, pop: 950_000,   region: "South" },
  { label: "San Francisco", lon: -122.4194, lat: 37.7749, pop: 870_000,   region: "West" },
  { label: "Columbus",      lon: -82.9988,  lat: 39.9612, pop: 900_000,   region: "Midwest" },
  { label: "Indianapolis",  lon: -86.1581,  lat: 39.7684, pop: 880_000,   region: "Midwest" },
  { label: "Seattle",       lon: -122.3321, lat: 47.6062, pop: 740_000,   region: "West" },
  { label: "Denver",        lon: -104.9903, lat: 39.7392, pop: 715_000,   region: "West" },
  { label: "Washington DC", lon: -77.0369,  lat: 38.9072, pop: 690_000,   region: "Northeast" },
  { label: "Boston",        lon: -71.0589,  lat: 42.3601, pop: 655_000,   region: "Northeast" },
  { label: "Nashville",     lon: -86.7816,  lat: 36.1627, pop: 690_000,   region: "South" },
  { label: "Detroit",       lon: -83.0458,  lat: 42.3314, pop: 630_000,   region: "Midwest" },
  { label: "Portland",      lon: -122.6765, lat: 45.5152, pop: 650_000,   region: "West" },
  { label: "Memphis",       lon: -90.049,   lat: 35.1495, pop: 630_000,   region: "South" },
  { label: "Louisville",    lon: -85.7585,  lat: 38.2527, pop: 630_000,   region: "South" },
  { label: "Minneapolis",   lon: -93.265,   lat: 44.9778, pop: 430_000,   region: "Midwest" },
];

const REGIONS = ["Northeast", "South", "Midwest", "West"];

// Simplified continental-US outline for basemap context (rough, not to scale)
const US_OUTLINE = [
  [-124.7, 48.4], [-123.0, 45.5], [-124.2, 40.8], [-120.5, 34.5],
  [-117.2, 32.5], [-114.7, 32.5], [-111.0, 31.3], [-108.2, 31.3],
  [-106.5, 31.8], [-99.5, 26.4], [-97.4, 25.9], [-97.1, 28.0],
  [-93.8, 29.7], [-89.4, 29.2], [-85.0, 29.7], [-82.7, 24.6],
  [-80.1, 25.8], [-80.5, 28.5], [-81.5, 30.7], [-79.9, 33.9],
  [-77.9, 34.7], [-76.0, 36.9], [-75.5, 39.4], [-74.0, 40.6],
  [-71.0, 41.6], [-70.2, 43.7], [-67.0, 44.8], [-71.5, 45.0],
  [-79.2, 43.3], [-83.5, 41.7], [-84.5, 46.5], [-89.6, 48.0],
  [-95.2, 49.0], [-104.0, 49.0], [-116.0, 49.0], [-123.2, 49.0],
];

// --- Bubble area sizing (area, not radius, proportional to population) -----
const MIN_R = 8;
const MAX_R = 46;
const MAX_POP = Math.max(...CITIES.map((c) => c.pop));
const K = MAX_R / Math.sqrt(MAX_POP);
const radiusForPop = (pop) => Math.max(MIN_R, K * Math.sqrt(pop));

function hexToRgba(hex, alpha) {
  const r = parseInt(hex.slice(1, 3), 16);
  const g = parseInt(hex.slice(3, 5), 16);
  const b = parseInt(hex.slice(5, 7), 16);
  return `rgba(${r}, ${g}, ${b}, ${alpha})`;
}

const regionColor = (region) => t.palette[REGIONS.indexOf(region)];

const datasets = REGIONS.map((region) => ({
  label: region,
  data: CITIES.filter((c) => c.region === region).map((c) => ({
    x: c.lon,
    y: c.lat,
    r: radiusForPop(c.pop),
    label: c.label,
    pop: c.pop,
  })),
  backgroundColor: hexToRgba(regionColor(region), 0.6),
  borderColor: regionColor(region),
  borderWidth: 1.5,
  hoverBorderWidth: 2,
}));

// --- Basemap plugin: simplified US landmass tint behind the bubbles --------
const basemapPlugin = {
  id: "basemap",
  beforeDatasetsDraw(chart) {
    const { ctx, scales: { x, y } } = chart;
    ctx.save();
    ctx.beginPath();
    US_OUTLINE.forEach(([lon, lat], i) => {
      const px = x.getPixelForValue(lon);
      const py = y.getPixelForValue(lat);
      if (i === 0) ctx.moveTo(px, py);
      else ctx.lineTo(px, py);
    });
    ctx.closePath();
    ctx.fillStyle = hexToRgba(t.ink, 0.06);
    ctx.fill();
    ctx.strokeStyle = hexToRgba(t.ink, 0.35);
    ctx.lineWidth = 2;
    ctx.stroke();
    ctx.restore();
  },
};

// --- Size-legend plugin: reference circles showing the value-to-area scale -
const sizeLegendPlugin = {
  id: "sizeLegend",
  afterDraw(chart) {
    const { ctx, chartArea } = chart;
    const refPops = [500_000, 3_000_000, 8_000_000];
    const refLabels = ["500K", "3M", "8M"];
    const baseline = chartArea.bottom - 34;
    let cx = chartArea.left + 60;

    ctx.save();
    ctx.font = "600 15px sans-serif";
    ctx.fillStyle = t.inkSoft;
    ctx.textAlign = "left";
    ctx.textBaseline = "alphabetic";
    ctx.fillText("Population", chartArea.left + 20, baseline - 2 * MAX_R - 16);

    refPops.forEach((pop, i) => {
      const r = radiusForPop(pop);
      const cy = baseline - r;
      ctx.beginPath();
      ctx.arc(cx, cy, r, 0, Math.PI * 2);
      ctx.fillStyle = hexToRgba(t.ink, 0.08);
      ctx.fill();
      ctx.strokeStyle = t.inkSoft;
      ctx.lineWidth = 1.5;
      ctx.stroke();

      ctx.fillStyle = t.ink;
      ctx.font = "13px sans-serif";
      ctx.textAlign = "center";
      ctx.fillText(refLabels[i], cx, baseline + 18);

      cx += 2 * MAX_R + 26;
    });
    ctx.restore();
  },
};

// --- Mount -------------------------------------------------------------
const canvas = document.createElement("canvas");
document.getElementById("container").appendChild(canvas);

// --- Chart ---------------------------------------------------------------
new Chart(canvas, {
  type: "bubble",
  data: { datasets },
  plugins: [basemapPlugin, sizeLegendPlugin],
  options: {
    responsive: true,
    maintainAspectRatio: false,
    animation: false,
    layout: { padding: { top: 10, right: 20, bottom: 10, left: 10 } },
    plugins: {
      title: {
        display: true,
        text: "bubble-map-geographic · javascript · chartjs · anyplot.ai",
        color: t.ink,
        font: { size: 22 },
      },
      legend: {
        position: "top",
        labels: {
          color: t.ink,
          font: { size: 16 },
          usePointStyle: true,
          pointStyle: "circle",
        },
      },
      tooltip: {
        callbacks: {
          label: (ctx) => {
            const p = ctx.raw;
            return `${p.label}: ${p.pop.toLocaleString()} (${p.x.toFixed(1)}°, ${p.y.toFixed(1)}°)`;
          },
        },
      },
    },
    scales: {
      x: {
        type: "linear",
        min: -128,
        max: -65,
        ticks: {
          color: t.inkSoft,
          font: { size: 14 },
          stepSize: 10,
          callback: (v) => `${Math.abs(v)}°W`,
        },
        grid: { color: t.grid },
        title: { display: true, text: "Longitude", color: t.ink, font: { size: 16 } },
      },
      y: {
        type: "linear",
        min: 23,
        max: 51,
        ticks: {
          color: t.inkSoft,
          font: { size: 14 },
          stepSize: 10,
          callback: (v) => `${v}°N`,
        },
        grid: { color: t.grid },
        title: { display: true, text: "Latitude", color: t.ink, font: { size: 16 } },
      },
    },
  },
});
Runnable source as JSON, for any HTTP client: https://api.anyplot.ai/specs/bubble-map-geographic/chartjs/code. Any spec id and library id listed in llms-full.txt fit the same URL shape; every URL below is complete and callable.
{
  "spec_id": "bubble-map-geographic",
  "language": "javascript",
  "library": "chartjs",
  "page": "https://anyplot.ai/bubble-map-geographic/javascript/chartjs",
  "hub": "https://anyplot.ai/bubble-map-geographic",
  "code_json": "https://api.anyplot.ai/specs/bubble-map-geographic/chartjs/code",
  "spec_json": "https://api.anyplot.ai/specs/bubble-map-geographic",
  "render_light_png": "https://storage.googleapis.com/anyplot-images/plots/bubble-map-geographic/javascript/chartjs/plot-light.png",
  "render_dark_png": "https://storage.googleapis.com/anyplot-images/plots/bubble-map-geographic/javascript/chartjs/plot-dark.png",
  "interactive_light_html": "https://storage.googleapis.com/anyplot-images/plots/bubble-map-geographic/javascript/chartjs/plot-light.html",
  "interactive_dark_html": "https://storage.googleapis.com/anyplot-images/plots/bubble-map-geographic/javascript/chartjs/plot-dark.html",
  "quality_score": 93.0,
  "license": "MIT",
  "guide": "https://anyplot.ai/llms.txt"
}
Part of Bubble Map with Sized Geographic Markers on anyplot.ai.