The same plot in 14 other libraries — JavaScript: Chart.js, D3.js, Apache ECharts, MUI X Charts; Python: Altair, Bokeh, lets-plot, Matplotlib, Plotly, plotnine, Pygal, Seaborn; R: ggplot2; Julia: Makie.jl. Compare all 15 side by side: Bubble Map with Sized Geographic Markers in Python, R, Julia and JavaScript.
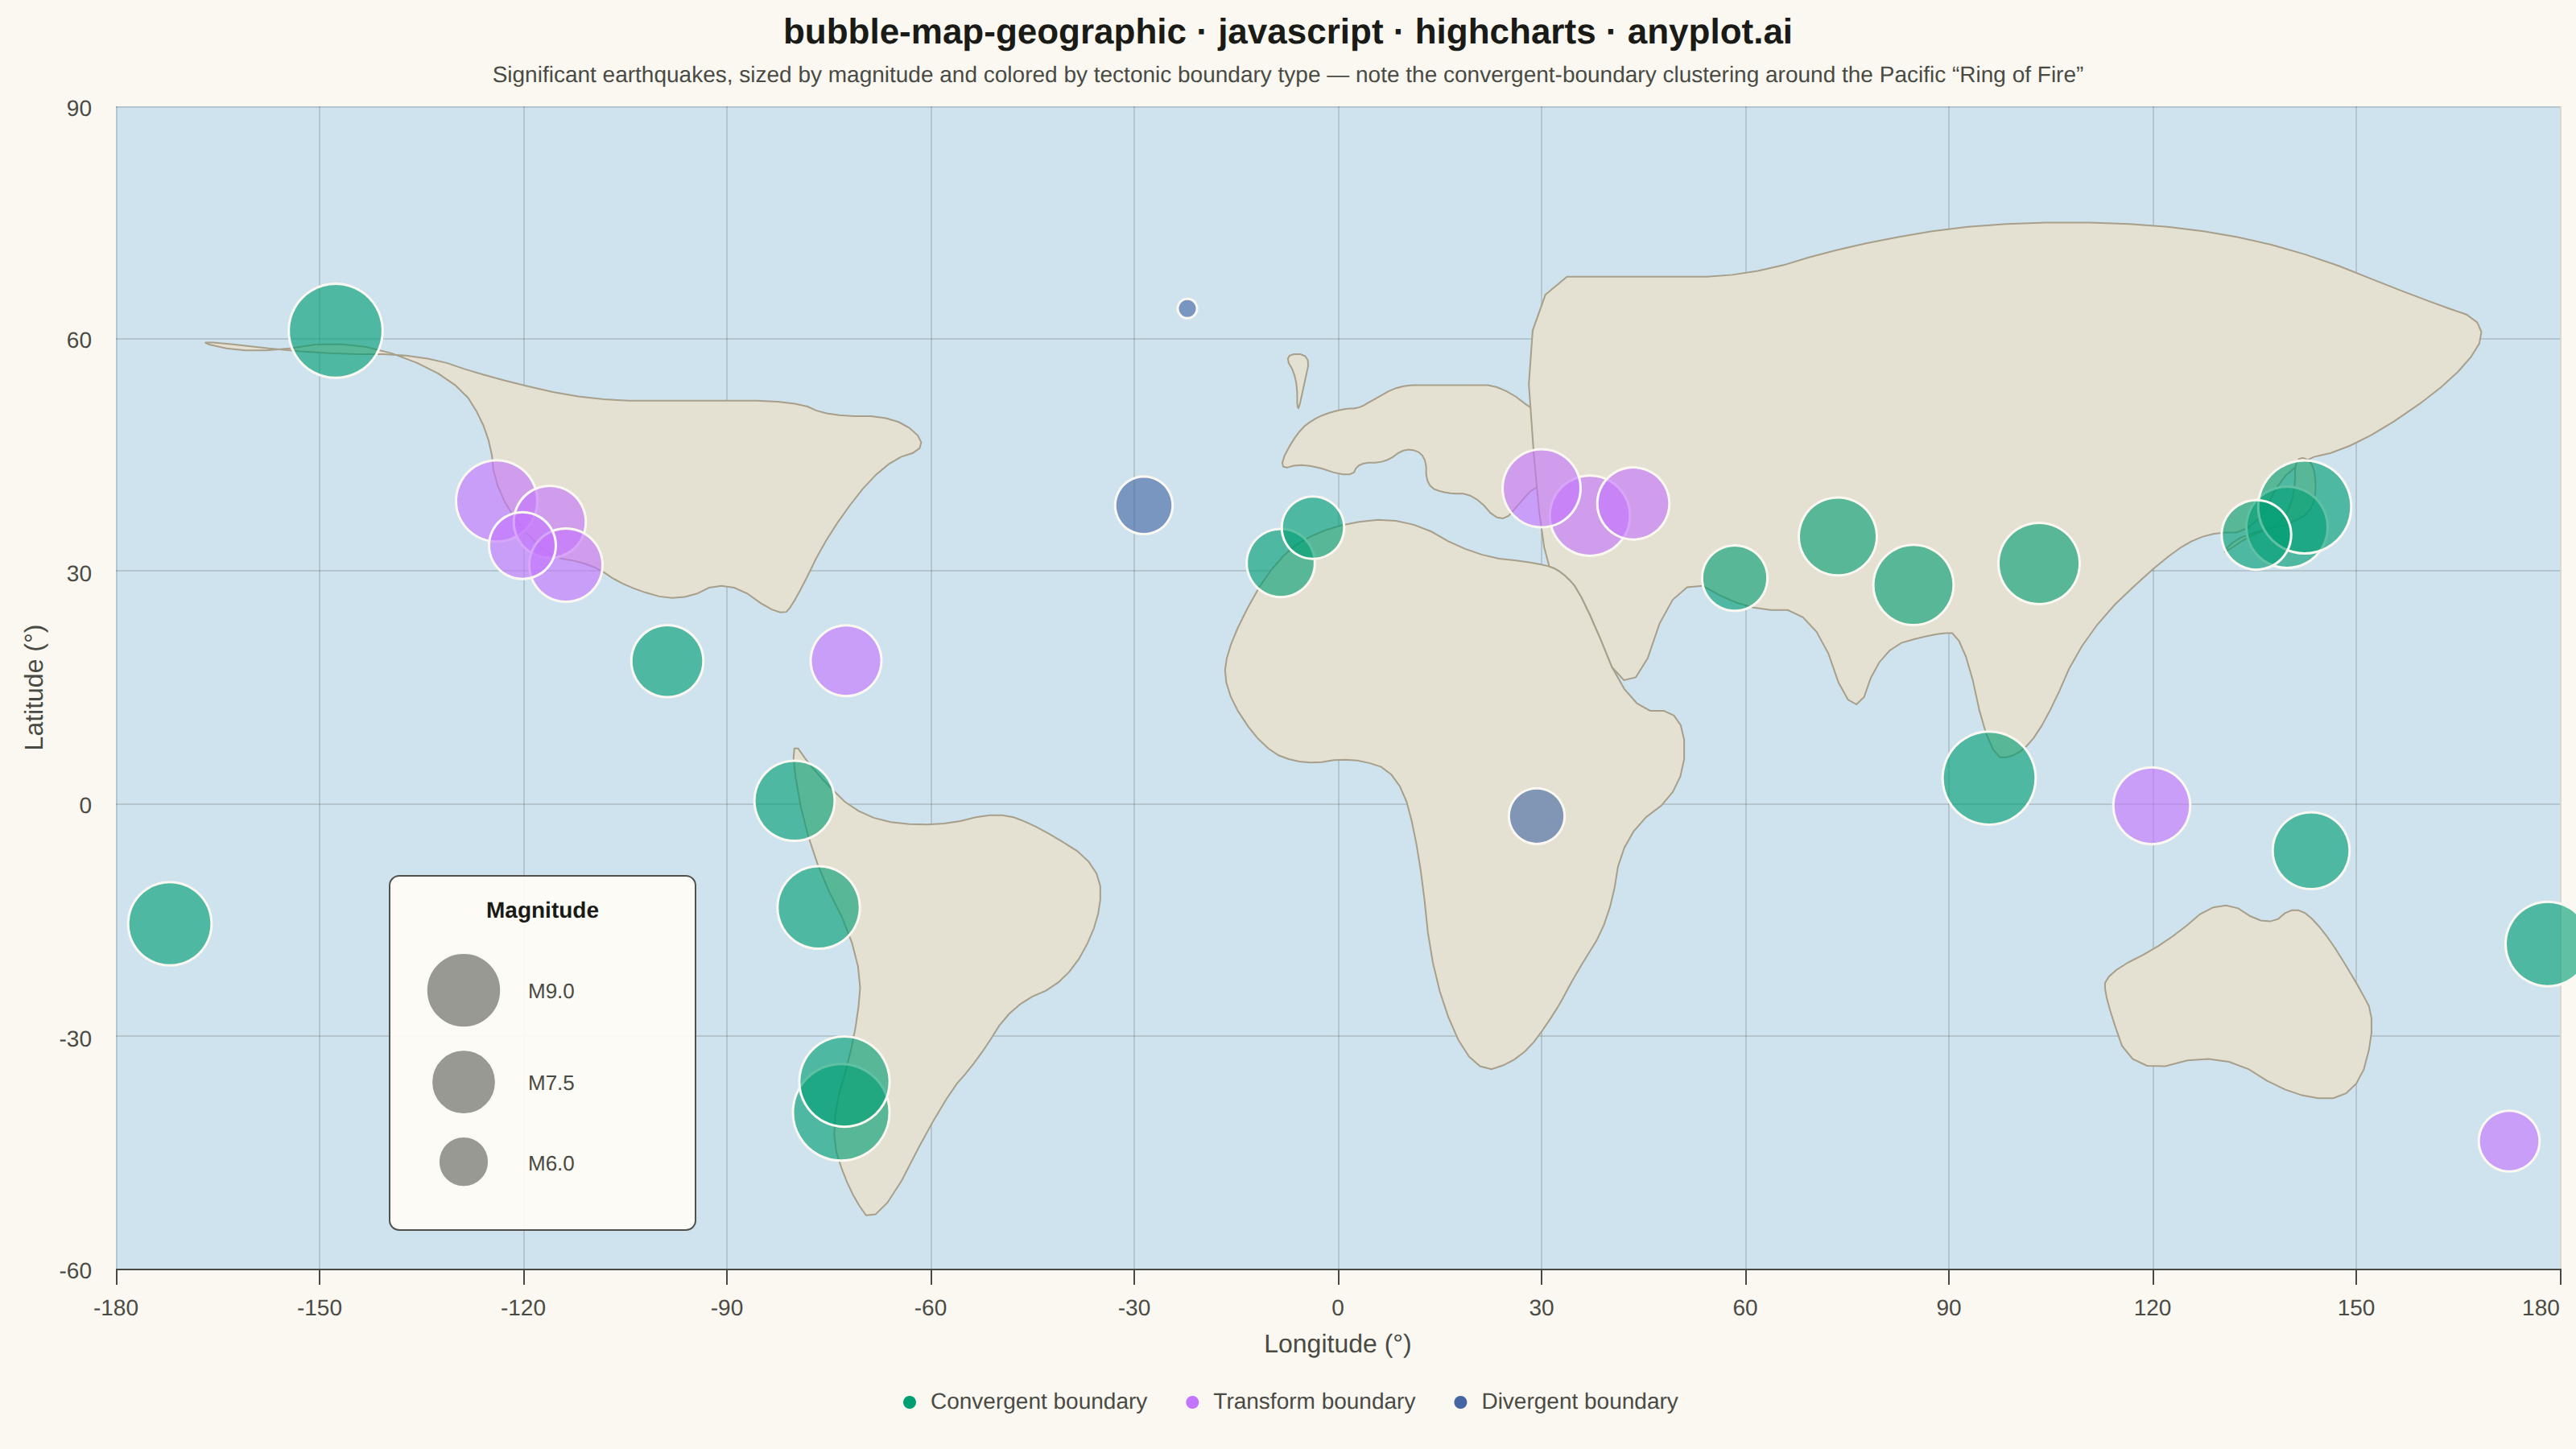
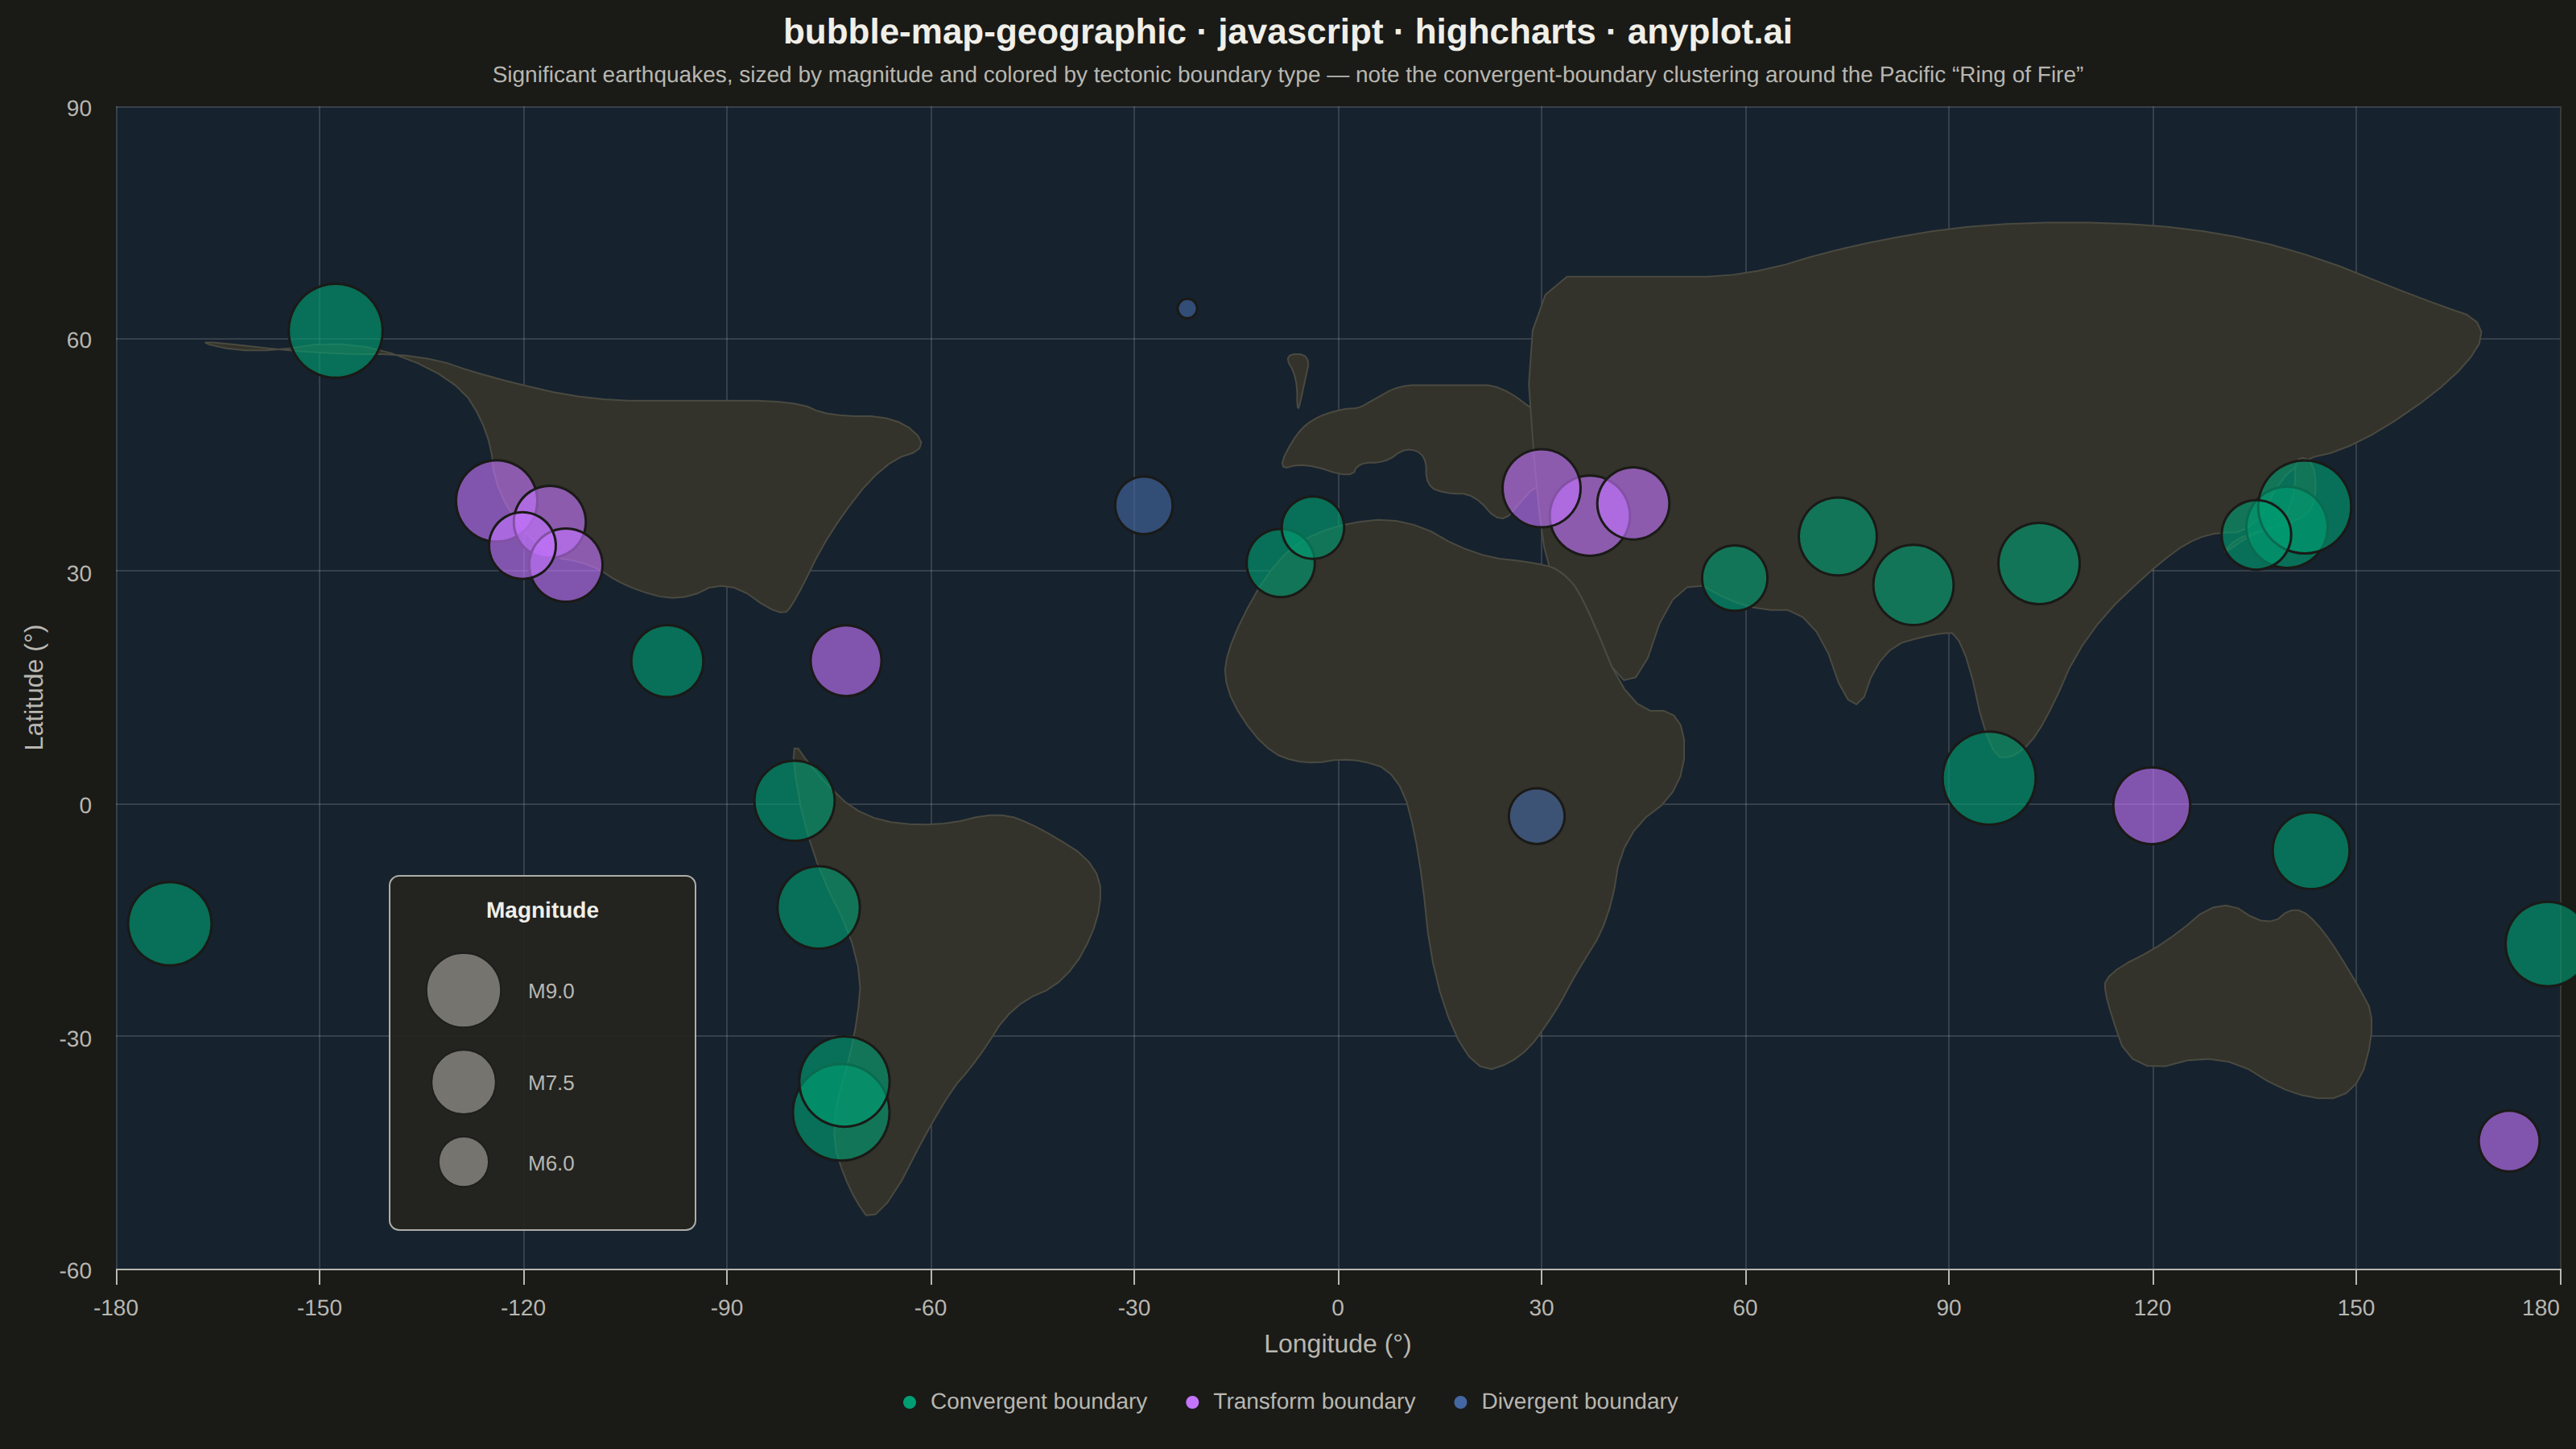
A geographic bubble map where markers are sized proportionally to quantitative data values at each location. Unlike scatter maps where size is optional, bubble maps use marker size as the primary visual encoding to show data magnitude across geographic regions. This visualization makes it immediately apparent where high and low values occur spatially, enabling intuitive comparison of quantities across locations.
// anyplot.ai
// bubble-map-geographic: Bubble Map with Sized Geographic Markers
// Library: highcharts 12.6.0 | JavaScript 22.23.2
// Quality: 86/100 | Created: 2026-09-01

const t = window.ANYPLOT_TOKENS;
const THEME = window.ANYPLOT_THEME;

// --- Basemap chrome (not data — Imprint palette only governs data colors) --
const LAND = THEME === "light" ? "#E4E0D2" : "#33332C";
const LAND_EDGE = THEME === "light" ? "#A79F8A" : "#4A4A40";
const OCEAN = THEME === "light" ? "#CFE3EF" : "#16222E";

// --- Data: significant earthquakes, sized by magnitude, colored by the ------
// --- tectonic boundary type that produced them ------------------------------
const earthquakes = [
  {
    name: "San Francisco, USA (1906)",
    lat: 37.77,
    lon: -122.42,
    magnitude: 7.9,
    boundary: "Transform",
  },
  {
    name: "Tokyo, Japan (1923)",
    lat: 35.68,
    lon: 139.69,
    magnitude: 7.9,
    boundary: "Convergent",
  },
  {
    name: "Valdivia, Chile (1960)",
    lat: -39.83,
    lon: -73.05,
    magnitude: 9.5,
    boundary: "Convergent",
  },
  {
    name: "Anchorage, USA (1964)",
    lat: 61.02,
    lon: -147.65,
    magnitude: 9.2,
    boundary: "Convergent",
  },
  {
    name: "Aceh, Indonesia (2004)",
    lat: 3.3,
    lon: 95.98,
    magnitude: 9.1,
    boundary: "Convergent",
  },
  {
    name: "Kashmir, Pakistan (2005)",
    lat: 34.49,
    lon: 73.63,
    magnitude: 7.6,
    boundary: "Convergent",
  },
  {
    name: "Sichuan, China (2008)",
    lat: 31.0,
    lon: 103.32,
    magnitude: 7.9,
    boundary: "Convergent",
  },
  {
    name: "Port-au-Prince, Haiti (2010)",
    lat: 18.46,
    lon: -72.53,
    magnitude: 7.0,
    boundary: "Transform",
  },
  {
    name: "Maule, Chile (2010)",
    lat: -35.85,
    lon: -72.72,
    magnitude: 8.8,
    boundary: "Convergent",
  },
  {
    name: "Christchurch, New Zealand (2011)",
    lat: -43.53,
    lon: 172.64,
    magnitude: 6.3,
    boundary: "Transform",
  },
  {
    name: "Tohoku, Japan (2011)",
    lat: 38.3,
    lon: 142.37,
    magnitude: 9.1,
    boundary: "Convergent",
  },
  {
    name: "Gorkha, Nepal (2015)",
    lat: 28.23,
    lon: 84.73,
    magnitude: 7.8,
    boundary: "Convergent",
  },
  {
    name: "Muisne, Ecuador (2016)",
    lat: 0.38,
    lon: -79.94,
    magnitude: 7.8,
    boundary: "Convergent",
  },
  {
    name: "Puebla, Mexico (2017)",
    lat: 18.4,
    lon: -98.72,
    magnitude: 7.1,
    boundary: "Convergent",
  },
  {
    name: "Palu, Indonesia (2018)",
    lat: -0.26,
    lon: 119.85,
    magnitude: 7.5,
    boundary: "Transform",
  },
  {
    name: "Ridgecrest, USA (2019)",
    lat: 35.77,
    lon: -117.6,
    magnitude: 7.1,
    boundary: "Transform",
  },
  {
    name: "Kahramanmaraş, Turkey (2023)",
    lat: 37.17,
    lon: 37.03,
    magnitude: 7.8,
    boundary: "Transform",
  },
  {
    name: "Al Haouz, Morocco (2023)",
    lat: 31.06,
    lon: -8.39,
    magnitude: 6.8,
    boundary: "Convergent",
  },
  {
    name: "Reykjanes, Iceland (2021)",
    lat: 63.9,
    lon: -22.27,
    magnitude: 5.0,
    boundary: "Divergent",
  },
  {
    name: "Lake Kivu, DR Congo (2008)",
    lat: -1.6,
    lon: 29.2,
    magnitude: 6.0,
    boundary: "Divergent",
  },
  {
    name: "Azores, Portugal (1998)",
    lat: 38.5,
    lon: -28.5,
    magnitude: 6.1,
    boundary: "Divergent",
  },
  {
    name: "El Mayor-Cucapah, Mexico (2010)",
    lat: 32.29,
    lon: -115.3,
    magnitude: 7.2,
    boundary: "Transform",
  },
  {
    name: "Kobe, Japan (1995)",
    lat: 34.69,
    lon: 135.2,
    magnitude: 6.9,
    boundary: "Convergent",
  },
  {
    name: "Northridge, USA (1994)",
    lat: 34.21,
    lon: -118.54,
    magnitude: 6.7,
    boundary: "Transform",
  },
  {
    name: "Izmit, Turkey (1999)",
    lat: 40.7,
    lon: 29.91,
    magnitude: 7.6,
    boundary: "Transform",
  },
  {
    name: "Bam, Iran (2003)",
    lat: 29.11,
    lon: 58.36,
    magnitude: 6.6,
    boundary: "Convergent",
  },
  {
    name: "Pisco, Peru (2007)",
    lat: -13.39,
    lon: -76.6,
    magnitude: 8.0,
    boundary: "Convergent",
  },
  {
    name: "Samoa Islands (2009)",
    lat: -15.49,
    lon: -172.1,
    magnitude: 8.1,
    boundary: "Convergent",
  },
  {
    name: "Van, Turkey (2011)",
    lat: 38.75,
    lon: 43.44,
    magnitude: 7.1,
    boundary: "Transform",
  },
  {
    name: "Papua New Guinea (2018)",
    lat: -6.06,
    lon: 143.42,
    magnitude: 7.5,
    boundary: "Convergent",
  },
  {
    name: "Fiji (2018)",
    lat: -18.11,
    lon: 178.16,
    magnitude: 8.2,
    boundary: "Convergent",
  },
  {
    name: "Alboran Sea, Spain (2016)",
    lat: 35.62,
    lon: -3.69,
    magnitude: 6.4,
    boundary: "Convergent",
  },
];

const BOUNDARY_ORDER = ["Convergent", "Transform", "Divergent"];
const BOUNDARY_COLORS = {
  Convergent: t.palette[0],
  Transform: t.palette[1],
  Divergent: t.palette[2],
};

// --- Deterministic render-only jitter for the dense California/Baja --------
// --- Transform cluster, which otherwise reads as a single blob at map ------
// --- scale; underlying quake.lat/lon stay the true historical values -------
const RENDER_JITTER = {
  "San Francisco, USA (1906)": { dLon: -1.6, dLat: 1.3 },
  "Ridgecrest, USA (2019)": { dLon: 1.6, dLat: 0.6 },
  "Northridge, USA (1994)": { dLon: -1.6, dLat: -0.9 },
  "El Mayor-Cucapah, Mexico (2010)": { dLon: 1.6, dLat: -1.5 },
};

// --- Bubble sizing: area (not radius) scales with magnitude -----------------
const MIN_R = 6;
const MAX_R = 30;
const magnitudes = earthquakes.map((quake) => quake.magnitude);
const magMin = Math.min(...magnitudes);
const magMax = Math.max(...magnitudes);

function radiusFor(magnitude) {
  const normalized = (magnitude - magMin) / (magMax - magMin);
  return MIN_R + (MAX_R - MIN_R) * Math.sqrt(normalized);
}

function hexToRgba(hex, alpha) {
  const r = parseInt(hex.slice(1, 3), 16);
  const g = parseInt(hex.slice(3, 5), 16);
  const b = parseInt(hex.slice(5, 7), 16);
  return `rgba(${r}, ${g}, ${b}, ${alpha})`;
}

const series = BOUNDARY_ORDER.map((boundary) => ({
  name: `${boundary} boundary`,
  color: BOUNDARY_COLORS[boundary],
  zIndex: 5,
  data: earthquakes
    .filter((quake) => quake.boundary === boundary)
    .map((quake) => {
      const jitter = RENDER_JITTER[quake.name];
      return {
        x: quake.lon + (jitter ? jitter.dLon : 0),
        y: quake.lat + (jitter ? jitter.dLat : 0),
        name: quake.name,
        magnitude: quake.magnitude,
        marker: {
          radius: radiusFor(quake.magnitude),
          fillColor: hexToRgba(BOUNDARY_COLORS[boundary], 0.62),
          lineColor: t.pageBg,
          lineWidth: 1.5,
        },
      };
    }),
}));

// --- Simplified world coastlines (equirectangular lon/lat vertices) ---------
const CONTINENTS = [
  [
    [-170, 60],
    [-160, 58],
    [-145, 60],
    [-130, 55],
    [-125, 48],
    [-124, 40],
    [-117, 32],
    [-110, 31],
    [-105, 28],
    [-97, 26],
    [-90, 29],
    [-82, 24],
    [-80, 26],
    [-75, 35],
    [-67, 44],
    [-60, 46],
    [-65, 50],
    [-75, 50],
    [-80, 52],
    [-95, 52],
    [-110, 52],
    [-125, 55],
    [-135, 58],
    [-150, 58],
    [-170, 60],
  ],
  [
    [-81, 9],
    [-77, 4],
    [-70, -2],
    [-59, -3],
    [-50, -1],
    [-44, -3],
    [-35, -8],
    [-35, -15],
    [-40, -23],
    [-48, -26],
    [-53, -33],
    [-58, -38],
    [-68, -55],
    [-72, -50],
    [-75, -42],
    [-71, -30],
    [-70, -20],
    [-78, -6],
    [-81, 9],
  ],
  [
    [-9, 43],
    [-5, 44],
    [2, 42],
    [3, 44],
    [7, 44],
    [10, 46],
    [13, 45],
    [13, 41],
    [16, 40],
    [20, 40],
    [24, 36],
    [27, 39],
    [29, 41],
    [35, 42],
    [41, 42],
    [45, 42],
    [41, 47],
    [35, 49],
    [30, 50],
    [24, 54],
    [19, 54],
    [14, 54],
    [9, 54],
    [5, 52],
    [3, 51],
    [1, 51],
    [-3, 50],
    [-6, 48],
    [-9, 43],
  ],
  [
    [-6, 50],
    [-5, 54],
    [-4, 58],
    [-8, 58],
    [-6, 55],
    [-6, 50],
  ],
  [
    [-17, 15],
    [-16, 21],
    [-9, 32],
    [-1, 36],
    [10, 37],
    [20, 32],
    [30, 31],
    [33, 30],
    [36, 27],
    [43, 12],
    [51, 12],
    [51, 2],
    [42, -4],
    [40, -15],
    [35, -22],
    [32, -27],
    [27, -33],
    [20, -35],
    [14, -23],
    [12, -6],
    [9, 4],
    [2, 6],
    [-5, 5],
    [-11, 7],
    [-17, 15],
  ],
  [
    [27, 68],
    [45, 68],
    [60, 68],
    [75, 72],
    [95, 75],
    [120, 75],
    [140, 72],
    [160, 65],
    [170, 62],
    [165, 55],
    [150, 46],
    [140, 44],
    [135, 35],
    [128, 35],
    [122, 32],
    [110, 22],
    [104, 10],
    [100, 6],
    [96, 6],
    [92, 22],
    [88, 22],
    [80, 20],
    [76, 10],
    [70, 25],
    [60, 25],
    [50, 30],
    [43, 12],
    [36, 27],
    [33, 30],
    [30, 31],
    [27, 68],
  ],
  [
    [130, 32],
    [132, 34],
    [135, 35],
    [139, 36],
    [141, 40],
    [141, 45],
    [144, 44],
    [144, 38],
    [140, 36],
    [135, 35],
    [130, 32],
  ],
  [
    [113, -22],
    [122, -18],
    [130, -12],
    [137, -16],
    [141, -13],
    [145, -16],
    [150, -23],
    [153, -28],
    [150, -38],
    [141, -38],
    [130, -32],
    [117, -35],
    [113, -25],
    [113, -22],
  ],
];

// --- Corner-cutting refinement (2 Chaikin iterations) so the coastlines -----
// --- read as smooth curves instead of the raw low-vertex source polygons ---
function smoothPolygon(points, iterations) {
  let pts = points;
  for (let iter = 0; iter < iterations; iter++) {
    const refined = [];
    for (let i = 0; i < pts.length - 1; i++) {
      const [x0, y0] = pts[i];
      const [x1, y1] = pts[i + 1];
      refined.push([x0 + 0.25 * (x1 - x0), y0 + 0.25 * (y1 - y0)]);
      refined.push([x0 + 0.75 * (x1 - x0), y0 + 0.75 * (y1 - y0)]);
    }
    refined.push(refined[0]);
    pts = refined;
  }
  return pts;
}

function drawContinents(chart) {
  const xAxis = chart.xAxis[0];
  const yAxis = chart.yAxis[0];
  CONTINENTS.forEach((polygon) => {
    const smoothed = smoothPolygon(polygon, 2);
    const path = smoothed.map((point, i) => [
      i === 0 ? "M" : "L",
      xAxis.toPixels(point[0], false),
      yAxis.toPixels(point[1], false),
    ]);
    path.push(["Z"]);
    chart.renderer
      .path(path)
      .attr({ fill: LAND, stroke: LAND_EDGE, "stroke-width": 1, zIndex: 1 })
      .add();
  });
}

// --- Size legend (core Highcharts has no bubble legend — drawn manually) ----
// Uses its own compact radius scale (independent of the map's marker radii)
// so three reference circles fit comfortably inside the legend box.
const LEGEND_MIN_R = 8;
const LEGEND_MAX_R = 24;
function legendRadiusFor(magnitude) {
  const normalized = (magnitude - magMin) / (magMax - magMin);
  return LEGEND_MIN_R + (LEGEND_MAX_R - LEGEND_MIN_R) * Math.sqrt(normalized);
}

function drawSizeLegend(chart) {
  // Offset clears the Samoa Islands bubble, which sits near the antimeridian.
  const boxX = chart.plotLeft + 170;
  const boxW = 190;
  const boxH = 220;
  const boxY = chart.plotTop + chart.plotHeight - boxH - 24;

  chart.renderer
    .rect(boxX, boxY, boxW, boxH, 6)
    .attr({
      fill: t.elevatedBg,
      stroke: t.inkSoft,
      "stroke-width": 1,
      zIndex: 6,
      opacity: 0.94,
    })
    .add();

  chart.renderer
    .text("Magnitude", boxX + boxW / 2, boxY + 26)
    .attr({ align: "center", zIndex: 7 })
    .css({ color: t.ink, fontSize: "14px", fontWeight: "600" })
    .add();

  let cursorY = boxY + 48;
  [9.0, 7.5, 6.0].forEach((magnitude) => {
    const r = legendRadiusFor(magnitude);
    const cy = cursorY + r;
    chart.renderer
      .circle(boxX + 46, cy, r)
      .attr({
        fill: t.inkSoft,
        opacity: 0.55,
        stroke: t.pageBg,
        "stroke-width": 1,
        zIndex: 7,
      })
      .add();
    chart.renderer
      .text(`M${magnitude.toFixed(1)}`, boxX + 46 + LEGEND_MAX_R + 16, cy + 5)
      .attr({ zIndex: 7 })
      .css({ color: t.inkSoft, fontSize: "13px" })
      .add();
    cursorY += 2 * r + 14;
  });
}

// --- Chart --------------------------------------------------------------------
Highcharts.chart("container", {
  chart: {
    type: "scatter",
    backgroundColor: "transparent",
    plotBackgroundColor: OCEAN,
    animation: false,
    style: { fontFamily: "inherit" },
    events: {
      load: function () {
        drawContinents(this);
        drawSizeLegend(this);
      },
    },
  },
  credits: { enabled: false },
  title: {
    text: "bubble-map-geographic · javascript · highcharts · anyplot.ai",
    style: { color: t.ink, fontSize: "22px", fontWeight: "600" },
  },
  subtitle: {
    text: "Significant earthquakes, sized by magnitude and colored by tectonic boundary type — note the convergent-boundary clustering around the Pacific “Ring of Fire”",
    style: { color: t.inkSoft, fontSize: "14px" },
  },
  xAxis: {
    min: -180,
    max: 180,
    tickInterval: 30,
    title: {
      text: "Longitude (°)",
      style: { color: t.inkSoft, fontSize: "16px" },
    },
    lineColor: t.inkSoft,
    tickColor: t.inkSoft,
    gridLineWidth: 1,
    gridLineColor: t.grid,
    labels: { style: { color: t.inkSoft, fontSize: "14px" } },
  },
  yAxis: {
    min: -60,
    max: 85,
    tickInterval: 30,
    title: {
      text: "Latitude (°)",
      style: { color: t.inkSoft, fontSize: "16px" },
    },
    lineColor: t.inkSoft,
    tickColor: t.inkSoft,
    gridLineWidth: 1,
    gridLineColor: t.grid,
    labels: { style: { color: t.inkSoft, fontSize: "14px" } },
  },
  legend: {
    itemStyle: { color: t.inkSoft, fontSize: "14px" },
    itemHoverStyle: { color: t.ink },
  },
  tooltip: {
    headerFormat: "",
    pointFormatter: function () {
      return `<b>${this.name}</b><br/>Magnitude M${this.magnitude.toFixed(1)}<br/>${this.series.name}`;
    },
  },
  plotOptions: {
    series: {
      animation: false,
      marker: { symbol: "circle", states: { hover: { enabled: false } } },
    },
  },
  series,
});
Runnable source as JSON, for any HTTP client: https://api.anyplot.ai/specs/bubble-map-geographic/highcharts/code. Any spec id and library id listed in llms-full.txt fit the same URL shape; every URL below is complete and callable.
{
  "spec_id": "bubble-map-geographic",
  "language": "javascript",
  "library": "highcharts",
  "page": "https://anyplot.ai/bubble-map-geographic/javascript/highcharts",
  "hub": "https://anyplot.ai/bubble-map-geographic",
  "code_json": "https://api.anyplot.ai/specs/bubble-map-geographic/highcharts/code",
  "spec_json": "https://api.anyplot.ai/specs/bubble-map-geographic",
  "render_light_png": "https://storage.googleapis.com/anyplot-images/plots/bubble-map-geographic/javascript/highcharts/plot-light.png",
  "render_dark_png": "https://storage.googleapis.com/anyplot-images/plots/bubble-map-geographic/javascript/highcharts/plot-dark.png",
  "interactive_light_html": "https://storage.googleapis.com/anyplot-images/plots/bubble-map-geographic/javascript/highcharts/plot-light.html",
  "interactive_dark_html": "https://storage.googleapis.com/anyplot-images/plots/bubble-map-geographic/javascript/highcharts/plot-dark.html",
  "quality_score": 86.0,
  "license": "MIT",
  "guide": "https://anyplot.ai/llms.txt"
}
Part of Bubble Map with Sized Geographic Markers on anyplot.ai.