The same plot in 14 other libraries — Python: Altair, Bokeh, lets-plot, Matplotlib, Plotly, plotnine, Pygal, Seaborn; R: ggplot2; JavaScript: Chart.js, D3.js, Apache ECharts, Highcharts, MUI X Charts. Compare all 15 side by side: Bubble Map with Sized Geographic Markers in Python, R, Julia and JavaScript.
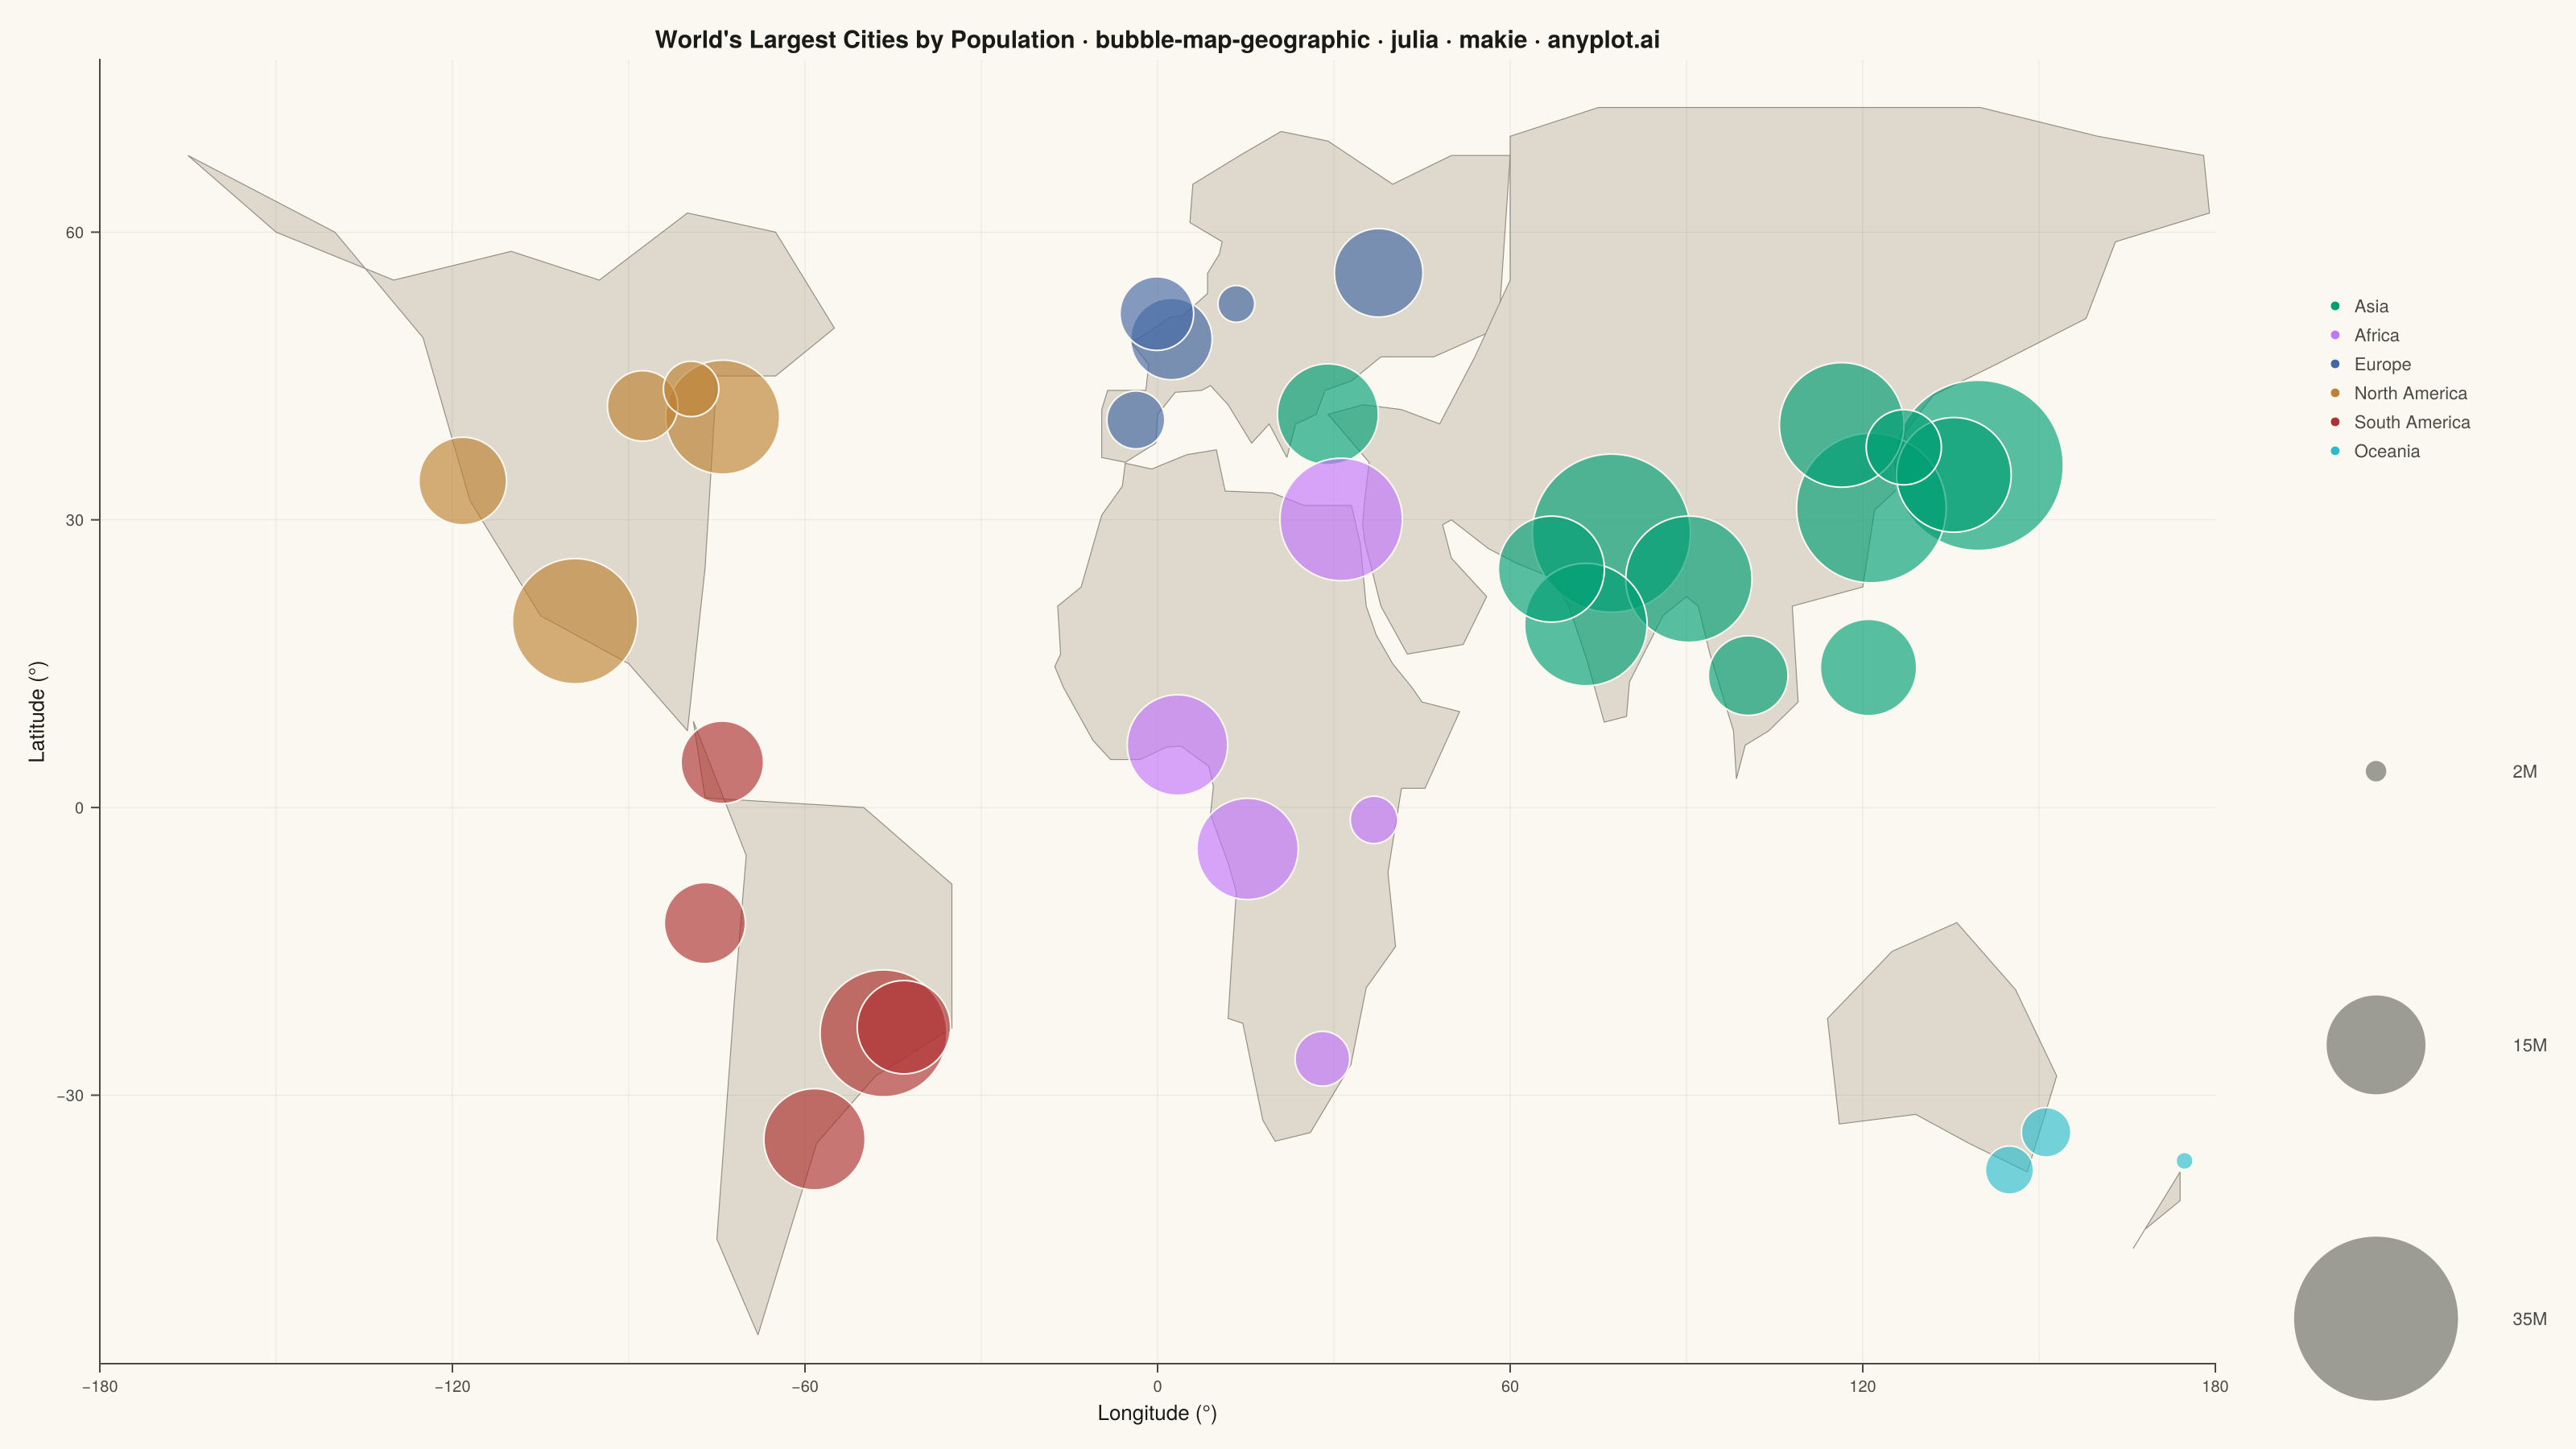
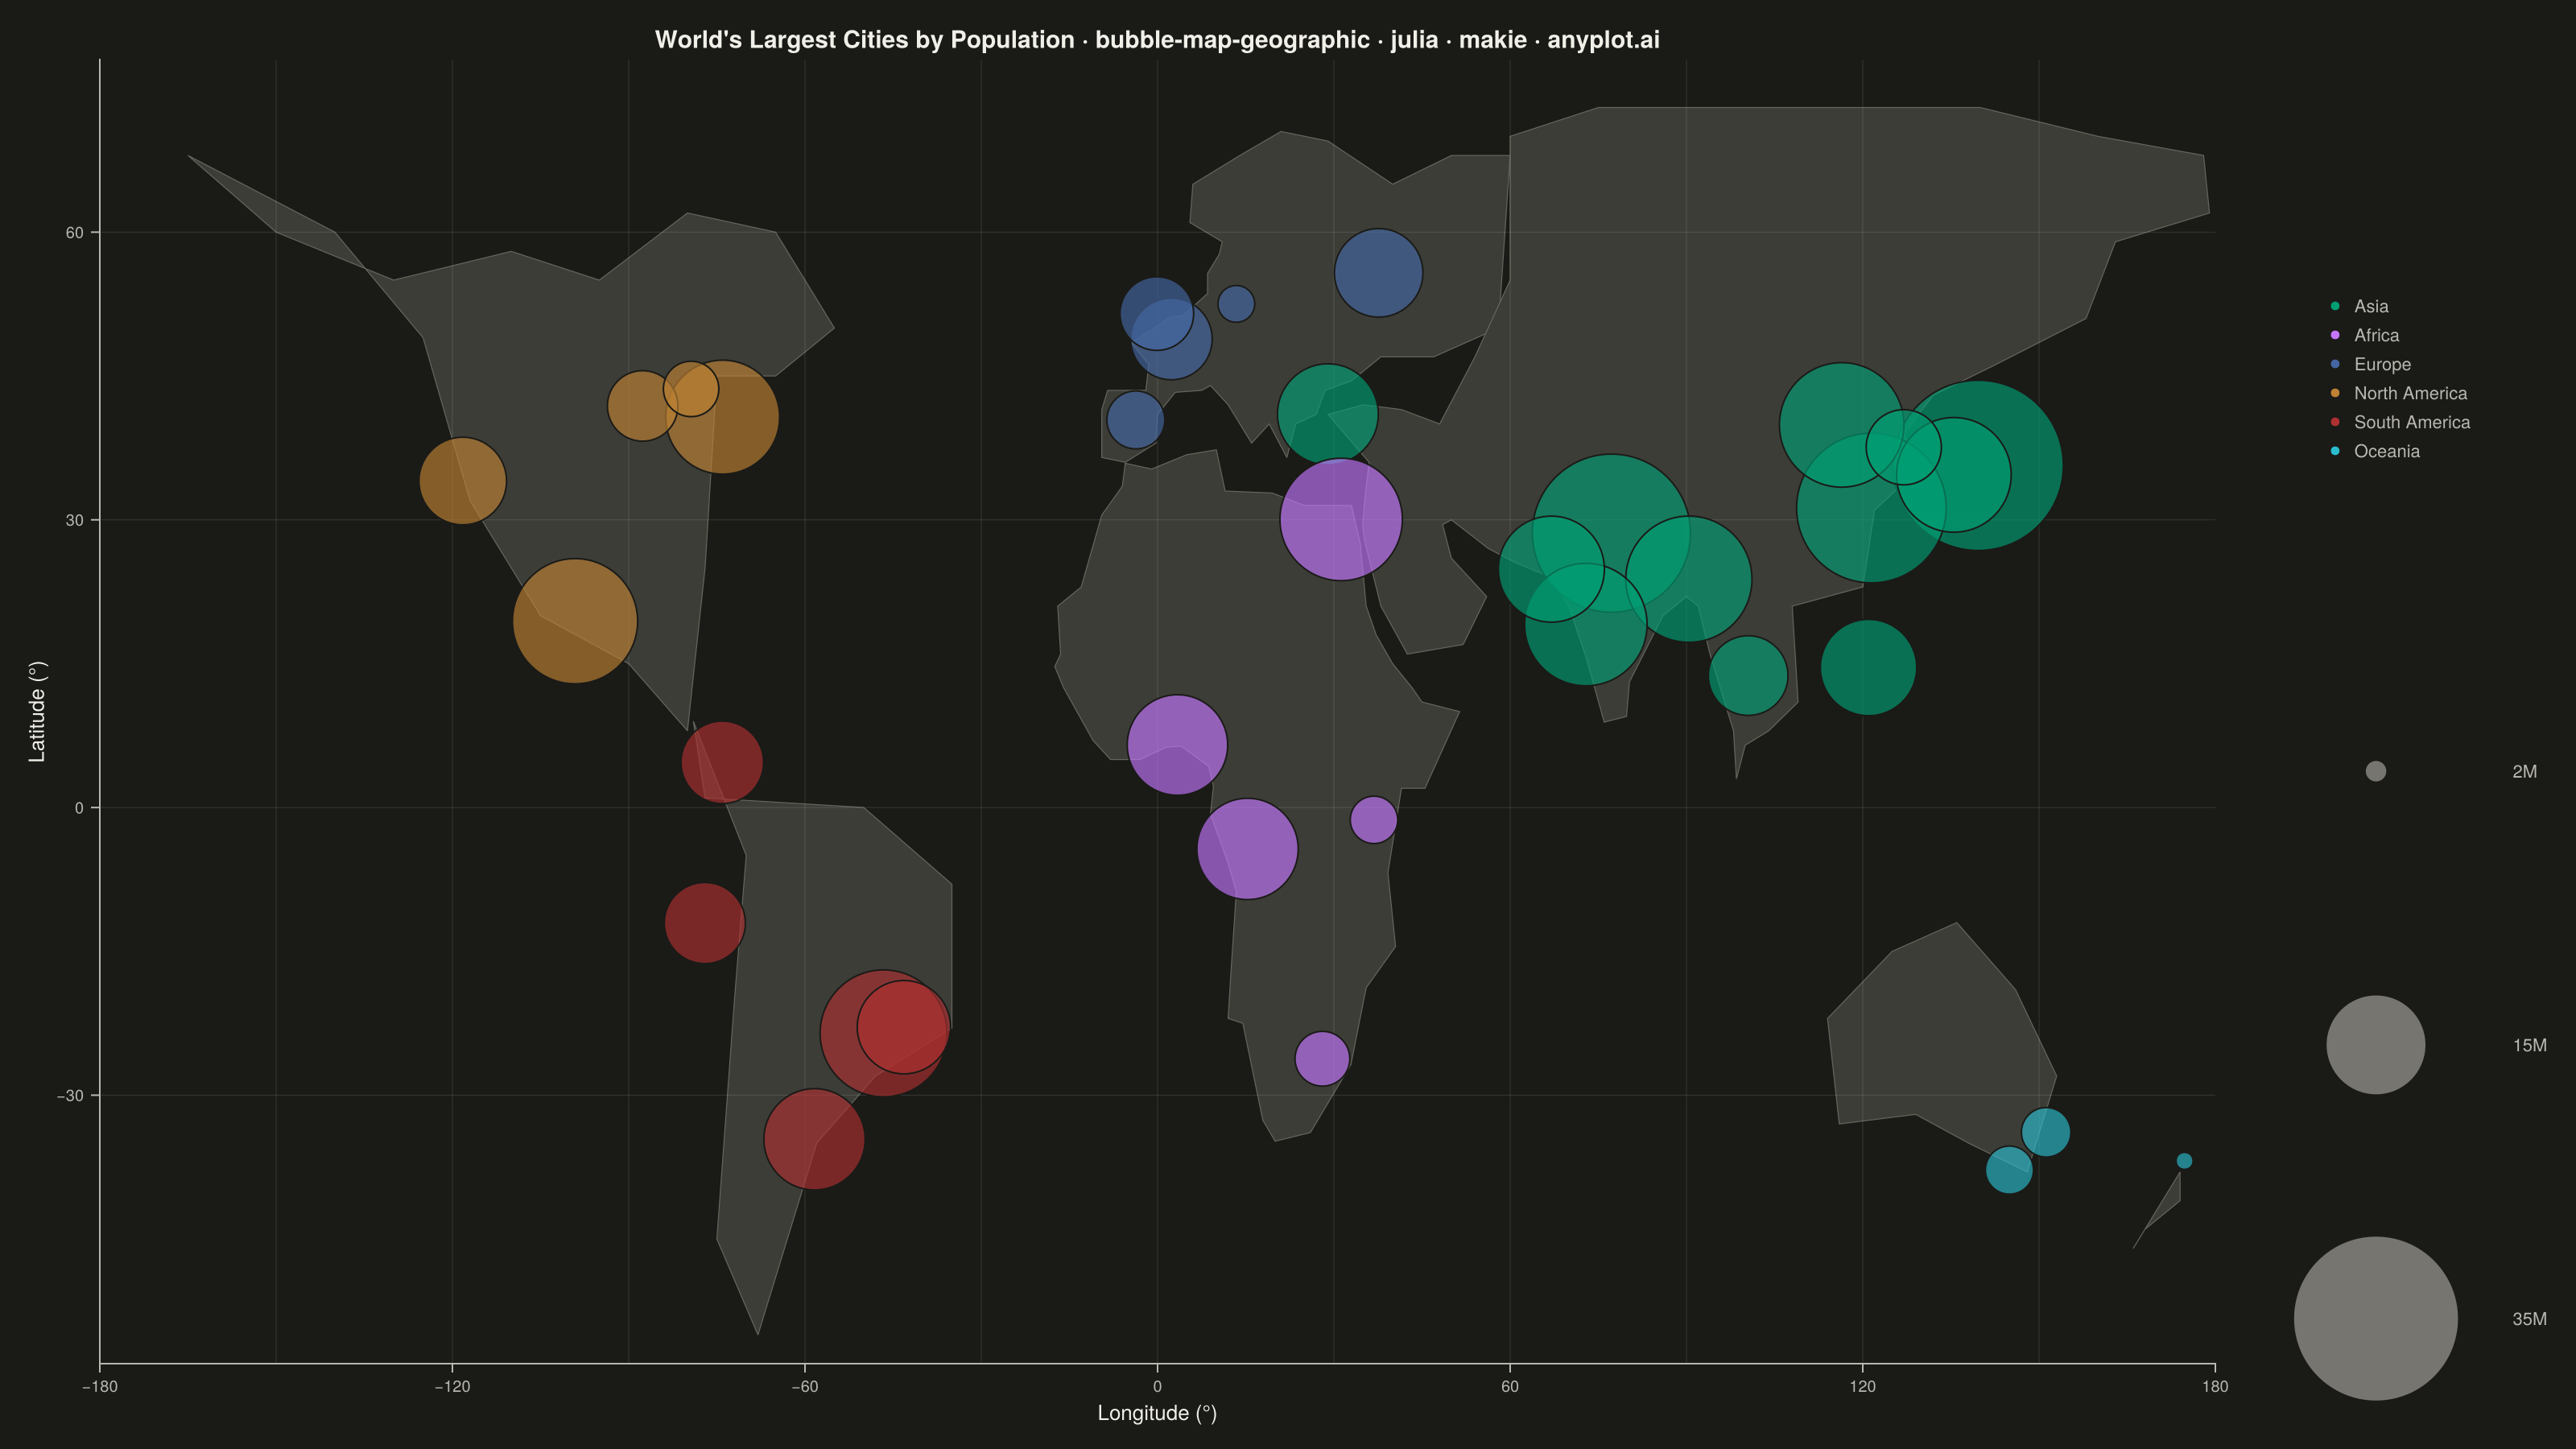
A geographic bubble map where markers are sized proportionally to quantitative data values at each location. Unlike scatter maps where size is optional, bubble maps use marker size as the primary visual encoding to show data magnitude across geographic regions. This visualization makes it immediately apparent where high and low values occur spatially, enabling intuitive comparison of quantities across locations.
# anyplot.ai
# bubble-map-geographic: Bubble Map with Sized Geographic Markers
# Library: makie 0.21.9 | Julia 1.11.9
# Quality: 91/100 | Created: 2026-09-01

using CairoMakie
using Colors

# --- Theme tokens ------------------------------------------------------------
const THEME     = get(ENV, "ANYPLOT_THEME", "light")
const PAGE_BG   = THEME == "light" ? colorant"#FAF8F1" : colorant"#1A1A17"
const INK       = THEME == "light" ? colorant"#1A1A17" : colorant"#F0EFE8"
const INK_SOFT  = THEME == "light" ? colorant"#4A4A44" : colorant"#B8B7B0"
const INK_MUTED = THEME == "light" ? colorant"#6B6A63" : colorant"#A8A79F"

const LAND_FILL = THEME == "light" ?
    RGBAf(0.87f0, 0.85f0, 0.80f0, 1.0f0) :
    RGBAf(0.24f0, 0.24f0, 0.22f0, 1.0f0)
const COAST_COLOR = THEME == "light" ?
    RGBAf(0.58f0, 0.56f0, 0.52f0, 1.0f0) :
    RGBAf(0.40f0, 0.40f0, 0.37f0, 1.0f0)

const GRAT_ALPHA = THEME == "light" ? 0.08f0 : 0.13f0
const GRAT_COLOR = RGBAf(INK.r, INK.g, INK.b, GRAT_ALPHA)

# Imprint categorical palette — 6 world regions, canonical order (abstract categories)
const IMPRINT_PALETTE = [
    colorant"#009E73",  # 1 — Asia
    colorant"#C475FD",  # 2 — Africa
    colorant"#4467A3",  # 3 — Europe
    colorant"#BD8233",  # 4 — North America
    colorant"#AE3030",  # 5 — South America
    colorant"#2ABCCD",  # 6 — Oceania
]
const REGION_NAMES = ["Asia", "Africa", "Europe", "North America", "South America", "Oceania"]

# --- Data: major world cities by metro population (millions) -----------------
# (name, latitude, longitude, population_millions, region_index)
const cities = [
    ("Tokyo", 35.68, 139.65, 37.4, 1), ("Delhi", 28.61, 77.23, 32.9, 1),
    ("Shanghai", 31.23, 121.47, 29.9, 1), ("Dhaka", 23.81, 90.41, 22.4, 1),
    ("Beijing", 39.90, 116.41, 21.9, 1), ("Mumbai", 19.08, 72.88, 21.3, 1),
    ("Osaka", 34.69, 135.50, 19.1, 1), ("Karachi", 24.86, 67.01, 16.8, 1),
    ("Istanbul", 41.01, 28.98, 15.5, 1), ("Manila", 14.60, 120.98, 14.4, 1),
    ("Bangkok", 13.76, 100.50, 10.7, 1), ("Seoul", 37.57, 126.98, 9.8, 1),
    ("Cairo", 30.04, 31.24, 21.3, 2), ("Lagos", 6.52, 3.38, 15.4, 2),
    ("Kinshasa", -4.32, 15.31, 15.6, 2), ("Johannesburg", -26.20, 28.05, 6.2, 2),
    ("Nairobi", -1.29, 36.82, 5.1, 2),
    ("Moscow", 55.76, 37.62, 12.6, 3), ("Paris", 48.86, 2.35, 11.1, 3),
    ("London", 51.51, -0.13, 9.5, 3), ("Madrid", 40.42, -3.70, 6.7, 3),
    ("Berlin", 52.52, 13.40, 3.7, 3),
    ("Mexico City", 19.43, -99.13, 22.1, 4), ("New York", 40.71, -74.01, 18.9, 4),
    ("Los Angeles", 34.05, -118.24, 12.4, 4), ("Chicago", 41.88, -87.63, 8.9, 4),
    ("Toronto", 43.65, -79.38, 6.3, 4),
    ("Sao Paulo", -23.55, -46.63, 22.6, 5), ("Buenos Aires", -34.60, -58.38, 15.6, 5),
    ("Rio de Janeiro", -22.91, -43.17, 13.7, 5), ("Bogota", 4.71, -74.07, 11.3, 5),
    ("Lima", -12.05, -77.04, 11.0, 5),
    ("Sydney", -33.87, 151.21, 5.4, 6), ("Melbourne", -37.81, 144.96, 5.2, 6),
    ("Auckland", -36.85, 174.76, 1.7, 6),
]

const lats   = Float64[c[2] for c in cities]
const lons   = Float64[c[3] for c in cities]
const pops   = Float64[c[4] for c in cities]
const region = Int[c[5] for c in cities]

# Area-proportional bubble size: markersize scales with sqrt(population), not
# population itself, so visual AREA (not radius) tracks the data value.
const POP_MIN, POP_MAX = minimum(pops), maximum(pops)
const SIZE_MIN, SIZE_MAX = 15.0, 150.0
const sizes = SIZE_MIN .+ (SIZE_MAX - SIZE_MIN) .*
    (sqrt.(pops) .- sqrt(POP_MIN)) ./ (sqrt(POP_MAX) - sqrt(POP_MIN))

# --- Simplified continent basemap (own approximate coastlines) ---------------
# poly! auto-closes each polygon (last point connects back to first).
const _CONTINENTS_RAW = [
    # North America
    [(-165,68),(-140,60),(-125,49),(-117,32),(-105,20),(-90,15),(-80,8),
     (-77,25),(-75,45),(-65,45),(-55,50),(-65,60),(-80,62),(-95,55),
     (-110,58),(-130,55),(-150,60),(-165,68)],
    # South America
    [(-79,9),(-77,1),(-50,0),(-35,-8),(-35,-23),(-48,-28),(-58,-35),
     (-68,-55),(-75,-45),(-72,-20),(-70,-5),(-79,9)],
    # Europe (Iberia -> Atlantic coast -> Scandinavia -> European Russia -> Black Sea -> Balkans/Italy -> back)
    [(-9.5,36.5),(-9.5,41.5),(-8.5,43.5),(-2,43.5),(-1.5,46.2),(-4.5,48.5),
     (-1.5,49.6),(2,51.1),(4.3,51.3),(8.5,53.6),(8.5,55.7),(10.5,57.7),
     (11,59),(5.5,61),(6,65),(14,68),(21,70.5),(29,69.5),(40,65),(50,68),
     (60,68),(58,50),(47,47),(38,47),(33,44.5),(28.5,43.5),(27,41),
     (23.5,40),(22,36.5),(19,40),(16,38),(12,42),(9,44),(7.5,43.5),
     (3,43.3),(0,41),(-0.3,38),(-5.5,36),(-9.5,36.5)],
    # Africa (Gibraltar -> western bulge -> Gulf of Guinea -> Cape -> Horn of Africa -> Red Sea -> back)
    [(-5.5,35.9),(-6,33.5),(-9.5,30.5),(-13,23),(-17,21),(-16.5,16),
     (-17.5,14.7),(-16,12.5),(-11,7),(-8,5),(-3,5),(1.5,6.3),(4,6.4),
     (8.7,4.3),(9.5,2.2),(9,-0.7),(12,-5.8),(13.4,-8.8),(12.5,-17),
     (12,-22),(14.5,-22.5),(17.9,-32.6),(20,-34.8),(26,-33.9),(32.9,-26.8),
     (35.5,-18.8),(40.5,-14.5),(39.2,-6.8),(41.5,2),(45.5,2),(51.4,10),
     (45,11),(43.3,12.5),(40,15),(37.2,18),(35.5,21),(34.5,27.5),
     (33,31.5),(25,31.5),(19.5,32.8),(11.5,33),(10,37.3),(5,36.8),
     (-1,35.3),(-5.5,35.9)],
    # Asia (Bosphorus -> Siberian arctic coast -> Far East -> Southeast Asia ->
    #        India peninsula -> Arabian coast -> Levant -> back)
    [(29,41),(35,42),(41.5,41.5),(48,40),(54,47),(60,55),(60,70),(75,73),
     (105,73),(140,73),(160,70),(178,68),(179,62),(163,59),(158,51),
     (142,46),(132,43),(127,39),(129,35),(122,31),(120,23),(108,21),
     (109,11),(104,8),(100,6.5),(98.5,3),(98,8),(94,16),(92,21),(90,22),
     (86,20),(80.3,13.1),(79.8,9.5),(76,8.9),(73,15.5),(70,21),(67,24),
     (61,25.5),(56.3,27),(50,30),(48.5,29.5),(50,26),(56,22),(52,17),
     (42.5,16),(38,21),(35.2,27.9),(34.9,29.5),(35.2,31.8),(36,36),
     (29,41)],
    # Australia
    [(114,-22),(116,-33),(129,-32),(138,-35),(148,-38),(153,-28),
     (146,-19),(136,-12),(125,-15),(114,-22)],
    # New Zealand
    [(166,-46),(168,-44),(174,-41),(174,-38),(172,-40),(167,-45),(166,-46)],
]
const CONTINENTS = [[Point2f(p[1], p[2]) for p in c] for c in _CONTINENTS_RAW]

# --- Figure: landscape 1600x900 -> 3200x1800 at px_per_unit=2 ----------------
const title_str = "World's Largest Cities by Population · bubble-map-geographic · julia · makie · anyplot.ai"
const title_sz  = round(Int, 20 * min(1.0, 67 / length(title_str)))

fig = Figure(
    size            = (1600, 900),
    fontsize        = 12,
    backgroundcolor = PAGE_BG,
)

ax = Axis(
    fig[1, 1];
    title             = title_str,
    titlesize         = title_sz,
    titlecolor        = INK,
    xlabel            = "Longitude (°)",
    ylabel            = "Latitude (°)",
    xlabelsize        = 13,
    ylabelsize        = 13,
    xlabelcolor       = INK,
    ylabelcolor       = INK,
    xticklabelsize    = 10,
    yticklabelsize    = 10,
    xticklabelcolor   = INK_SOFT,
    yticklabelcolor   = INK_SOFT,
    xtickcolor        = INK_SOFT,
    ytickcolor        = INK_SOFT,
    backgroundcolor   = PAGE_BG,
    topspinevisible   = false,
    rightspinevisible = false,
    leftspinecolor    = INK_SOFT,
    bottomspinecolor  = INK_SOFT,
    xgridvisible      = false,
    ygridvisible      = false,
    limits            = (-180, 180, -58, 78),
    xticks            = -180:60:180,
    yticks            = [-60, -30, 0, 30, 60],
)

# Land basemap, drawn first so bubbles sit on top of it
for pts in CONTINENTS
    poly!(ax, pts; color = LAND_FILL, strokecolor = COAST_COLOR, strokewidth = 0.6)
end

# Graticule: reference grid lines for geographic context
for lon in -180:30:180
    lines!(ax, [Float64(lon), Float64(lon)], [-58.0, 78.0]; color = GRAT_COLOR, linewidth = 0.5)
end
for lat in -60:30:60
    lines!(ax, [-180.0, 180.0], [Float64(lat), Float64(lat)]; color = GRAT_COLOR, linewidth = 0.5)
end

# Bubbles, one scatter! call per region so each becomes a labeled legend entry
for r in 1:length(REGION_NAMES)
    mask = region .== r
    scatter!(ax, lons[mask], lats[mask];
        markersize  = sizes[mask],
        color       = IMPRINT_PALETTE[r],
        alpha       = 0.65,
        strokewidth = 1.0,
        strokecolor = PAGE_BG,
        label       = REGION_NAMES[r],
    )
end

# --- Legends: region color key + bubble size key, stacked in a side column ---
legend_col = fig[1, 2] = GridLayout()

Legend(legend_col[1, 1], ax;
    title          = "Region",
    titlesize      = 13,
    titlecolor     = INK,
    labelsize      = 11,
    labelcolor     = INK_SOFT,
    framevisible   = false,
    patchsize      = (14, 14),
    rowgap         = 4,
)

const legend_pops  = [2.0, 15.0, 35.0]
const legend_sizes = SIZE_MIN .+ (SIZE_MAX - SIZE_MIN) .*
    (sqrt.(legend_pops) .- sqrt(POP_MIN)) ./ (sqrt(POP_MAX) - sqrt(POP_MIN))
const size_elements = [
    MarkerElement(color = RGBAf(INK_MUTED.r, INK_MUTED.g, INK_MUTED.b, 0.65f0),
                  marker = :circle, markersize = s, strokewidth = 0)
    for s in legend_sizes
]

Legend(legend_col[2, 1], size_elements, ["$(round(Int, p))M" for p in legend_pops];
    title        = "Population",
    titlesize    = 13,
    titlecolor   = INK,
    labelsize    = 11,
    labelcolor   = INK_SOFT,
    framevisible = false,
    patchsize    = (160, 160),
    rowgap       = 10,
)

colsize!(fig.layout, 2, Fixed(190))

save("plot-$(THEME).png", fig; px_per_unit = 2)
Runnable source as JSON, for any HTTP client: https://api.anyplot.ai/specs/bubble-map-geographic/makie/code. Any spec id and library id listed in llms-full.txt fit the same URL shape; every URL below is complete and callable.
{
  "spec_id": "bubble-map-geographic",
  "language": "julia",
  "library": "makie",
  "page": "https://anyplot.ai/bubble-map-geographic/julia/makie",
  "hub": "https://anyplot.ai/bubble-map-geographic",
  "code_json": "https://api.anyplot.ai/specs/bubble-map-geographic/makie/code",
  "spec_json": "https://api.anyplot.ai/specs/bubble-map-geographic",
  "render_light_png": "https://storage.googleapis.com/anyplot-images/plots/bubble-map-geographic/julia/makie/plot-light.png",
  "render_dark_png": "https://storage.googleapis.com/anyplot-images/plots/bubble-map-geographic/julia/makie/plot-dark.png",
  "quality_score": 91.0,
  "license": "MIT",
  "guide": "https://anyplot.ai/llms.txt"
}
Part of Bubble Map with Sized Geographic Markers on anyplot.ai.