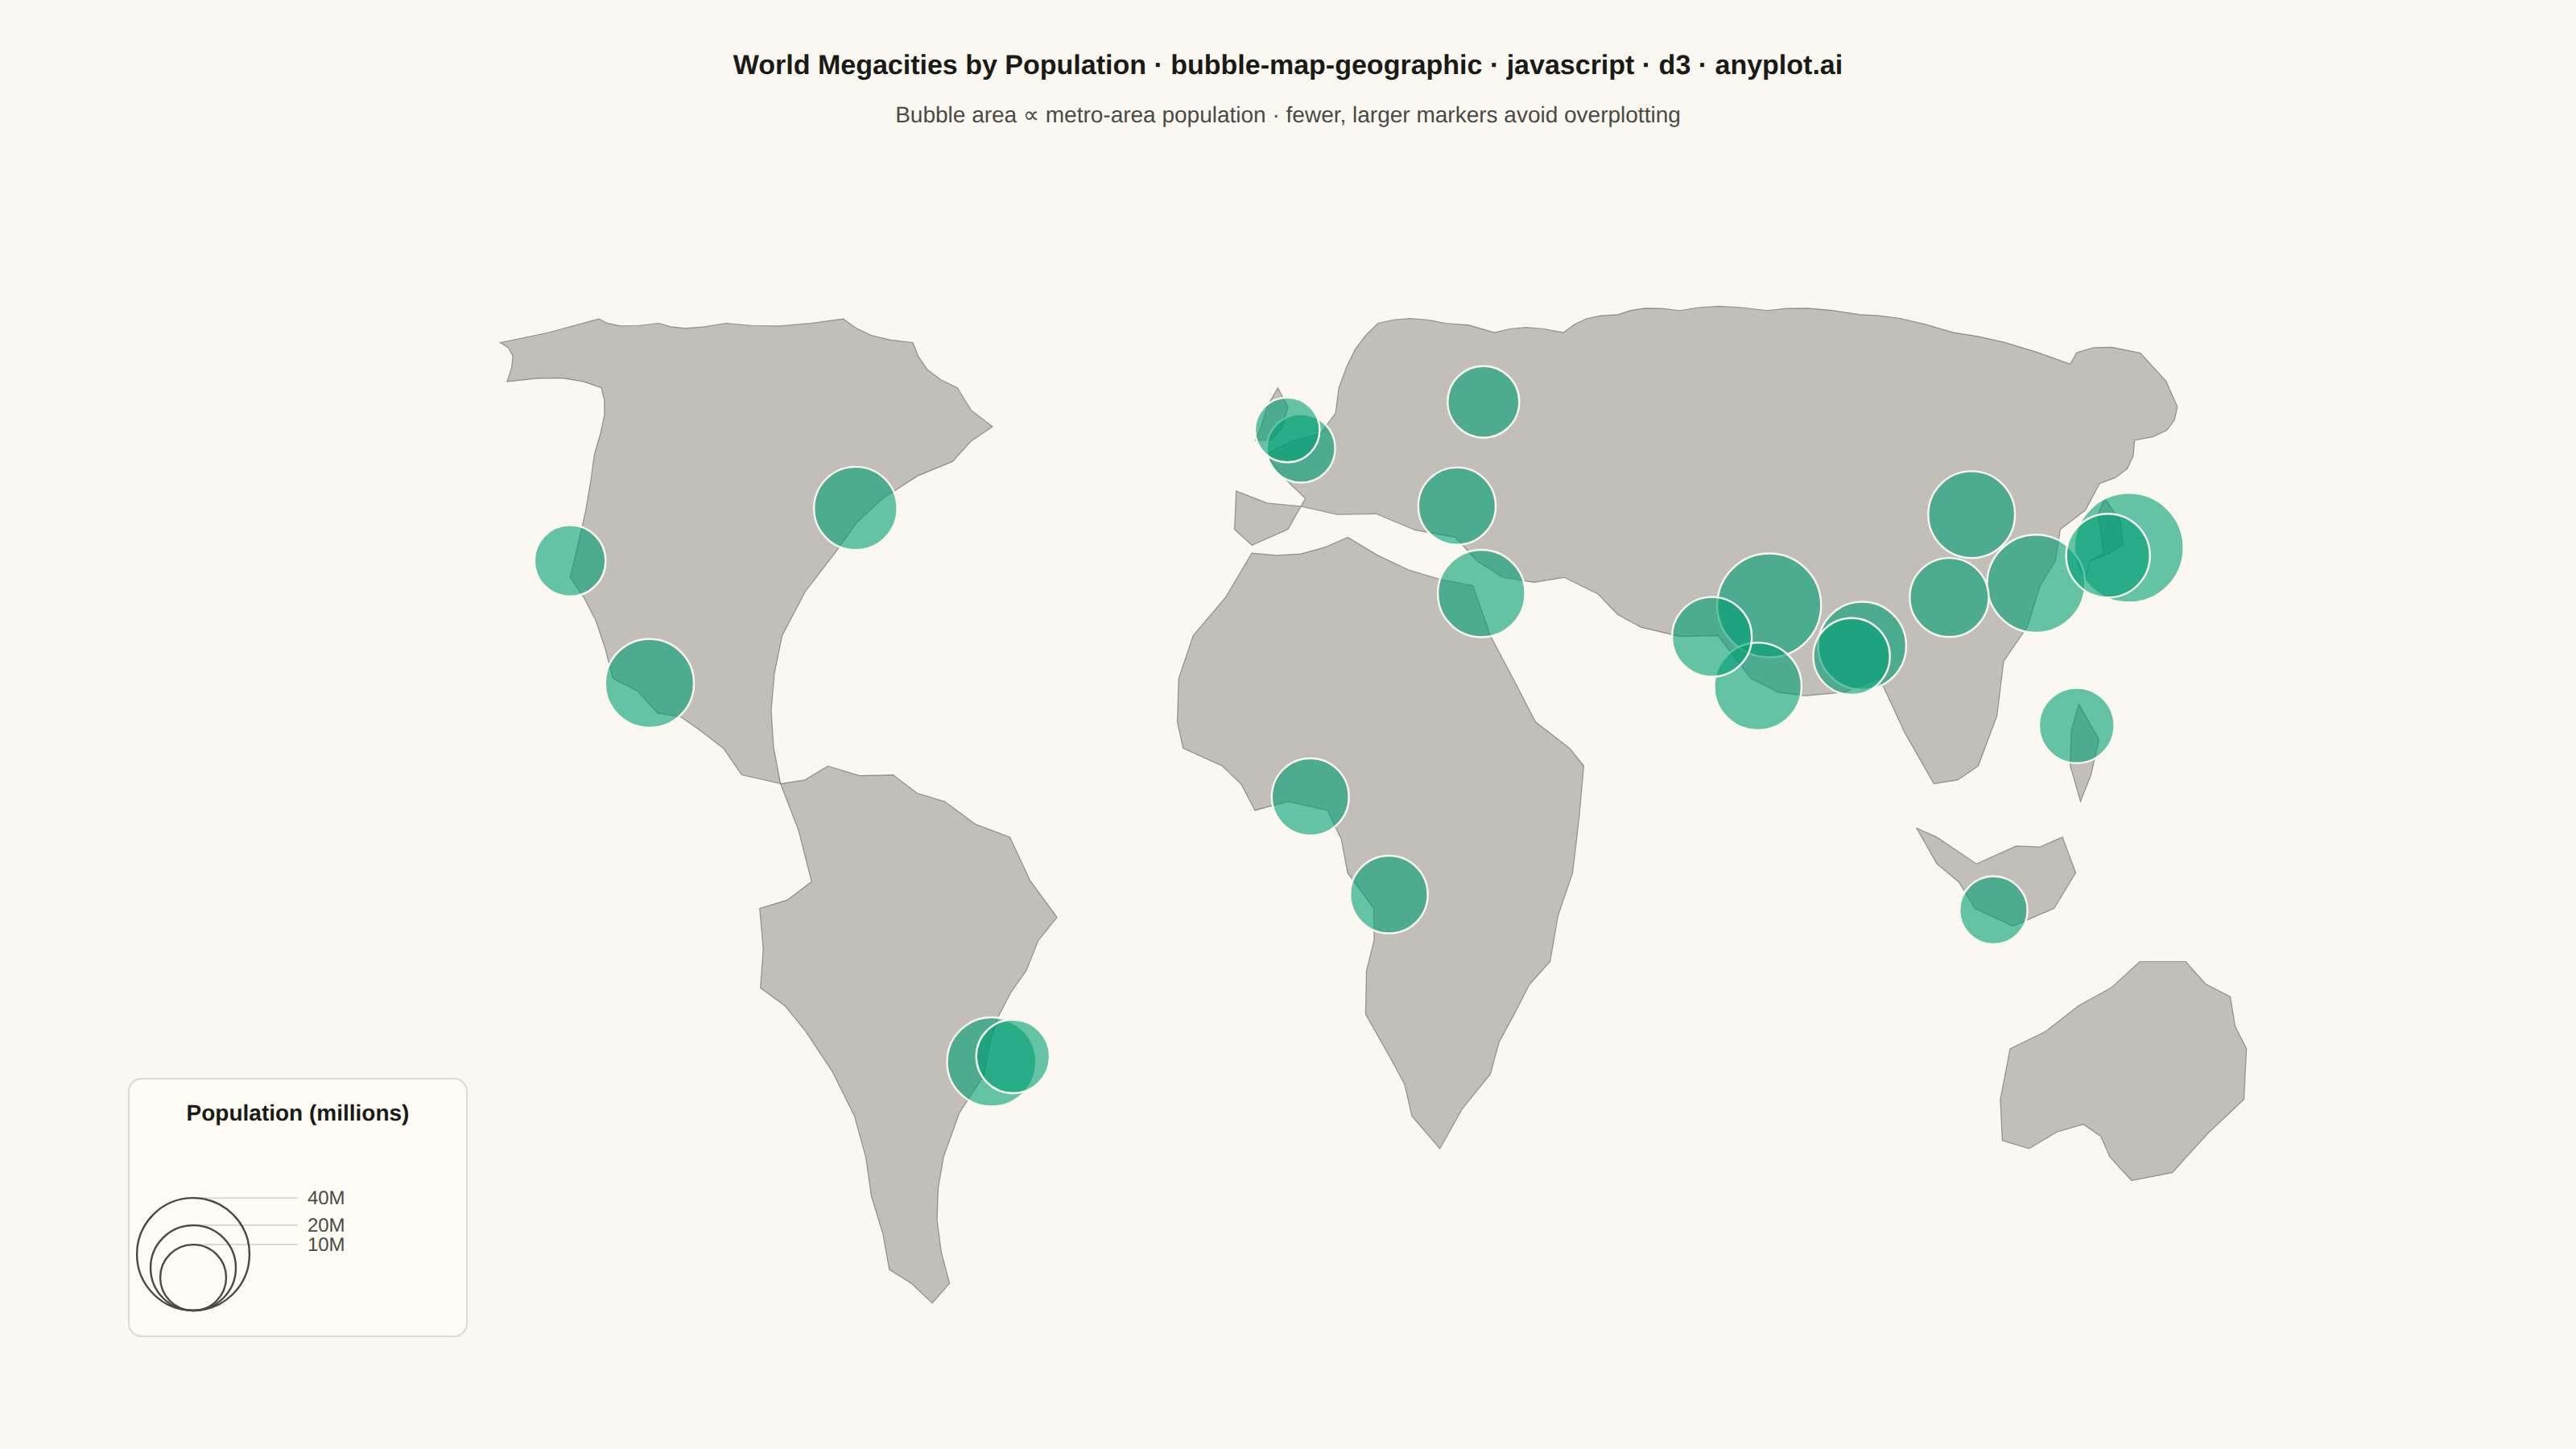
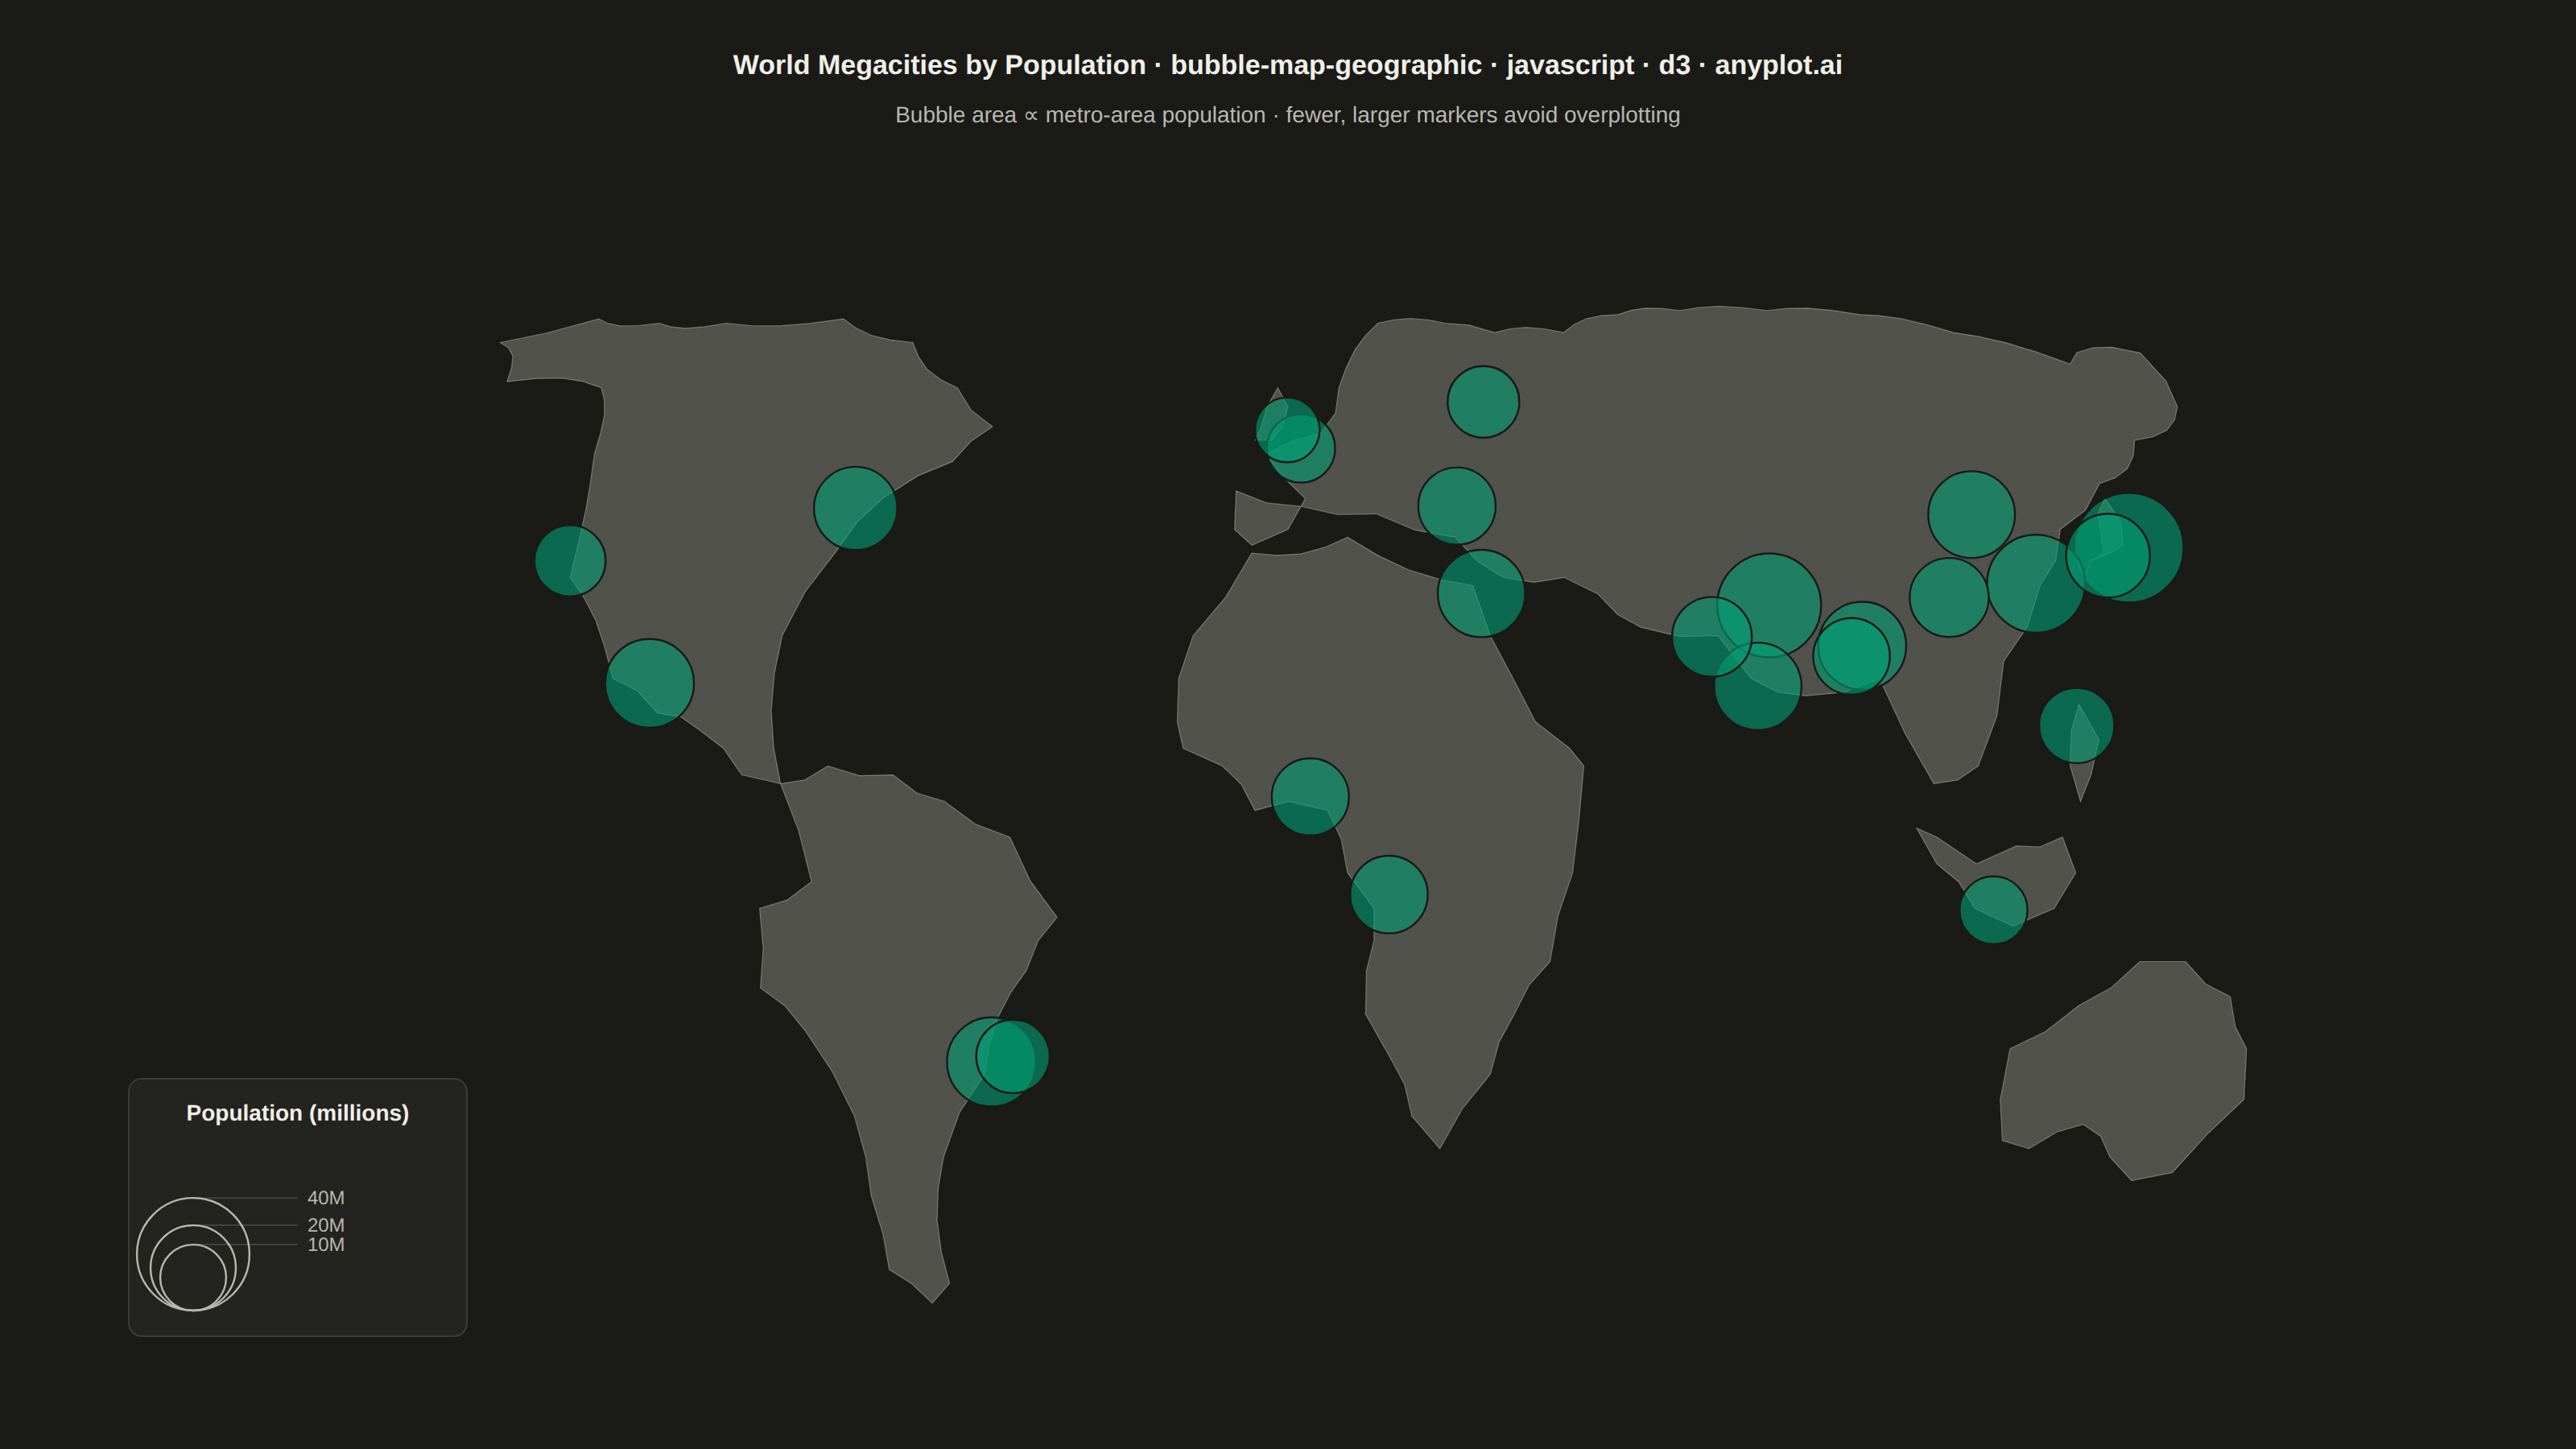
The same plot in 14 other libraries — JavaScript: Chart.js, Apache ECharts, Highcharts, MUI X Charts; Python: Altair, Bokeh, lets-plot, Matplotlib, Plotly, plotnine, Pygal, Seaborn; R: ggplot2; Julia: Makie.jl. Compare all 15 side by side: Bubble Map with Sized Geographic Markers in Python, R, Julia and JavaScript.
A geographic bubble map where markers are sized proportionally to quantitative data values at each location. Unlike scatter maps where size is optional, bubble maps use marker size as the primary visual encoding to show data magnitude across geographic regions. This visualization makes it immediately apparent where high and low values occur spatially, enabling intuitive comparison of quantities across locations.
// anyplot.ai
// bubble-map-geographic: Bubble Map with Sized Geographic Markers
// Library: d3 7.9.0 | JavaScript 22.23.2
// Quality: 92/100 | Created: 2026-09-01

const t = window.ANYPLOT_TOKENS;
const { width, height } = window.ANYPLOT_SIZE;
const THEME = window.ANYPLOT_THEME;
const BRAND = t.palette[0];
const MUTED = THEME === "dark" ? "#A8A79F" : "#6B6A63";

// --- Data: the world's most populous metro areas ---------------------------
const cities = [
  { name: "Tokyo", lon: 139.69, lat: 35.68, pop: 37.4 },
  { name: "Delhi", lon: 77.21, lat: 28.61, pop: 32.9 },
  { name: "Shanghai", lon: 121.47, lat: 31.23, pop: 28.5 },
  { name: "Dhaka", lon: 90.41, lat: 23.81, pop: 21.7 },
  { name: "São Paulo", lon: -46.63, lat: -23.55, pop: 22.4 },
  { name: "Mexico City", lon: -99.13, lat: 19.43, pop: 22.2 },
  { name: "Cairo", lon: 31.24, lat: 30.04, pop: 21.3 },
  { name: "Mumbai", lon: 72.88, lat: 19.08, pop: 21.3 },
  { name: "Beijing", lon: 116.41, lat: 39.9, pop: 20.9 },
  { name: "Osaka", lon: 135.5, lat: 34.69, pop: 19.1 },
  { name: "New York", lon: -74.01, lat: 40.71, pop: 18.8 },
  { name: "Karachi", lon: 67.01, lat: 24.86, pop: 16.8 },
  { name: "Chongqing", lon: 106.55, lat: 29.56, pop: 16.4 },
  { name: "Kinshasa", lon: 15.27, lat: -4.44, pop: 15.6 },
  { name: "Istanbul", lon: 28.98, lat: 41.01, pop: 15.5 },
  { name: "Lagos", lon: 3.38, lat: 6.52, pop: 15.4 },
  { name: "Kolkata", lon: 88.36, lat: 22.57, pop: 15.1 },
  { name: "Manila", lon: 120.98, lat: 14.6, pop: 14.4 },
  { name: "Rio de Janeiro", lon: -43.17, lat: -22.91, pop: 13.5 },
  { name: "Moscow", lon: 37.62, lat: 55.76, pop: 12.6 },
  { name: "Los Angeles", lon: -118.24, lat: 34.05, pop: 12.4 },
  { name: "Jakarta", lon: 106.85, lat: -6.21, pop: 10.9 },
  { name: "Paris", lon: 2.35, lat: 48.85, pop: 11.1 },
  { name: "London", lon: -0.13, lat: 51.51, pop: 9.5 },
].sort((a, b) => b.pop - a.pop); // largest first — small bubbles draw on top

// --- Simplified world landmasses (hand-simplified coastlines, lon/lat rings) ---
// d3-geo always clips against the antimeridian, which depends on the right-hand
// winding rule — normalize each hand-authored ring via its signed geoArea rather
// than trust hand-derived orientation (a flipped ring fills "everything but the
// shape", ~4π−area, instead of the shape itself).
const poly = (ring) => {
  const f = { type: "Feature", geometry: { type: "Polygon", coordinates: [ring] } };
  return d3.geoArea(f) > 2 * Math.PI
    ? { type: "Feature", geometry: { type: "Polygon", coordinates: [ring.slice().reverse()] } }
    : f;
};

// Insert extra vertices (with a small deterministic perpendicular bulge) along
// long, dead-straight edges so the hand-simplified rings read as coastal
// curves instead of faceted polygon edges — no RNG, stays reproducible.
const densify = (ring) =>
  ring.slice(0, -1).flatMap(([x0, y0], i) => {
    const [x1, y1] = ring[i + 1];
    const dist = Math.hypot(x1 - x0, y1 - y0);
    const extra = dist > 14 ? 3 : dist > 7 ? 1 : 0;
    const points = [[x0, y0]];
    for (let s = 1; s <= extra; s++) {
      const f = s / (extra + 1);
      const bulge = Math.sin(f * Math.PI) * (dist > 14 ? 1.1 : 0.6);
      points.push([
        x0 + (x1 - x0) * f - ((y1 - y0) / dist) * bulge,
        y0 + (y1 - y0) * f + ((x1 - x0) / dist) * bulge,
      ]);
    }
    return points;
  }).concat([ring[ring.length - 1]]);

const NORTH_AMERICA = [
  [-168, 66], [-155, 59], [-135, 58], [-125, 48], [-117, 32], [-105, 20],
  [-97, 16], [-90, 14], [-83, 9], [-77, 8], [-80, 25], [-75, 35],
  [-70, 42], [-60, 47], [-55, 52], [-65, 58], [-80, 66], [-100, 71],
  [-125, 70], [-140, 70], [-155, 71], [-168, 66],
];

const SOUTH_AMERICA = [
  [-77, 8], [-72, -3], [-80, -6], [-81, -15], [-75, -20], [-70, -30],
  [-71, -40], [-73, -50], [-68, -55], [-63, -52], [-57, -35], [-48, -25],
  [-40, -13], [-35, -7], [-42, 2], [-52, 6], [-60, 9], [-70, 10], [-77, 8],
];

const EURASIA = [
  [-9, 43], [-9, 38], [-6, 36], [0, 38], [3, 42], [-1, 45], [-4, 48], [1, 50],
  [6, 51], [9, 54], [10, 58], [20, 70], [35, 70], [45, 68], [60, 68], [75, 72],
  [90, 73], [110, 73], [130, 72], [145, 68], [160, 62], [170, 65], [178, 64],
  [170, 55], [155, 50], [142, 44], [130, 38], [122, 31], [112, 22], [105, 10],
  [98, 8], [92, 20], [80, 18], [72, 20], [68, 25], [56, 26], [50, 30],
  [45, 32], [35, 32], [28, 37], [15, 40], [2, 41], [-9, 43],
];

const AFRICA = [
  [-17, 15], [-16, 12], [-10, 10], [-5, 5], [0, 6], [6, 5], [9, -2],
  [13, -6], [12, -13], [12, -18], [16, -23], [20, -30], [25, -34],
  [32, -25], [35, -18], [40, -12], [43, -2], [44, 4], [45, 10],
  [43, 12], [38, 15], [35, 20], [32, 25], [30, 31], [10, 37],
  [-6, 35], [-15, 25], [-17, 20], [-17, 15],
];

const AUSTRALIA = [
  [113, -22], [114, -28], [117, -33], [122, -34], [129, -31], [136, -35],
  [142, -38], [148, -37], [153, -28], [150, -22], [145, -16], [137, -12],
  [130, -12], [122, -17], [113, -22],
];

const JAPAN = [
  [130, 32], [132, 34], [136, 35], [139, 36], [141, 39], [141, 42],
  [138, 40], [135, 35], [132, 34], [130, 32],
];

const PHILIPPINES = [
  [120, 6], [122, 9], [124, 13], [122, 17], [120, 14], [119, 10], [120, 6],
];

const INDONESIA = [
  [95, 3], [98, -1], [104, -6], [110, -8], [116, -6], [119, -2],
  [117, 2], [110, 1], [104, -1], [98, 2], [95, 3],
];

const BRITISH_ISLES = [
  [-6, 50], [-5, 52], [-4, 55], [-2, 58], [0, 55], [-1, 52], [-3, 50], [-6, 50],
];

const landFeatures = [
  NORTH_AMERICA, SOUTH_AMERICA, EURASIA, AFRICA, AUSTRALIA,
  JAPAN, PHILIPPINES, INDONESIA, BRITISH_ISLES,
].map((ring) => poly(densify(ring)));

const mapBounds = {
  type: "Polygon",
  coordinates: [[[-175, -58], [178, -58], [178, 80], [-175, 80], [-175, -58]]],
};

// --- Layout ------------------------------------------------------------
const marginTop = 150;
const marginBottom = 50;
const marginLeft = 60;
const marginRight = 60;
const mapX0 = marginLeft;
const mapY0 = marginTop;
const mapX1 = width - marginRight;
const mapY1 = height - marginBottom;

const projection = d3.geoEqualEarth();
const path = d3.geoPath(projection);
projection.fitExtent([[mapX0, mapY0], [mapX1, mapY1]], mapBounds);

// --- SVG mount -----------------------------------------------------------
const svg = d3.select("#container").append("svg").attr("width", width).attr("height", height);

// Ocean — the mount background already matches PAGE_BG, an explicit sphere
// keeps the map panel visually bounded without painting over it
svg
  .append("path")
  .datum({ type: "Sphere" })
  .attr("d", path)
  .attr("fill", "none");

// Landmasses — neutral fill, not a data-driven color
svg
  .selectAll("path.land")
  .data(landFeatures)
  .join("path")
  .attr("class", "land")
  .attr("d", path)
  .attr("fill", MUTED)
  .attr("fill-opacity", 0.4)
  .attr("stroke", t.inkSoft)
  .attr("stroke-width", 0.6)
  .attr("stroke-opacity", 0.5);

// --- Size scale — bubble AREA (not radius) proportional to population -----
const maxPop = d3.max(cities, (d) => d.pop);
const radius = d3.scaleSqrt().domain([0, maxPop]).range([6, 34]);

// Tooltip — real hover, only live in the exported interactive HTML
const tooltip = d3
  .select("#container")
  .append("div")
  .style("position", "fixed")
  .style("pointer-events", "none")
  .style("opacity", 0)
  .style("background", t.elevatedBg)
  .style("color", t.ink)
  .style("border", `1px solid ${t.grid}`)
  .style("border-radius", "6px")
  .style("padding", "8px 10px")
  .style("font-size", "13px")
  .style("font-family", "sans-serif")
  .style("line-height", "1.5")
  .style("box-shadow", "0 2px 8px rgba(0,0,0,0.25)")
  .style("transition", "opacity 0.1s linear");

// Bubbles — population by metro area, alpha handles the overlap in dense
// regions (South/East Asia)
svg
  .selectAll("circle.bubble")
  .data(cities)
  .join("circle")
  .attr("class", "bubble")
  .attr("cx", (d) => projection([d.lon, d.lat])[0])
  .attr("cy", (d) => projection([d.lon, d.lat])[1])
  .attr("r", (d) => radius(d.pop))
  .attr("fill", BRAND)
  .attr("fill-opacity", 0.6)
  .attr("stroke", t.pageBg)
  .attr("stroke-width", 1.2)
  .style("cursor", "pointer")
  .on("mouseenter", function () {
    d3.select(this).attr("stroke", t.ink).attr("stroke-width", 2);
    tooltip.style("opacity", 1);
  })
  .on("mousemove", (event, d) => {
    tooltip
      .style("left", `${event.clientX + 16}px`)
      .style("top", `${event.clientY + 16}px`)
      .html(
        `<strong>${d.name}</strong><br>` +
          `Population: ${d.pop.toFixed(1)}M<br>` +
          `${d.lat.toFixed(2)}°, ${d.lon.toFixed(2)}°`,
      );
  })
  .on("mouseleave", function () {
    d3.select(this).attr("stroke", t.pageBg).attr("stroke-width", 1.2);
    tooltip.style("opacity", 0);
  });

// --- Size legend — inset panel over open ocean -----------------------------
// Bottom-right (mapX1-20, mapY1-20 corner) sits on top of Australia in this
// projection/fitExtent; the empty Pacific strip left of North America
// (x < ~300 at this canvas size) is verified clear of every landmass and
// bubble, so the panel is anchored there instead.
const legendW = 210;
const legendH = 160;
const legendX = mapX0 + 20;
const legendY = mapY1 - legendH - 20;
// Top reference value must be >= the largest bubble's population (37.4M)
// so the legend never under-represents the largest marker on the map.
const legendValues = [10, 20, 40];
const legendMaxR = radius(d3.max(legendValues));

const legendG = svg.append("g").attr("transform", `translate(${legendX},${legendY})`);
legendG
  .append("rect")
  .attr("width", legendW)
  .attr("height", legendH)
  .attr("rx", 8)
  .attr("fill", t.elevatedBg)
  .attr("stroke", t.grid)
  .attr("stroke-width", 1)
  .attr("opacity", 0.95);

legendG
  .append("text")
  .attr("x", legendW / 2)
  .attr("y", 26)
  .attr("text-anchor", "middle")
  .attr("fill", t.ink)
  .style("font-size", "14px")
  .style("font-weight", "600")
  .text("Population (millions)");

const legendCx = 40;
const legendBaseline = legendH - 16;
legendValues.forEach((v) => {
  const r = radius(v);
  const cy = legendBaseline - r;
  legendG
    .append("circle")
    .attr("cx", legendCx)
    .attr("cy", cy)
    .attr("r", r)
    .attr("fill", "none")
    .attr("stroke", t.inkSoft)
    .attr("stroke-width", 1.2);
  legendG
    .append("line")
    .attr("x1", legendCx)
    .attr("y1", cy - r)
    .attr("x2", legendCx + legendMaxR + 30)
    .attr("y2", cy - r)
    .attr("stroke", t.grid)
    .attr("stroke-width", 1);
  legendG
    .append("text")
    .attr("x", legendCx + legendMaxR + 36)
    .attr("y", cy - r + 4)
    .attr("fill", t.inkSoft)
    .style("font-size", "12px")
    .text(`${v}M`);
});

// --- Title + subtitle --------------------------------------------------
const titleStr = "World Megacities by Population · bubble-map-geographic · javascript · d3 · anyplot.ai";
const titleSize = Math.max(14, Math.round(22 * Math.min(1, 67 / titleStr.length)));

svg
  .append("text")
  .attr("x", width / 2)
  .attr("y", 46)
  .attr("text-anchor", "middle")
  .attr("fill", t.ink)
  .style("font-size", `${titleSize}px`)
  .style("font-weight", "600")
  .text(titleStr);

svg
  .append("text")
  .attr("x", width / 2)
  .attr("y", 76)
  .attr("text-anchor", "middle")
  .attr("fill", t.inkSoft)
  .style("font-size", "14px")
  .text("Bubble area ∝ metro-area population · fewer, larger markers avoid overplotting");
Runnable source as JSON, for any HTTP client: https://api.anyplot.ai/specs/bubble-map-geographic/d3/code. Any spec id and library id listed in llms-full.txt fit the same URL shape; every URL below is complete and callable.
{
  "spec_id": "bubble-map-geographic",
  "language": "javascript",
  "library": "d3",
  "page": "https://anyplot.ai/bubble-map-geographic/javascript/d3",
  "hub": "https://anyplot.ai/bubble-map-geographic",
  "code_json": "https://api.anyplot.ai/specs/bubble-map-geographic/d3/code",
  "spec_json": "https://api.anyplot.ai/specs/bubble-map-geographic",
  "render_light_png": "https://storage.googleapis.com/anyplot-images/plots/bubble-map-geographic/javascript/d3/plot-light.png",
  "render_dark_png": "https://storage.googleapis.com/anyplot-images/plots/bubble-map-geographic/javascript/d3/plot-dark.png",
  "interactive_light_html": "https://storage.googleapis.com/anyplot-images/plots/bubble-map-geographic/javascript/d3/plot-light.html",
  "interactive_dark_html": "https://storage.googleapis.com/anyplot-images/plots/bubble-map-geographic/javascript/d3/plot-dark.html",
  "quality_score": 92.0,
  "license": "MIT",
  "guide": "https://anyplot.ai/llms.txt"
}
Part of Bubble Map with Sized Geographic Markers on anyplot.ai.