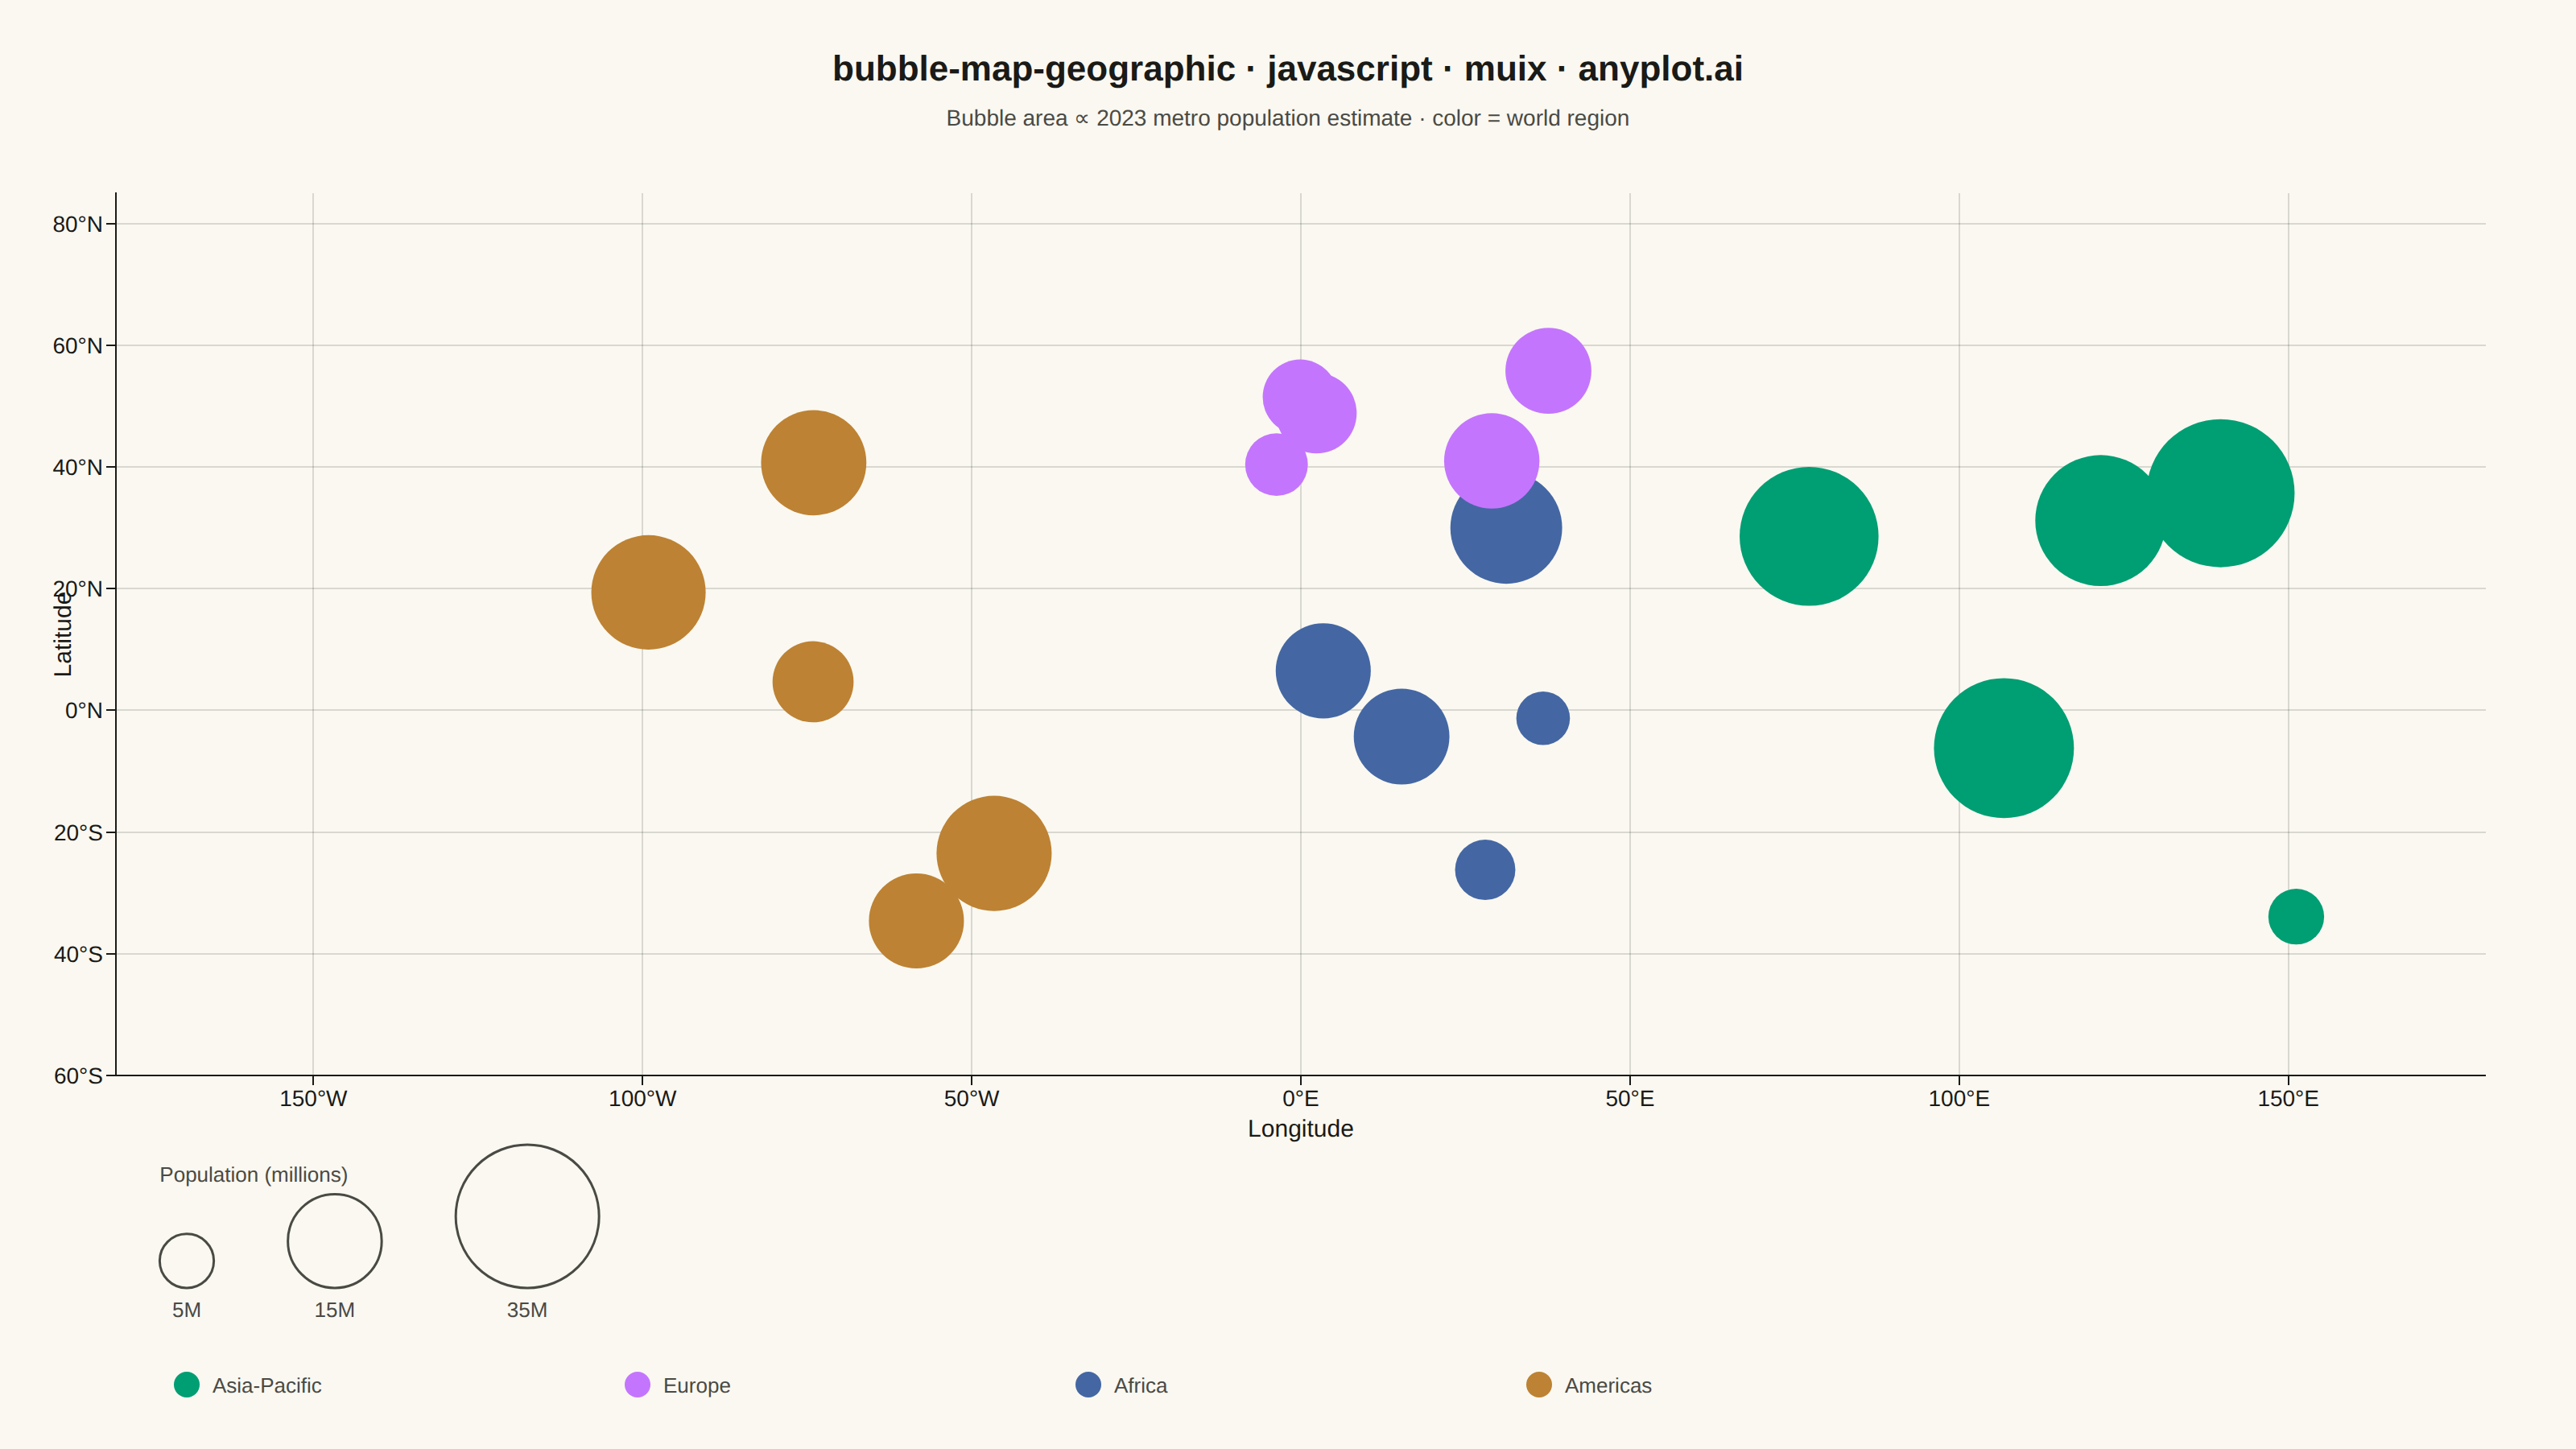
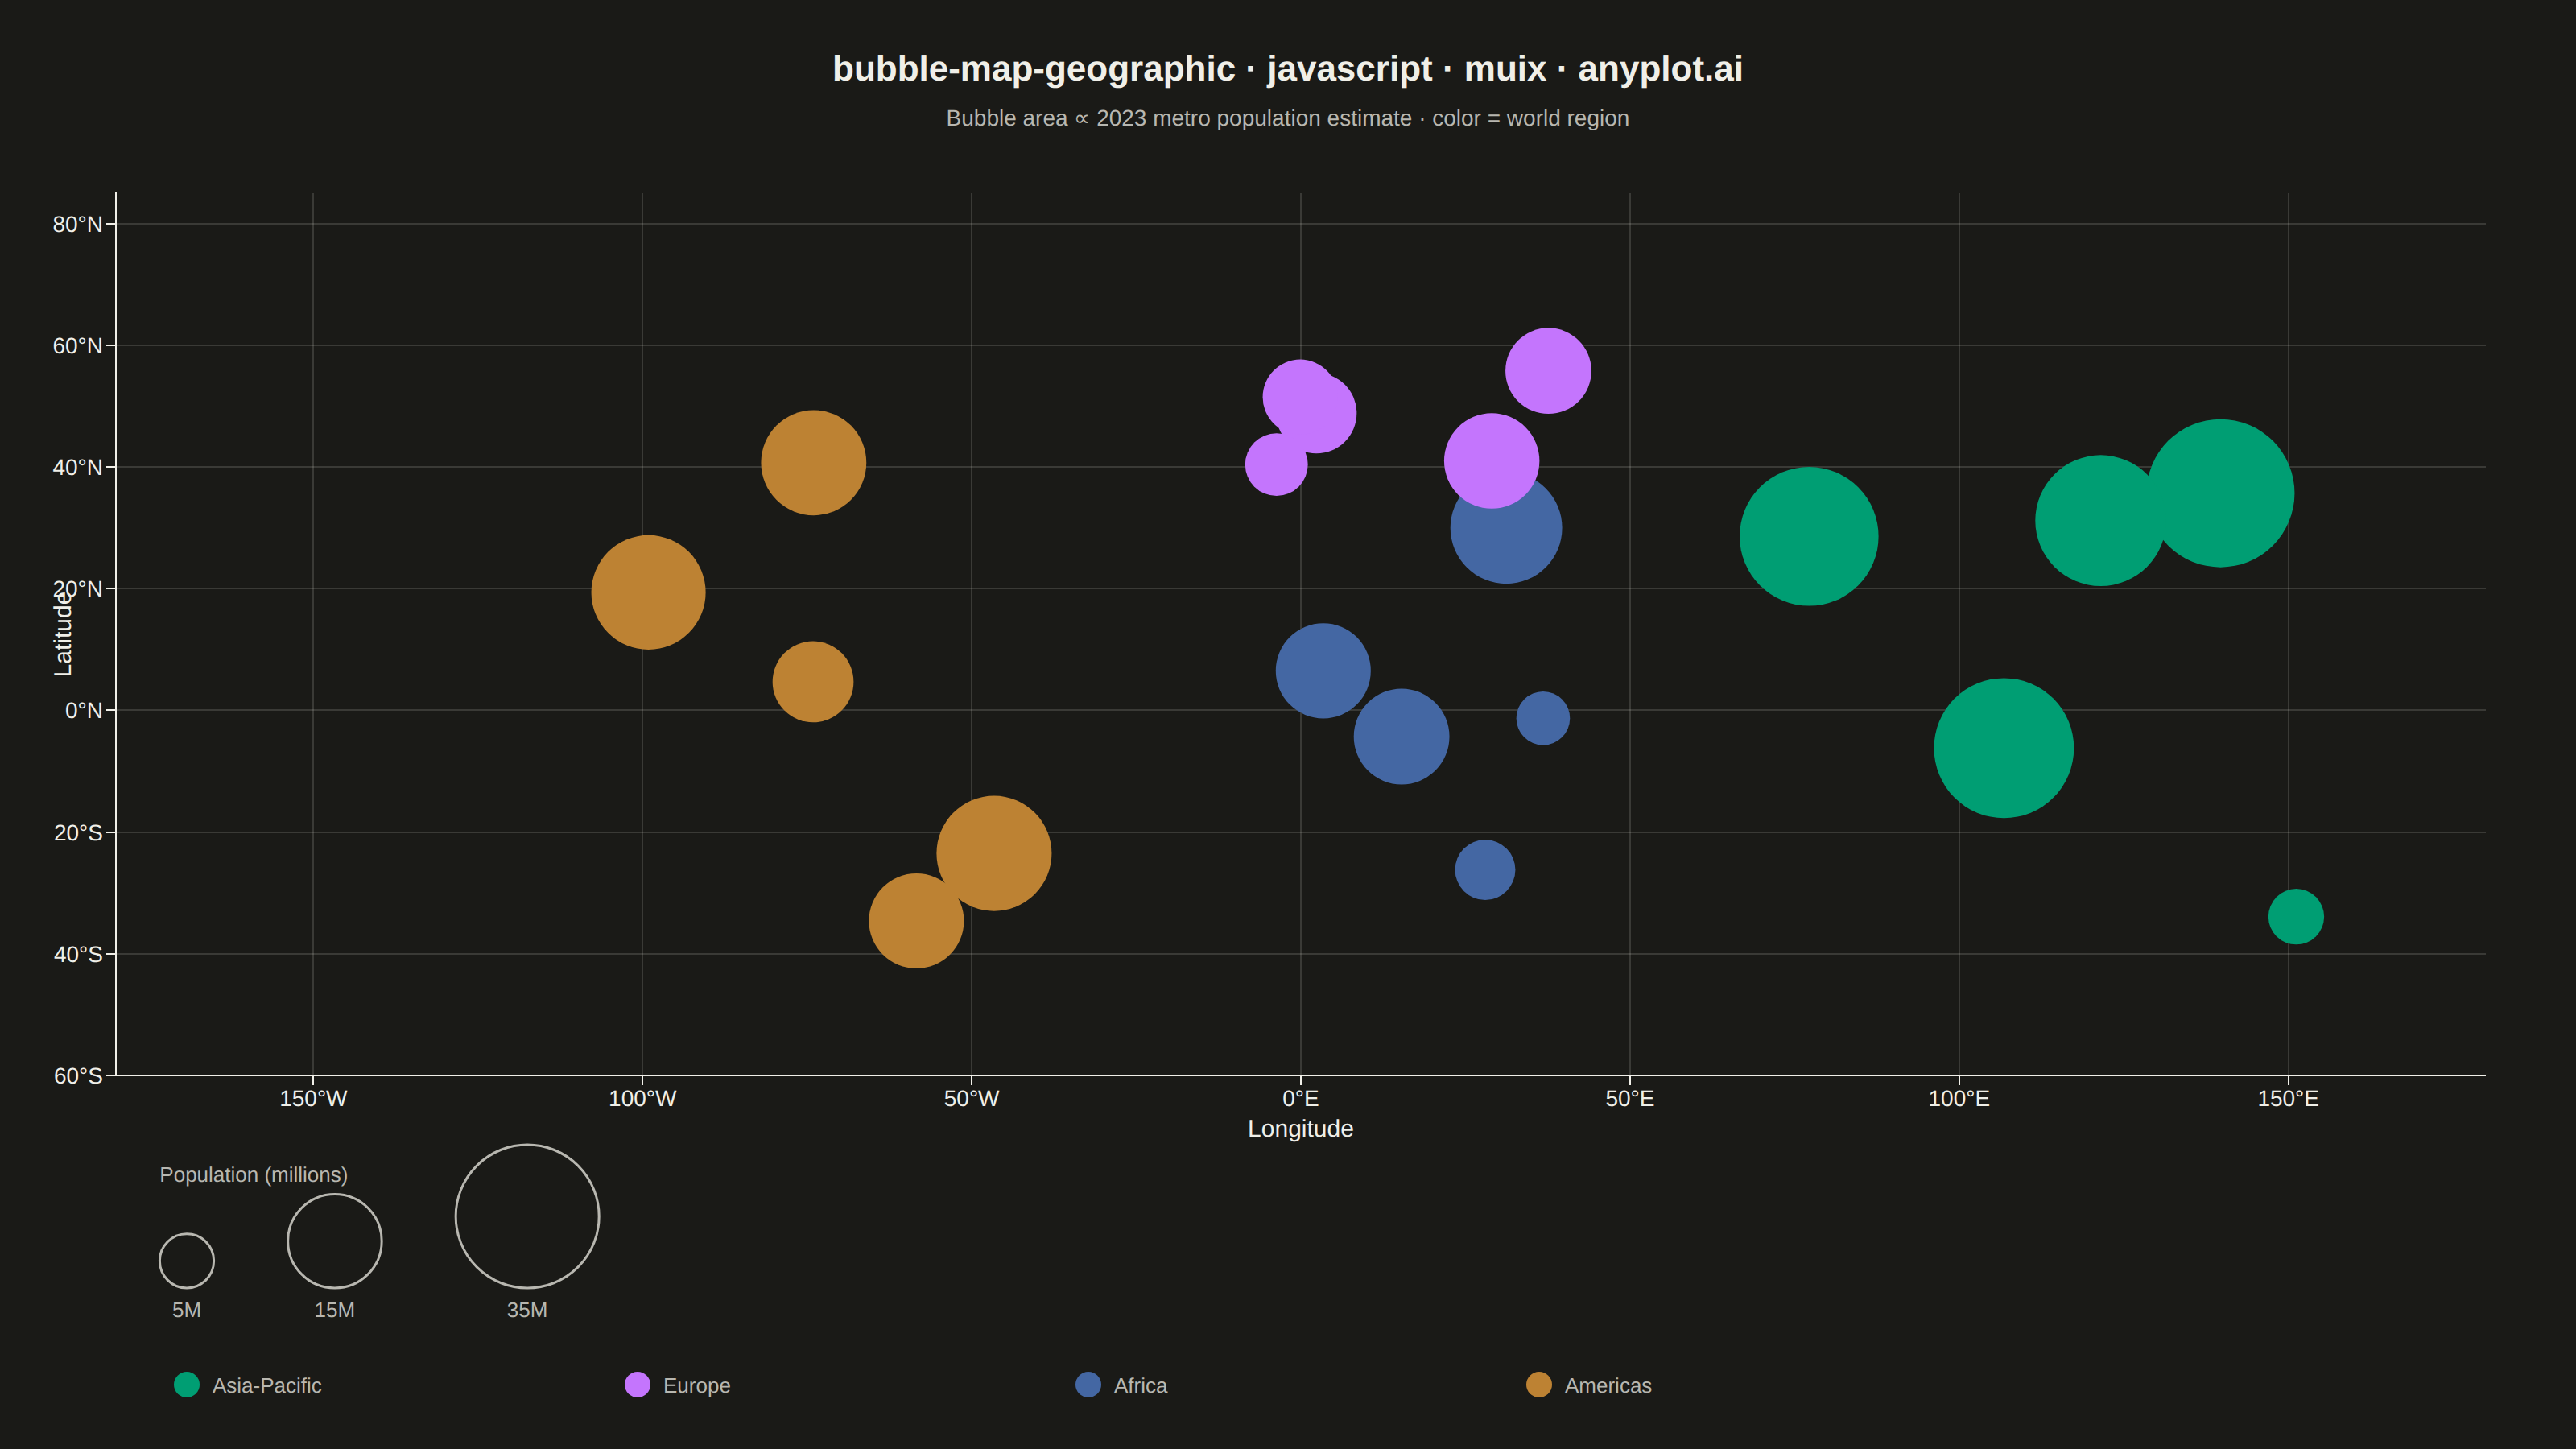
The same plot in 14 other libraries — JavaScript: Chart.js, D3.js, Apache ECharts, Highcharts; Python: Altair, Bokeh, lets-plot, Matplotlib, Plotly, plotnine, Pygal, Seaborn; R: ggplot2; Julia: Makie.jl. Compare all 15 side by side: Bubble Map with Sized Geographic Markers in Python, R, Julia and JavaScript.
A geographic bubble map where markers are sized proportionally to quantitative data values at each location. Unlike scatter maps where size is optional, bubble maps use marker size as the primary visual encoding to show data magnitude across geographic regions. This visualization makes it immediately apparent where high and low values occur spatially, enabling intuitive comparison of quantities across locations.
// anyplot.ai
// bubble-map-geographic: Bubble Map with Sized Geographic Markers
// Library: muix 7.29.1 | JavaScript 22.23.2
// Quality: 84/100 | Created: 2026-09-01
import { ScatterChart } from "@mui/x-charts/ScatterChart";

const t = window.ANYPLOT_TOKENS;

// --- Data: approximate 2023 metro-area population (millions) for 20 major
// world cities, plotted at each city's longitude/latitude. The community
// @mui/x-charts surface has no polygon/coastline basemap primitive, so the
// geographic context comes from a longitude/latitude graticule (grid) and
// degree-formatted axes instead of drawn country borders. -------------------
const REGIONS = ["Asia-Pacific", "Europe", "Africa", "Americas"];

const cities = [
  { name: "Tokyo", lon: 139.7, lat: 35.7, population: 37.4, region: "Asia-Pacific" },
  { name: "Delhi", lon: 77.2, lat: 28.6, population: 32.9, region: "Asia-Pacific" },
  { name: "Shanghai", lon: 121.5, lat: 31.2, population: 29.2, region: "Asia-Pacific" },
  { name: "Jakarta", lon: 106.8, lat: -6.2, population: 33.4, region: "Asia-Pacific" },
  { name: "Sydney", lon: 151.2, lat: -33.9, population: 5.3, region: "Asia-Pacific" },
  { name: "Moscow", lon: 37.6, lat: 55.8, population: 12.6, region: "Europe" },
  { name: "Istanbul", lon: 29.0, lat: 41.0, population: 15.5, region: "Europe" },
  { name: "Paris", lon: 2.35, lat: 48.85, population: 11.1, region: "Europe" },
  { name: "London", lon: -0.1, lat: 51.5, population: 9.6, region: "Europe" },
  { name: "Madrid", lon: -3.7, lat: 40.4, population: 6.7, region: "Europe" },
  { name: "Cairo", lon: 31.2, lat: 30.0, population: 21.3, region: "Africa" },
  { name: "Kinshasa", lon: 15.3, lat: -4.3, population: 15.6, region: "Africa" },
  { name: "Lagos", lon: 3.4, lat: 6.5, population: 15.4, region: "Africa" },
  { name: "Johannesburg", lon: 28.0, lat: -26.2, population: 6.2, region: "Africa" },
  { name: "Nairobi", lon: 36.8, lat: -1.3, population: 4.9, region: "Africa" },
  { name: "Sao Paulo", lon: -46.6, lat: -23.5, population: 22.6, region: "Americas" },
  { name: "Mexico City", lon: -99.1, lat: 19.4, population: 22.3, region: "Americas" },
  { name: "New York", lon: -74.0, lat: 40.7, population: 18.9, region: "Americas" },
  { name: "Buenos Aires", lon: -58.4, lat: -34.6, population: 15.4, region: "Americas" },
  { name: "Bogota", lon: -74.1, lat: 4.7, population: 11.2, region: "Americas" },
];

// --- Radius scale: circle AREA (not radius) carries the population value,
// anchored at zero so proportions stay accurate; a floor keeps small cities
// visible (spec: "minimum bubble size to ensure small values remain visible").
const MIN_RADIUS = 9;
const MAX_RADIUS = 46;
const maxPopulation = Math.max(...cities.map((c) => c.population));
const radiusFor = (population) =>
  Math.max(MIN_RADIUS, MAX_RADIUS * Math.sqrt(population / maxPopulation));

// Secondary encoding: world region, from the Imprint categorical palette.
// Solid (non-alpha) fill: an alpha-hex fill composites against the page
// background, which differs between themes (#FAF8F1 vs #1A1A17), so the same
// alpha value renders as a visibly different hue per theme — a violation of
// the Imprint contract that data colors stay identical across themes. Overlap
// legibility in dense clusters instead comes from the largest-first draw
// order below (smaller circles stay uncovered on top of larger ones).
const regionColor = (region) => t.palette[REGIONS.indexOf(region)];

const lonLabel = (v) => `${Math.round(Math.abs(v))}°${v < 0 ? "W" : "E"}`;
const latLabel = (v) => `${Math.round(Math.abs(v))}°${v < 0 ? "S" : "N"}`;

// One series per city (MUI X community scatter sizes markers per-series, not
// per-point) — largest population first, so smaller circles draw on top and
// stay visible instead of being covered by their bigger neighbors.
const series = [...cities]
  .sort((a, b) => b.population - a.population)
  .map((c) => ({
    id: c.name,
    label: `${c.name} (${c.region})`,
    data: [{ x: c.lon, y: c.lat, id: c.name }],
    markerSize: radiusFor(c.population),
    color: regionColor(c.region),
    valueFormatter: () =>
      `${c.name} — ${c.population.toFixed(1)}M residents · ${latLabel(c.lat)}, ${lonLabel(c.lon)}`,
  }));

const title = "bubble-map-geographic · javascript · muix · anyplot.ai";
const titleFontSize = Math.max(16, Math.round(22 * Math.min(1, 67 / title.length)));

// Size legend: three reference populations anchor the sqrt-area scale,
// aligned along a shared baseline so the circles read left-to-right.
const legendPopulations = [5, 15, 35];
const legendRadii = legendPopulations.map(radiusFor);
const legendBaselineY = 800;
let legendCx = 116;
const legendCenters = legendRadii.map((r, i) => {
  if (i > 0) legendCx += legendRadii[i - 1] + 46 + r;
  return legendCx;
});

// --- Chart (default-exported component — the harness mounts it) -----------
export default function Chart() {
  const { width, height } = window.ANYPLOT_SIZE;

  return (
    <ScatterChart
      width={width}
      height={height}
      series={series}
      margin={{ top: 120, right: 56, bottom: 232, left: 72 }}
      xAxis={[
        {
          scaleType: "linear",
          min: -180,
          max: 180,
          tickNumber: 7,
          valueFormatter: lonLabel,
          label: "Longitude",
          labelStyle: { fontSize: 15 },
          tickLabelStyle: { fontSize: 14 },
        },
      ]}
      yAxis={[
        {
          scaleType: "linear",
          min: -60,
          max: 85,
          tickNumber: 6,
          valueFormatter: latLabel,
          label: "Latitude",
          labelStyle: { fontSize: 15 },
          tickLabelStyle: { fontSize: 14 },
        },
      ]}
      grid={{ horizontal: true, vertical: true }}
      legend={{ hidden: true }}
      skipAnimation
    >
      <text
        x={width / 2}
        y={50}
        textAnchor="middle"
        fontSize={titleFontSize}
        fontWeight={600}
        fill={t.ink}
      >
        {title}
      </text>
      <text x={width / 2} y={78} textAnchor="middle" fontSize={14} fill={t.inkSoft}>
        Bubble area ∝ 2023 metro population estimate · color = world region
      </text>

      {/* Size legend: reference circles anchor the population-to-area scale */}
      <text
        x={legendCenters[0] - legendRadii[0]}
        y={legendBaselineY - MAX_RADIUS - 20}
        fontSize={13}
        fill={t.inkSoft}
      >
        Population (millions)
      </text>
      {legendPopulations.map((pop, i) => (
        <g key={pop}>
          <circle
            cx={legendCenters[i]}
            cy={legendBaselineY - legendRadii[i]}
            r={legendRadii[i]}
            fill="none"
            stroke={t.inkSoft}
            strokeWidth={1.5}
          />
          <text
            x={legendCenters[i]}
            y={legendBaselineY + 18}
            textAnchor="middle"
            fontSize={13}
            fill={t.inkSoft}
          >
            {pop}M
          </text>
        </g>
      ))}

      {/* Color legend: one swatch per world region */}
      {REGIONS.map((region, i) => (
        <g key={region}>
          <circle cx={116 + i * 280} cy={860} r={8} fill={t.palette[i]} />
          <text x={116 + i * 280 + 16} y={865} fontSize={13} fill={t.inkSoft}>
            {region}
          </text>
        </g>
      ))}
    </ScatterChart>
  );
}
Runnable source as JSON, for any HTTP client: https://api.anyplot.ai/specs/bubble-map-geographic/muix/code. Any spec id and library id listed in llms-full.txt fit the same URL shape; every URL below is complete and callable.
{
  "spec_id": "bubble-map-geographic",
  "language": "javascript",
  "library": "muix",
  "page": "https://anyplot.ai/bubble-map-geographic/javascript/muix",
  "hub": "https://anyplot.ai/bubble-map-geographic",
  "code_json": "https://api.anyplot.ai/specs/bubble-map-geographic/muix/code",
  "spec_json": "https://api.anyplot.ai/specs/bubble-map-geographic",
  "render_light_png": "https://storage.googleapis.com/anyplot-images/plots/bubble-map-geographic/javascript/muix/plot-light.png",
  "render_dark_png": "https://storage.googleapis.com/anyplot-images/plots/bubble-map-geographic/javascript/muix/plot-dark.png",
  "interactive_light_html": "https://storage.googleapis.com/anyplot-images/plots/bubble-map-geographic/javascript/muix/plot-light.html",
  "interactive_dark_html": "https://storage.googleapis.com/anyplot-images/plots/bubble-map-geographic/javascript/muix/plot-dark.html",
  "quality_score": 84.0,
  "license": "MIT",
  "guide": "https://anyplot.ai/llms.txt"
}
Part of Bubble Map with Sized Geographic Markers on anyplot.ai.