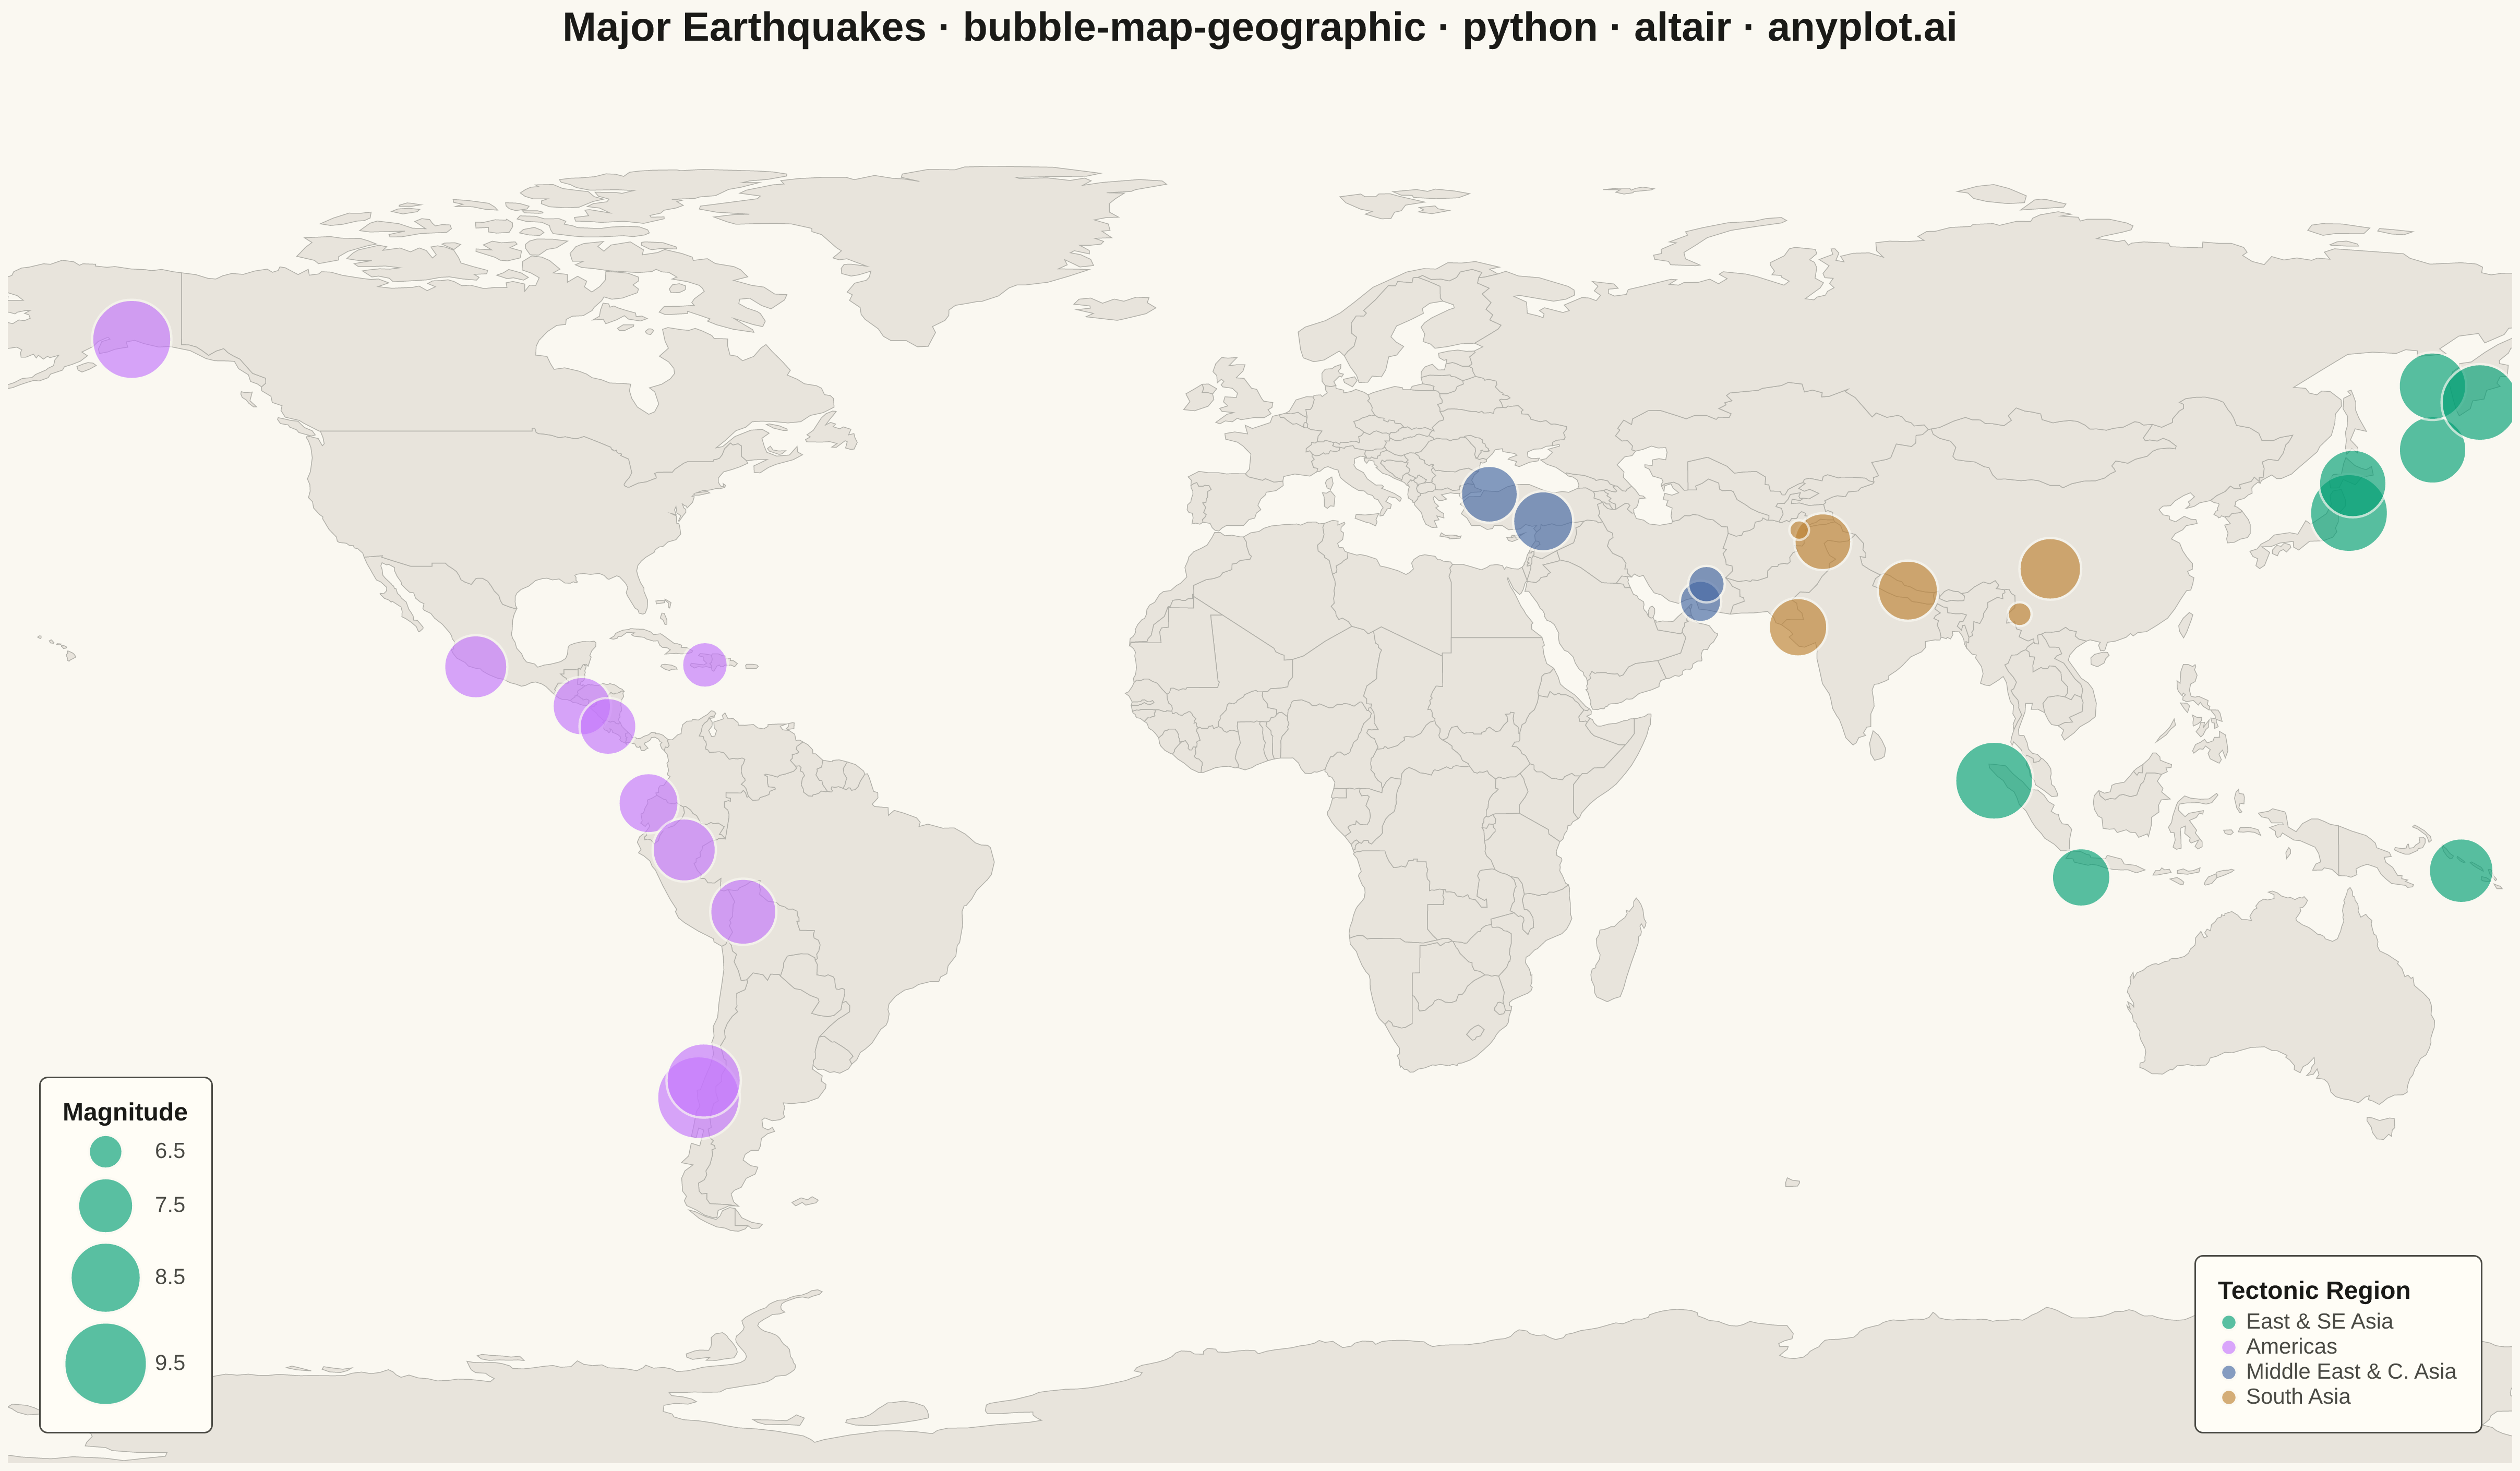
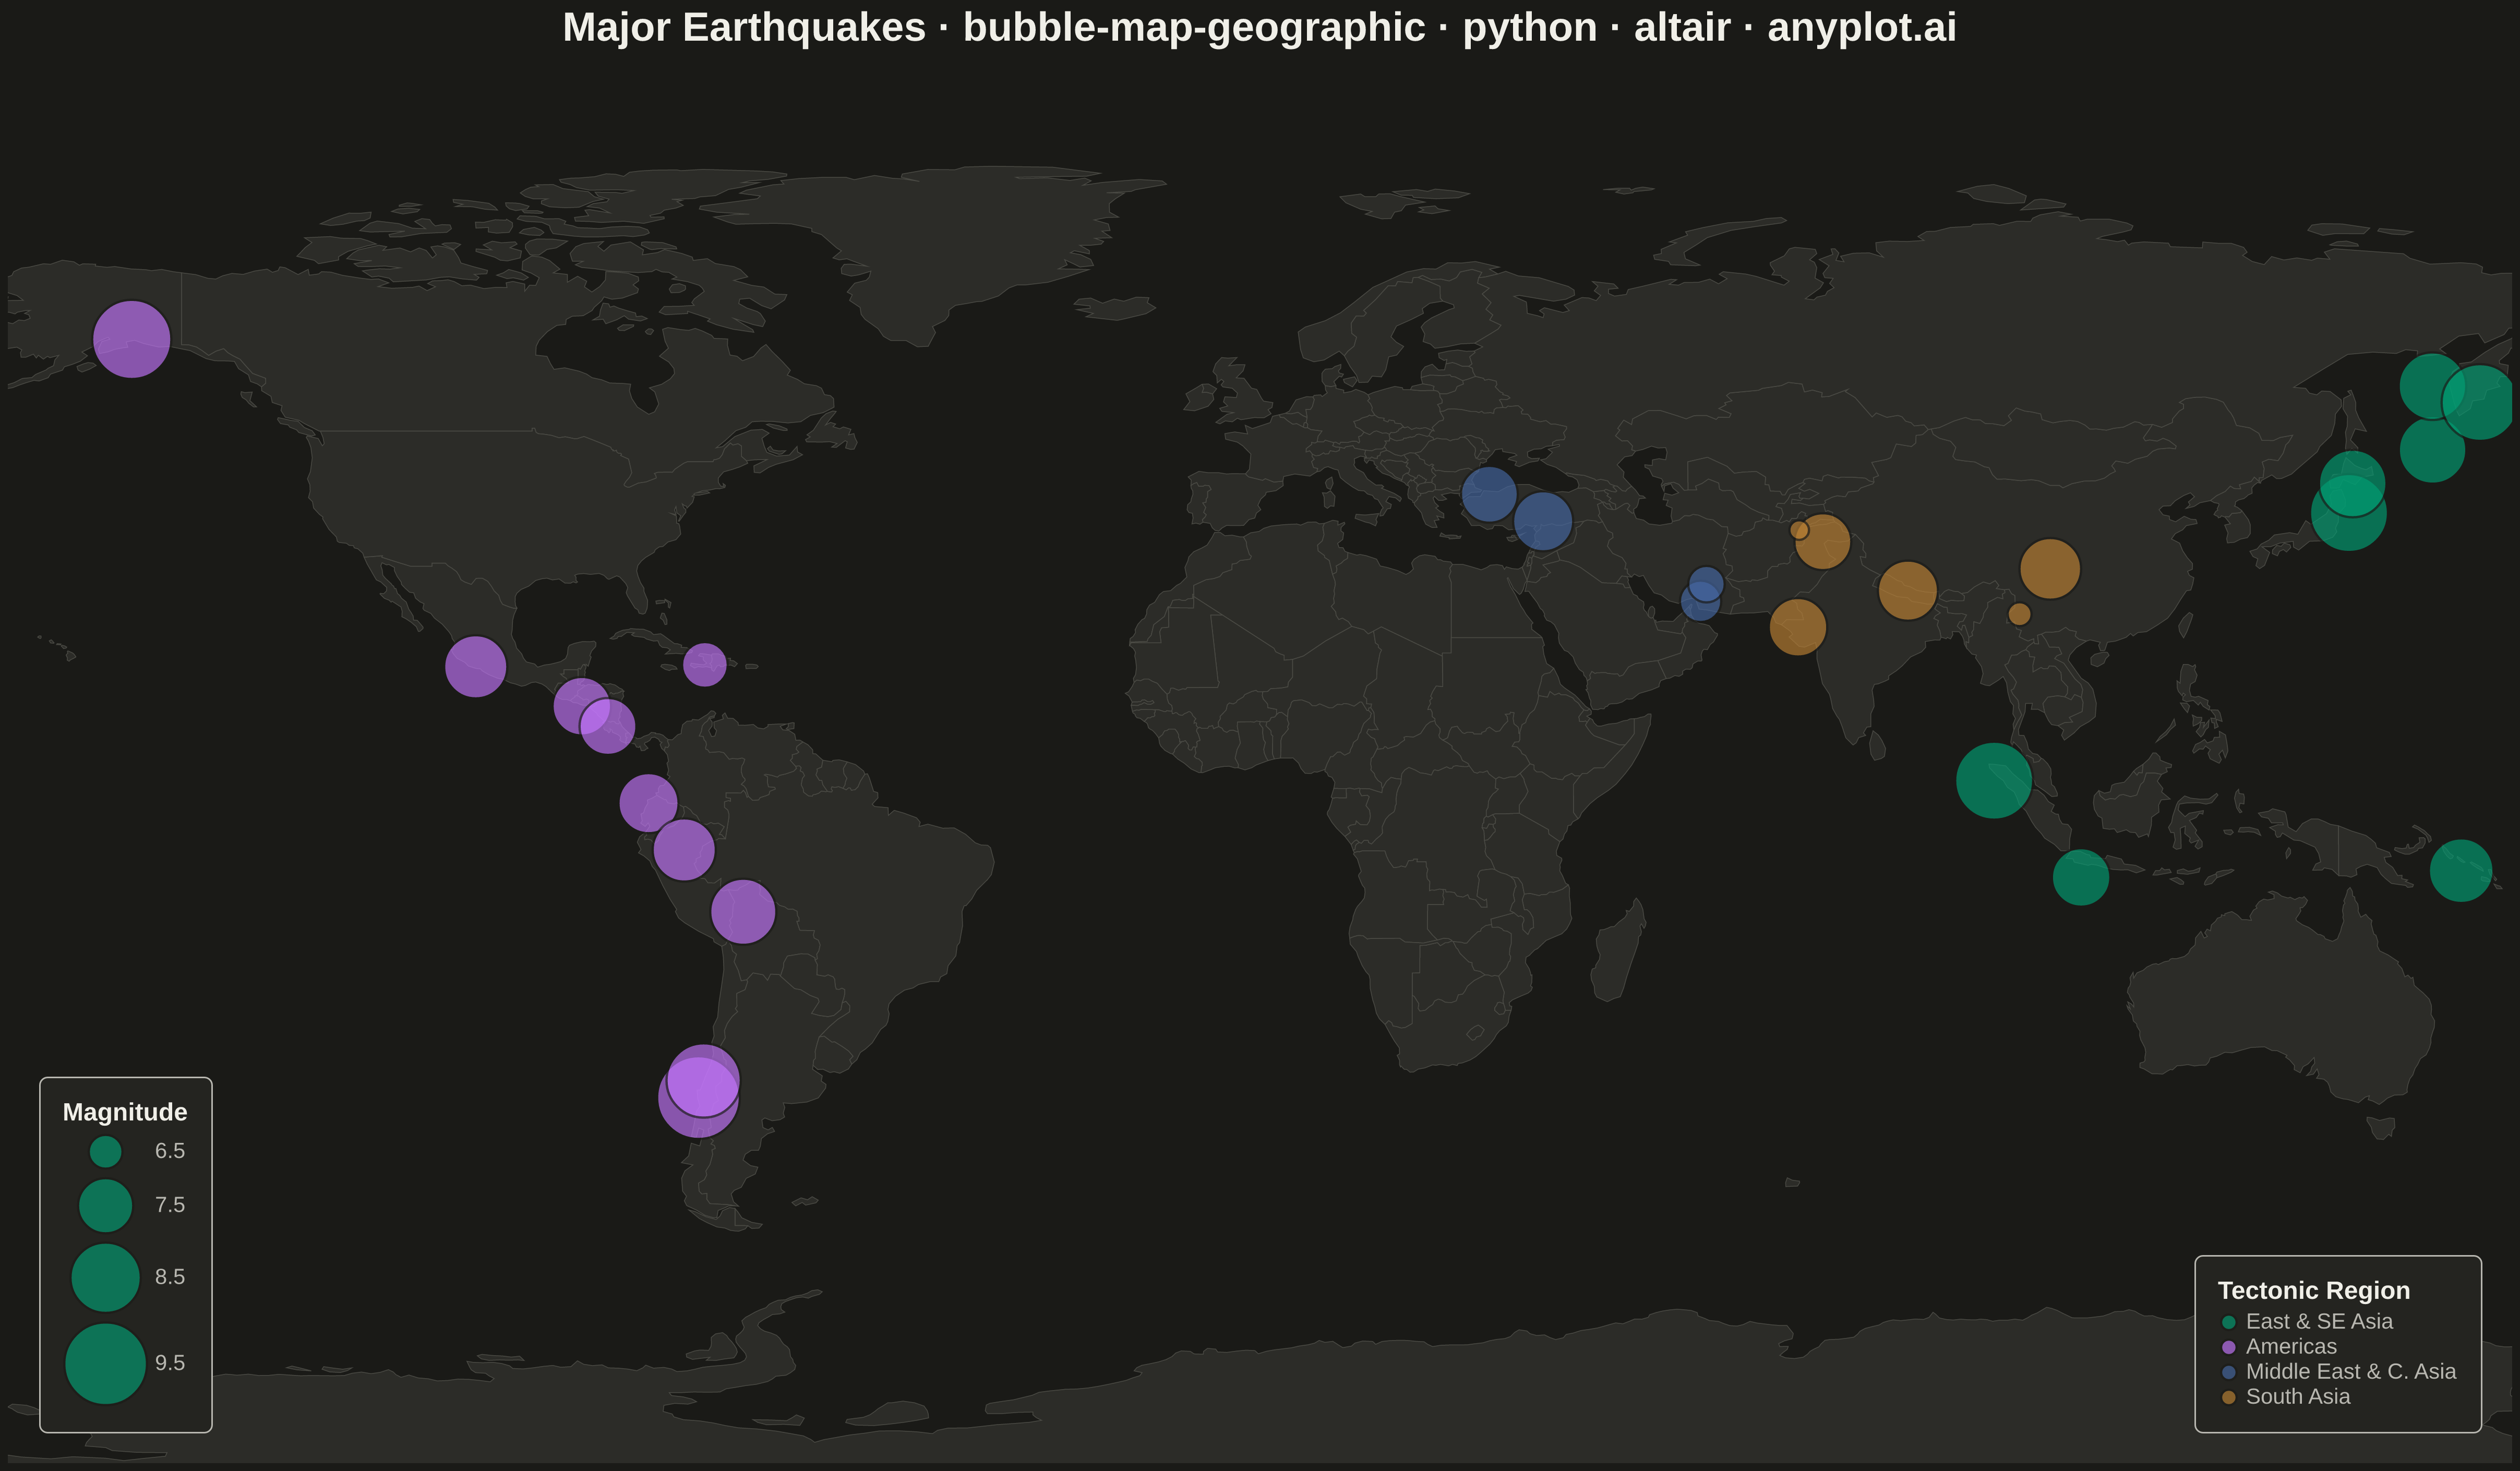
A geographic bubble map where markers are sized proportionally to quantitative data values at each location. Unlike scatter maps where size is optional, bubble maps use marker size as the primary visual encoding to show data magnitude across geographic regions. This visualization makes it immediately apparent where high and low values occur spatially, enabling intuitive comparison of quantities across locations.
""" anyplot.ai
bubble-map-geographic: Bubble Map with Sized Geographic Markers
Library: altair 6.1.0 | Python 3.13.13
Quality: 91/100 | Updated: 2026-05-18
"""

import os
import sys

import pandas as pd


# Work around filename shadowing the altair library
sys.path.pop(0)
import altair as alt


# Theme tokens
THEME = os.getenv("ANYPLOT_THEME", "light")
PAGE_BG = "#FAF8F1" if THEME == "light" else "#1A1A17"
ELEVATED_BG = "#FFFDF6" if THEME == "light" else "#242420"
INK = "#1A1A17" if THEME == "light" else "#F0EFE8"
INK_SOFT = "#4A4A44" if THEME == "light" else "#B8B7B0"
LAND_FILL = "#E8E4DC" if THEME == "light" else "#2C2C28"
LAND_STROKE = "#B0AFA8" if THEME == "light" else "#4A4A44"

# Okabe-Ito positions 1-4 for tectonic regions
REGION_COLORS = ["#009E73", "#C475FD", "#4467A3", "#BD8233"]

# Major earthquakes (M ≥ 6.0), 20th–21st century
# Source: USGS Significant Earthquake Catalog
earthquakes = {
    "name": [
        "Tōhoku, Japan",
        "Sumatra-Andaman",
        "Hokkaido, Japan",
        "Java, Indonesia",
        "Solomon Islands",
        "Kuril Islands",
        "Sea of Okhotsk",
        "Christchurch, NZ",
        "Tonga",
        "Kamchatka, Russia",
        "Valdivia, Chile",
        "Bio-Bio, Chile",
        "Michoacan, Mexico",
        "Haiti",
        "Ecuador",
        "Bolivia (deep)",
        "Peru",
        "El Salvador",
        "Costa Rica",
        "Alaska",
        "Turkey-Syria",
        "Izmit, Turkey",
        "Zagros, Iran",
        "Bam, Iran",
        "Nepal",
        "Gujarat, India",
        "Pakistan (AJK)",
        "Hindu Kush",
        "Sichuan, China",
        "Yunnan, China",
    ],
    "latitude": [
        38.3,
        3.3,
        42.16,
        -9.35,
        -8.47,
        46.55,
        54.89,
        -43.58,
        -18.0,
        52.75,
        -38.14,
        -35.9,
        18.19,
        18.44,
        0.36,
        -13.84,
        -5.76,
        13.04,
        10.39,
        61.0,
        37.22,
        40.75,
        26.75,
        29.00,
        28.15,
        23.36,
        34.55,
        36.07,
        31.00,
        25.07,
    ],
    "longitude": [
        142.37,
        95.98,
        142.86,
        107.35,
        157.04,
        153.30,
        153.28,
        172.68,
        -174.0,
        159.5,
        -73.41,
        -72.73,
        -102.53,
        -72.57,
        -79.94,
        -67.55,
        -75.27,
        -88.66,
        -85.24,
        -147.5,
        37.02,
        29.99,
        57.6,
        58.37,
        84.71,
        70.34,
        73.59,
        70.49,
        103.32,
        99.31,
    ],
    "magnitude": [
        9.1,
        9.1,
        8.3,
        7.7,
        8.1,
        8.3,
        8.3,
        6.3,
        7.4,
        9.0,
        9.5,
        8.8,
        8.0,
        7.0,
        7.8,
        8.2,
        8.0,
        7.7,
        7.6,
        9.2,
        7.8,
        7.6,
        6.8,
        6.6,
        7.8,
        7.7,
        7.6,
        6.1,
        7.9,
        6.2,
    ],
    "region": [
        "East & SE Asia",
        "East & SE Asia",
        "East & SE Asia",
        "East & SE Asia",
        "East & SE Asia",
        "East & SE Asia",
        "East & SE Asia",
        "East & SE Asia",
        "East & SE Asia",
        "East & SE Asia",
        "Americas",
        "Americas",
        "Americas",
        "Americas",
        "Americas",
        "Americas",
        "Americas",
        "Americas",
        "Americas",
        "Americas",
        "Middle East & C. Asia",
        "Middle East & C. Asia",
        "Middle East & C. Asia",
        "Middle East & C. Asia",
        "South Asia",
        "South Asia",
        "South Asia",
        "South Asia",
        "South Asia",
        "South Asia",
    ],
}

df = pd.DataFrame(earthquakes)

# World map basemap via vega-datasets CDN (no local package required)
world_url = "https://cdn.jsdelivr.net/npm/vega-datasets@2/data/world-110m.json"
countries = alt.topo_feature(world_url, "countries")

# Base map layer: country boundaries
base_map = (
    alt.Chart(countries)
    .mark_geoshape(fill=LAND_FILL, stroke=LAND_STROKE, strokeWidth=0.5)
    .project(type="equirectangular", scale=280, translate=[800, 480])
    .properties(width=1600, height=900)
)

# Earthquake bubble layer
region_order = ["East & SE Asia", "Americas", "Middle East & C. Asia", "South Asia"]

bubbles = (
    alt.Chart(df)
    .mark_circle(opacity=0.65, stroke=PAGE_BG, strokeWidth=1.5)
    .encode(
        longitude="longitude:Q",
        latitude="latitude:Q",
        size=alt.Size(
            "magnitude:Q",
            scale=alt.Scale(domain=[6.0, 9.5], range=[80, 2800]),
            legend=alt.Legend(
                title="Magnitude",
                titleFontSize=16,
                labelFontSize=14,
                orient="bottom-left",
                offset=20,
                values=[6.5, 7.5, 8.5, 9.5],
                symbolFillColor="#009E73",
            ),
        ),
        color=alt.Color(
            "region:N",
            scale=alt.Scale(domain=region_order, range=REGION_COLORS),
            legend=alt.Legend(
                title="Tectonic Region", titleFontSize=16, labelFontSize=14, orient="bottom-right", offset=20
            ),
        ),
        tooltip=[
            alt.Tooltip("name:N", title="Location"),
            alt.Tooltip("magnitude:Q", title="Magnitude", format=".1f"),
            alt.Tooltip("region:N", title="Region"),
            alt.Tooltip("latitude:Q", title="Latitude", format=".2f"),
            alt.Tooltip("longitude:Q", title="Longitude", format=".2f"),
        ],
    )
    .project(type="equirectangular", scale=280, translate=[800, 480])
)

# Compose and apply theme-adaptive chrome
chart = (
    (base_map + bubbles)
    .properties(
        title=alt.Title(
            text="Major Earthquakes · bubble-map-geographic · python · altair · anyplot.ai",
            fontSize=26,
            anchor="middle",
            color=INK,
        ),
        width=1600,
        height=900,
        background=PAGE_BG,
    )
    .configure_view(fill=PAGE_BG, stroke=None)
    .configure_title(color=INK)
    .configure_legend(
        fillColor=ELEVATED_BG, strokeColor=INK_SOFT, titleColor=INK, labelColor=INK_SOFT, padding=15, cornerRadius=5
    )
)

# Save
chart.save(f"plot-{THEME}.png", scale_factor=3.0)
chart.save(f"plot-{THEME}.html")
Runnable source as JSON, for any HTTP client: https://api.anyplot.ai/specs/bubble-map-geographic/altair/code. Any spec id and library id listed in llms-full.txt fit the same URL shape; every URL below is complete and callable.
{
  "spec_id": "bubble-map-geographic",
  "language": "python",
  "library": "altair",
  "page": "https://anyplot.ai/bubble-map-geographic/python/altair",
  "hub": "https://anyplot.ai/bubble-map-geographic",
  "code_json": "https://api.anyplot.ai/specs/bubble-map-geographic/altair/code",
  "spec_json": "https://api.anyplot.ai/specs/bubble-map-geographic",
  "render_light_png": "https://storage.googleapis.com/anyplot-images/plots/bubble-map-geographic/python/altair/plot-light.png",
  "render_dark_png": "https://storage.googleapis.com/anyplot-images/plots/bubble-map-geographic/python/altair/plot-dark.png",
  "interactive_light_html": "https://storage.googleapis.com/anyplot-images/plots/bubble-map-geographic/python/altair/plot-light.html",
  "interactive_dark_html": "https://storage.googleapis.com/anyplot-images/plots/bubble-map-geographic/python/altair/plot-dark.html",
  "quality_score": 91.0,
  "license": "MIT",
  "guide": "https://anyplot.ai/llms.txt"
}
Part of Bubble Map with Sized Geographic Markers on anyplot.ai.