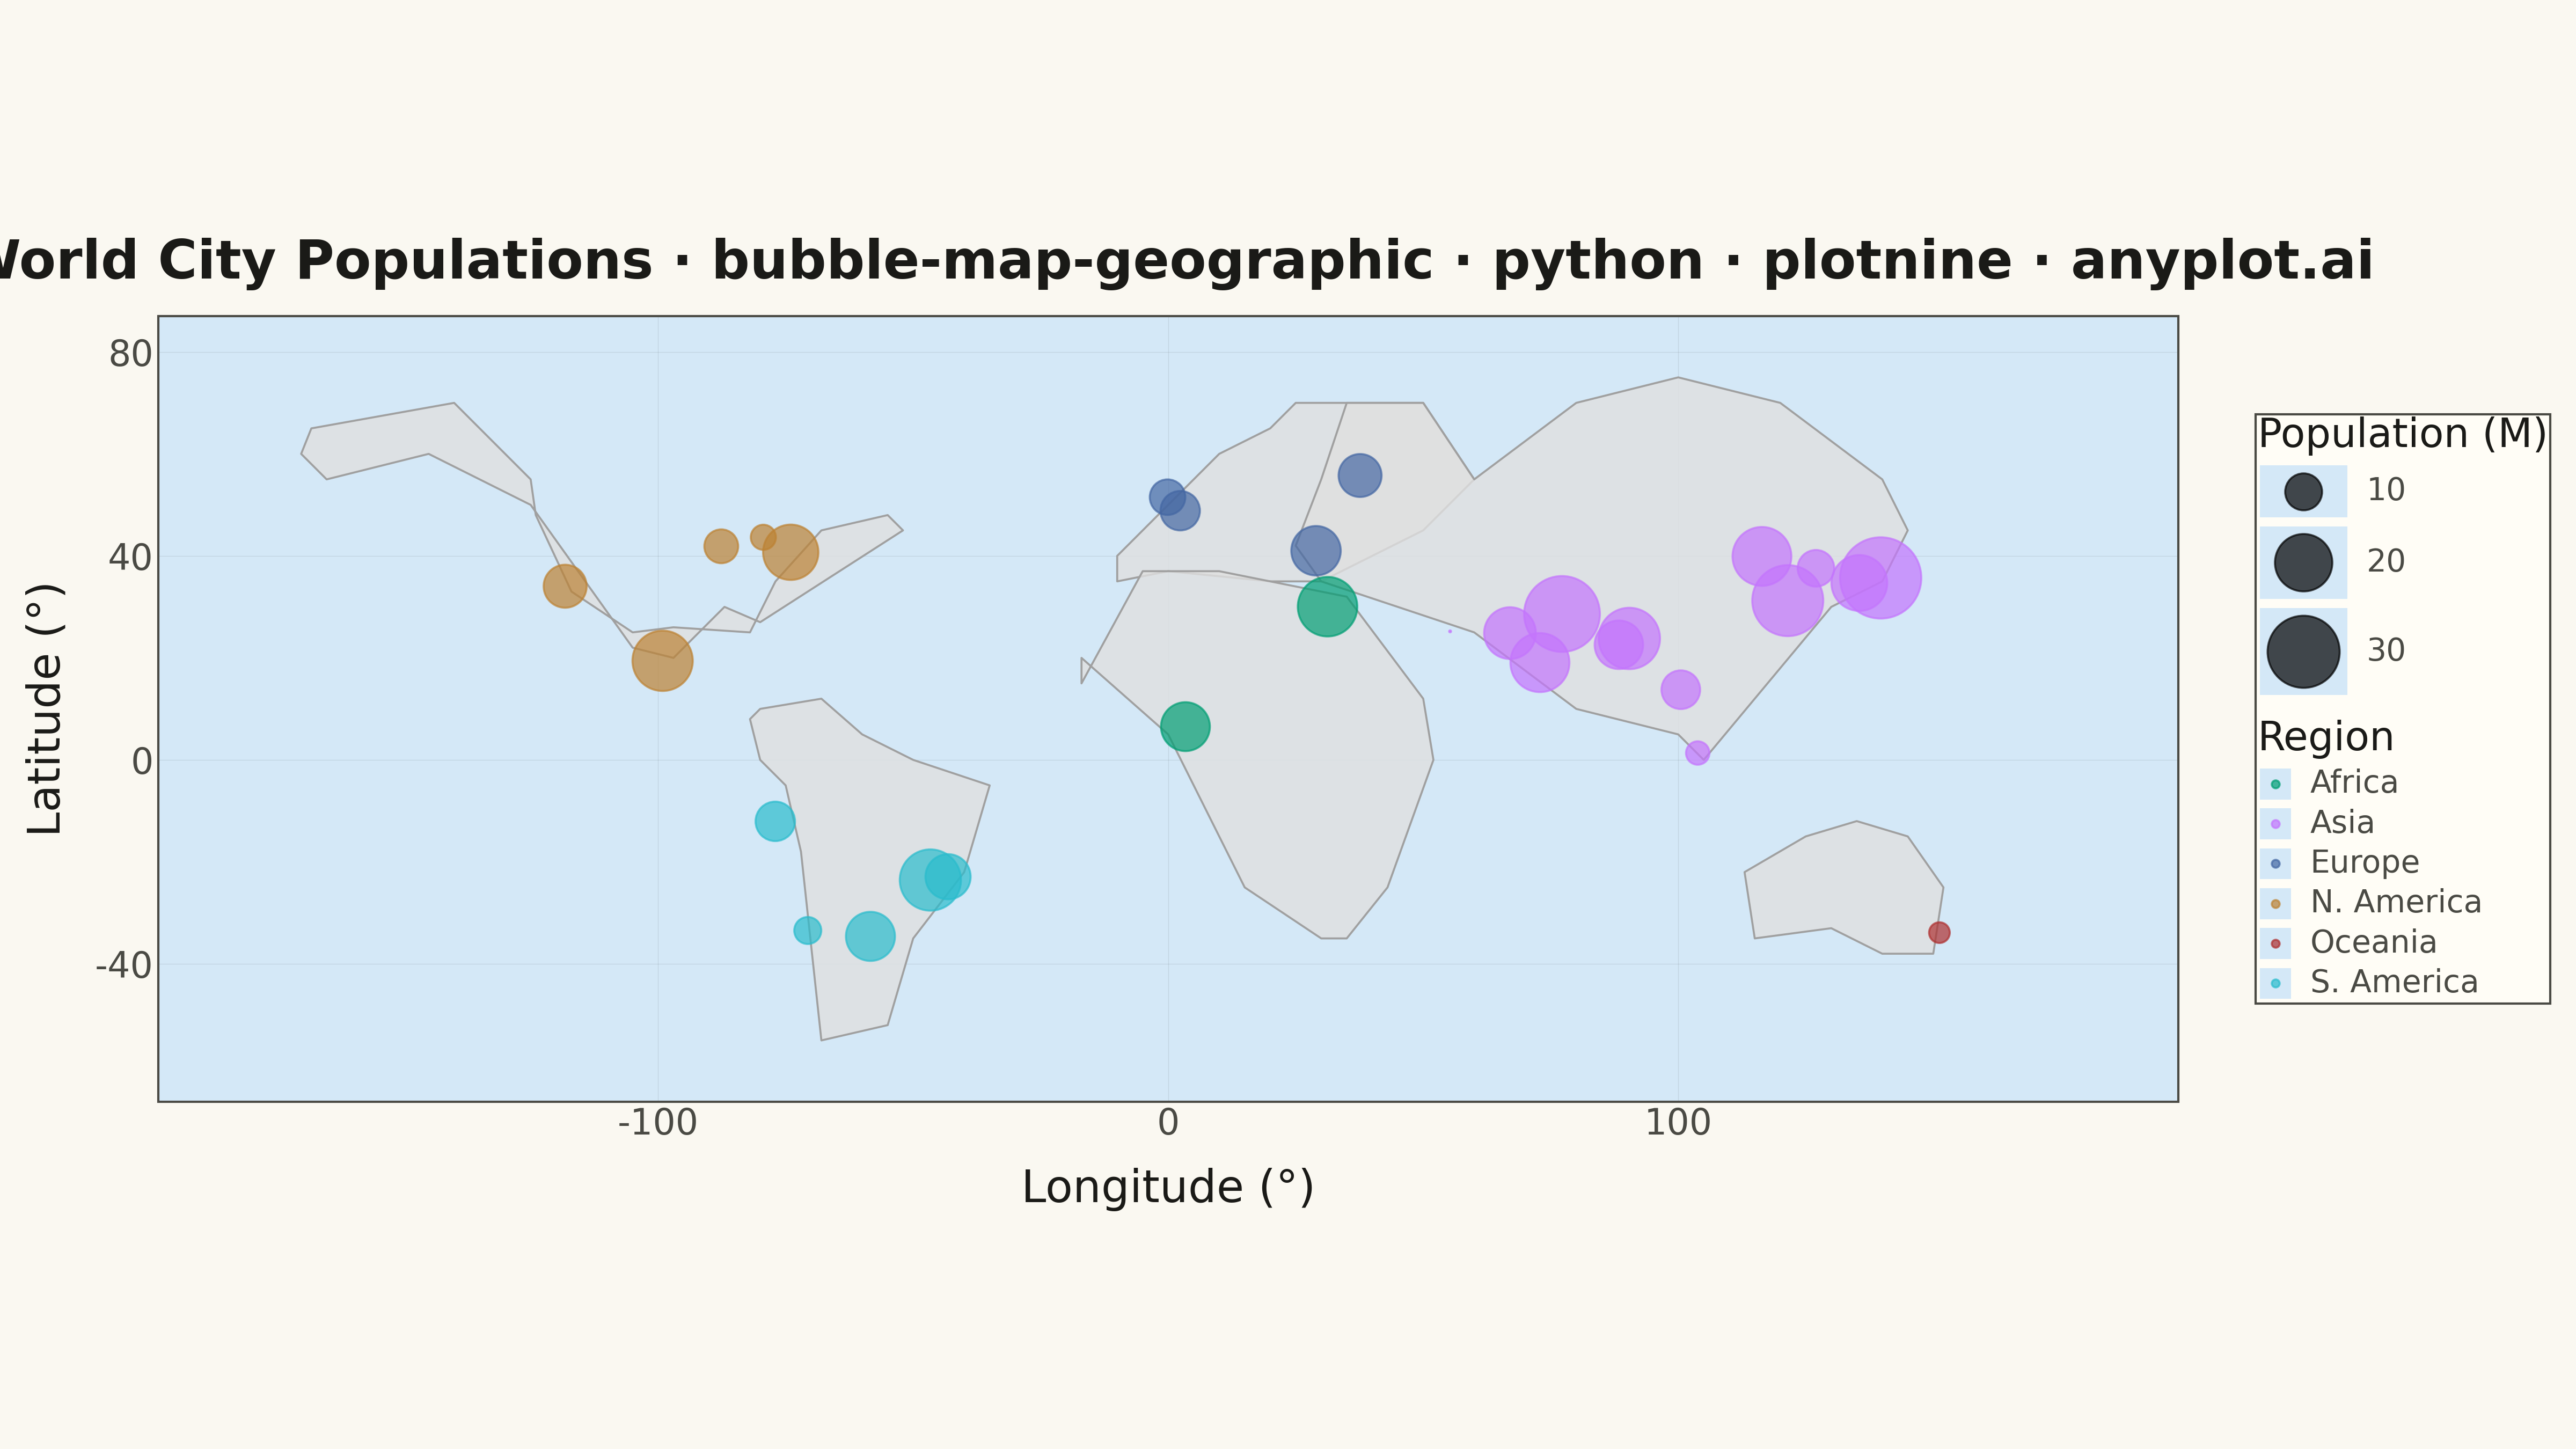
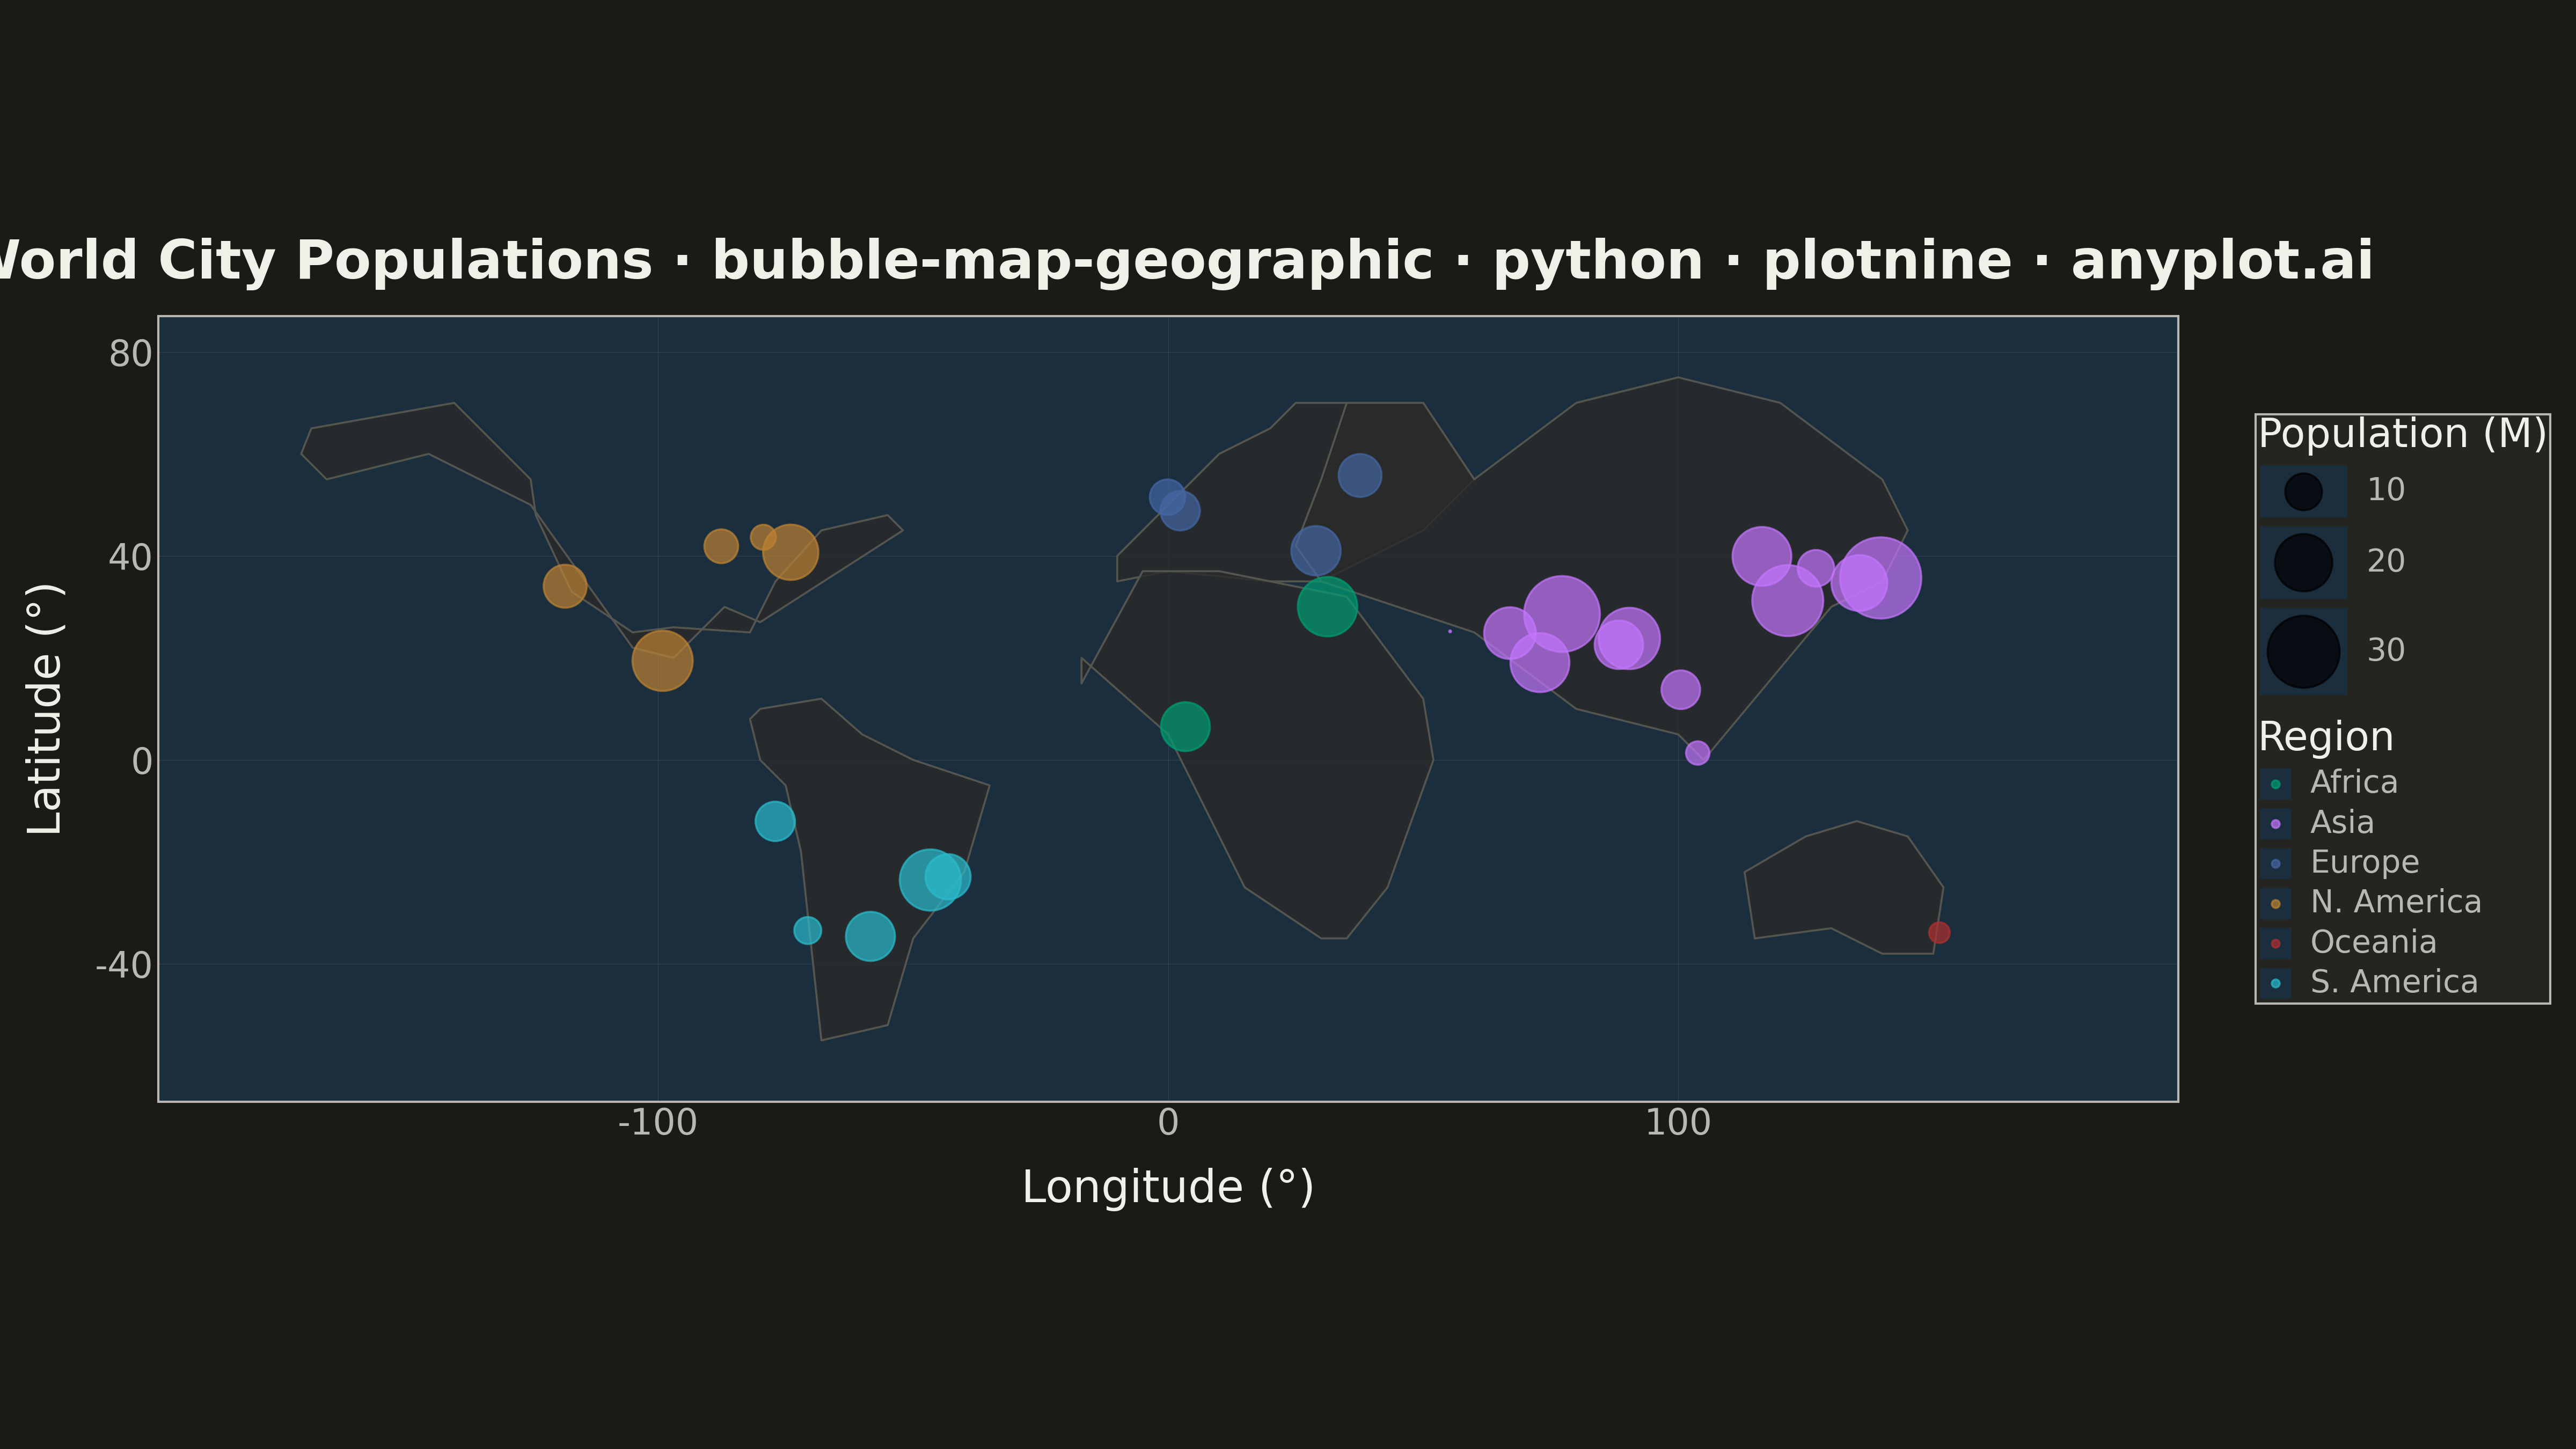
A geographic bubble map where markers are sized proportionally to quantitative data values at each location. Unlike scatter maps where size is optional, bubble maps use marker size as the primary visual encoding to show data magnitude across geographic regions. This visualization makes it immediately apparent where high and low values occur spatially, enabling intuitive comparison of quantities across locations.
""" anyplot.ai
bubble-map-geographic: Bubble Map with Sized Geographic Markers
Library: plotnine 0.15.4 | Python 3.13.13
Quality: 85/100 | Updated: 2026-05-18
"""

import os

import numpy as np
import pandas as pd
from plotnine import (
    aes,
    coord_fixed,
    element_blank,
    element_line,
    element_rect,
    element_text,
    geom_point,
    geom_polygon,
    ggplot,
    labs,
    scale_color_manual,
    scale_size_area,
    theme,
    theme_minimal,
)


THEME = os.getenv("ANYPLOT_THEME", "light")
PAGE_BG = "#FAF8F1" if THEME == "light" else "#1A1A17"
ELEVATED_BG = "#FFFDF6" if THEME == "light" else "#242420"
INK = "#1A1A17" if THEME == "light" else "#F0EFE8"
INK_SOFT = "#4A4A44" if THEME == "light" else "#B8B7B0"
OCEAN_BG = "#D4E8F7" if THEME == "light" else "#1A2E3D"
CONTINENT_FILL = "#E0E0E0" if THEME == "light" else "#2A2A2A"
CONTINENT_COLOR = "#A0A0A0" if THEME == "light" else "#555550"

# Seed for reproducibility
np.random.seed(42)

# Major world cities with population data (in millions)
cities_data = {
    "city": [
        "Tokyo",
        "Delhi",
        "Shanghai",
        "Sao Paulo",
        "Mexico City",
        "Cairo",
        "Mumbai",
        "Beijing",
        "Dhaka",
        "Osaka",
        "New York",
        "Karachi",
        "Buenos Aires",
        "Istanbul",
        "Kolkata",
        "Lagos",
        "Rio de Janeiro",
        "Los Angeles",
        "Moscow",
        "Paris",
        "Bangkok",
        "Seoul",
        "London",
        "Lima",
        "Chicago",
        "Santiago",
        "Sydney",
        "Toronto",
        "Singapore",
        "Dubai",
    ],
    "latitude": [
        35.68,
        28.61,
        31.23,
        -23.55,
        19.43,
        30.04,
        19.08,
        39.90,
        23.81,
        34.69,
        40.71,
        24.86,
        -34.60,
        41.01,
        22.57,
        6.52,
        -22.91,
        34.05,
        55.76,
        48.86,
        13.76,
        37.57,
        51.51,
        -12.05,
        41.88,
        -33.45,
        -33.87,
        43.65,
        1.35,
        25.20,
    ],
    "longitude": [
        139.69,
        77.21,
        121.47,
        -46.63,
        -99.13,
        31.24,
        72.88,
        116.41,
        90.41,
        135.50,
        -74.01,
        67.01,
        -58.38,
        28.98,
        88.36,
        3.38,
        -43.17,
        -118.24,
        37.62,
        2.35,
        100.50,
        127.00,
        -0.13,
        -77.04,
        -87.63,
        -70.67,
        151.21,
        -79.38,
        103.82,
        55.27,
    ],
    "population": [
        37.4,
        32.9,
        29.2,
        22.4,
        21.8,
        21.3,
        21.0,
        20.9,
        22.5,
        19.1,
        18.8,
        16.8,
        15.4,
        15.6,
        15.1,
        15.3,
        13.5,
        12.5,
        12.5,
        11.0,
        10.7,
        9.9,
        9.5,
        11.0,
        8.9,
        6.8,
        5.3,
        6.3,
        5.9,
        3.4,
    ],
    "region": [
        "Asia",
        "Asia",
        "Asia",
        "S. America",
        "N. America",
        "Africa",
        "Asia",
        "Asia",
        "Asia",
        "Asia",
        "N. America",
        "Asia",
        "S. America",
        "Europe",
        "Asia",
        "Africa",
        "S. America",
        "N. America",
        "Europe",
        "Europe",
        "Asia",
        "Asia",
        "Europe",
        "S. America",
        "N. America",
        "S. America",
        "Oceania",
        "N. America",
        "Asia",
        "Asia",
    ],
}

df = pd.DataFrame(cities_data)

# Sort descending so smaller bubbles render on top of larger ones
df = df.sort_values("population", ascending=False).reset_index(drop=True)

# Simplified continent outlines for basemap
continents = []

# North America
na_lon = [
    -170,
    -168,
    -140,
    -125,
    -124,
    -117,
    -105,
    -97,
    -82,
    -77,
    -68,
    -55,
    -52,
    -80,
    -87,
    -97,
    -105,
    -125,
    -145,
    -165,
    -170,
]
na_lat = [60, 65, 70, 55, 48, 33, 25, 26, 25, 35, 45, 48, 45, 27, 30, 20, 22, 50, 60, 55, 60]
for i in range(len(na_lon)):
    continents.append({"continent": "N. America", "order": i, "lon": na_lon[i], "lat": na_lat[i]})

# South America
sa_lon = [-80, -68, -60, -50, -35, -40, -50, -55, -68, -72, -75, -80, -82, -80]
sa_lat = [10, 12, 5, 0, -5, -22, -35, -52, -55, -18, -5, 0, 8, 10]
for i in range(len(sa_lon)):
    continents.append({"continent": "S. America", "order": i, "lon": sa_lon[i], "lat": sa_lat[i]})

# Europe
eu_lon = [-10, 0, 10, 20, 30, 40, 50, 60, 50, 35, 25, 20, 10, 0, -10, -10]
eu_lat = [35, 37, 36, 35, 35, 40, 45, 55, 70, 70, 70, 65, 60, 50, 40, 35]
for i in range(len(eu_lon)):
    continents.append({"continent": "Europe", "order": i, "lon": eu_lon[i], "lat": eu_lat[i]})

# Africa
af_lon = [-17, -5, 10, 35, 50, 52, 43, 35, 30, 15, 0, -17, -17]
af_lat = [15, 37, 37, 32, 12, 0, -25, -35, -35, -25, 5, 20, 15]
for i in range(len(af_lon)):
    continents.append({"continent": "Africa", "order": i, "lon": af_lon[i], "lat": af_lat[i]})

# Asia
as_lon = [60, 80, 100, 120, 140, 145, 140, 130, 105, 100, 80, 60, 45, 30, 25, 30, 35, 50, 60]
as_lat = [55, 70, 75, 70, 55, 45, 35, 30, 0, 5, 10, 25, 30, 35, 42, 55, 70, 70, 55]
for i in range(len(as_lon)):
    continents.append({"continent": "Asia", "order": i, "lon": as_lon[i], "lat": as_lat[i]})

# Australia
au_lon = [113, 125, 135, 145, 152, 150, 140, 130, 115, 113]
au_lat = [-22, -15, -12, -15, -25, -38, -38, -33, -35, -22]
for i in range(len(au_lon)):
    continents.append({"continent": "Australia", "order": i, "lon": au_lon[i], "lat": au_lat[i]})

df_continents = pd.DataFrame(continents)

# Okabe-Ito canonical order mapped to regions alphabetically:
# Africa, Asia, Europe, N. America, Oceania, S. America
IMPRINT = ["#009E73", "#C475FD", "#4467A3", "#BD8233", "#AE3030", "#2ABCCD"]

# Create the bubble map
plot = (
    ggplot()
    # Draw continent polygons as basemap
    + geom_polygon(
        aes(x="lon", y="lat", group="continent"),
        data=df_continents,
        fill=CONTINENT_FILL,
        color=CONTINENT_COLOR,
        size=0.5,
        alpha=0.8,
    )
    # Draw bubble markers sized by population
    + geom_point(aes(x="longitude", y="latitude", color="region", size="population"), data=df, alpha=0.7, stroke=0.5)
    # Scale size by area for accurate perception (bubble area proportional to value)
    + scale_size_area(max_size=20, name="Population (M)")
    + scale_color_manual(values=IMPRINT, name="Region")
    + coord_fixed(ratio=1.0, xlim=(-180, 180), ylim=(-60, 80))
    + labs(
        title="World City Populations · bubble-map-geographic · python · plotnine · anyplot.ai",
        x="Longitude (°)",
        y="Latitude (°)",
    )
    + theme_minimal()
    + theme(
        figure_size=(16, 9),
        plot_background=element_rect(fill=PAGE_BG, color=PAGE_BG),
        panel_background=element_rect(fill=OCEAN_BG),
        panel_grid_major=element_line(color=INK, size=0.3, alpha=0.10),
        panel_grid_minor=element_blank(),
        panel_border=element_rect(color=INK_SOFT, fill=None),
        plot_title=element_text(size=24, weight="bold", color=INK),
        axis_title=element_text(size=20, color=INK),
        axis_text=element_text(size=16, color=INK_SOFT),
        legend_title=element_text(size=18, color=INK),
        legend_text=element_text(size=14, color=INK_SOFT),
        legend_background=element_rect(fill=ELEVATED_BG, color=INK_SOFT),
        legend_position="right",
    )
)

# Save at 300 DPI for 4800x2700 px output
plot.save(f"plot-{THEME}.png", dpi=300, verbose=False)
Runnable source as JSON, for any HTTP client: https://api.anyplot.ai/specs/bubble-map-geographic/plotnine/code. Any spec id and library id listed in llms-full.txt fit the same URL shape; every URL below is complete and callable.
{
  "spec_id": "bubble-map-geographic",
  "language": "python",
  "library": "plotnine",
  "page": "https://anyplot.ai/bubble-map-geographic/python/plotnine",
  "hub": "https://anyplot.ai/bubble-map-geographic",
  "code_json": "https://api.anyplot.ai/specs/bubble-map-geographic/plotnine/code",
  "spec_json": "https://api.anyplot.ai/specs/bubble-map-geographic",
  "render_light_png": "https://storage.googleapis.com/anyplot-images/plots/bubble-map-geographic/python/plotnine/plot-light.png",
  "render_dark_png": "https://storage.googleapis.com/anyplot-images/plots/bubble-map-geographic/python/plotnine/plot-dark.png",
  "quality_score": 85.0,
  "license": "MIT",
  "guide": "https://anyplot.ai/llms.txt"
}
Part of Bubble Map with Sized Geographic Markers on anyplot.ai.