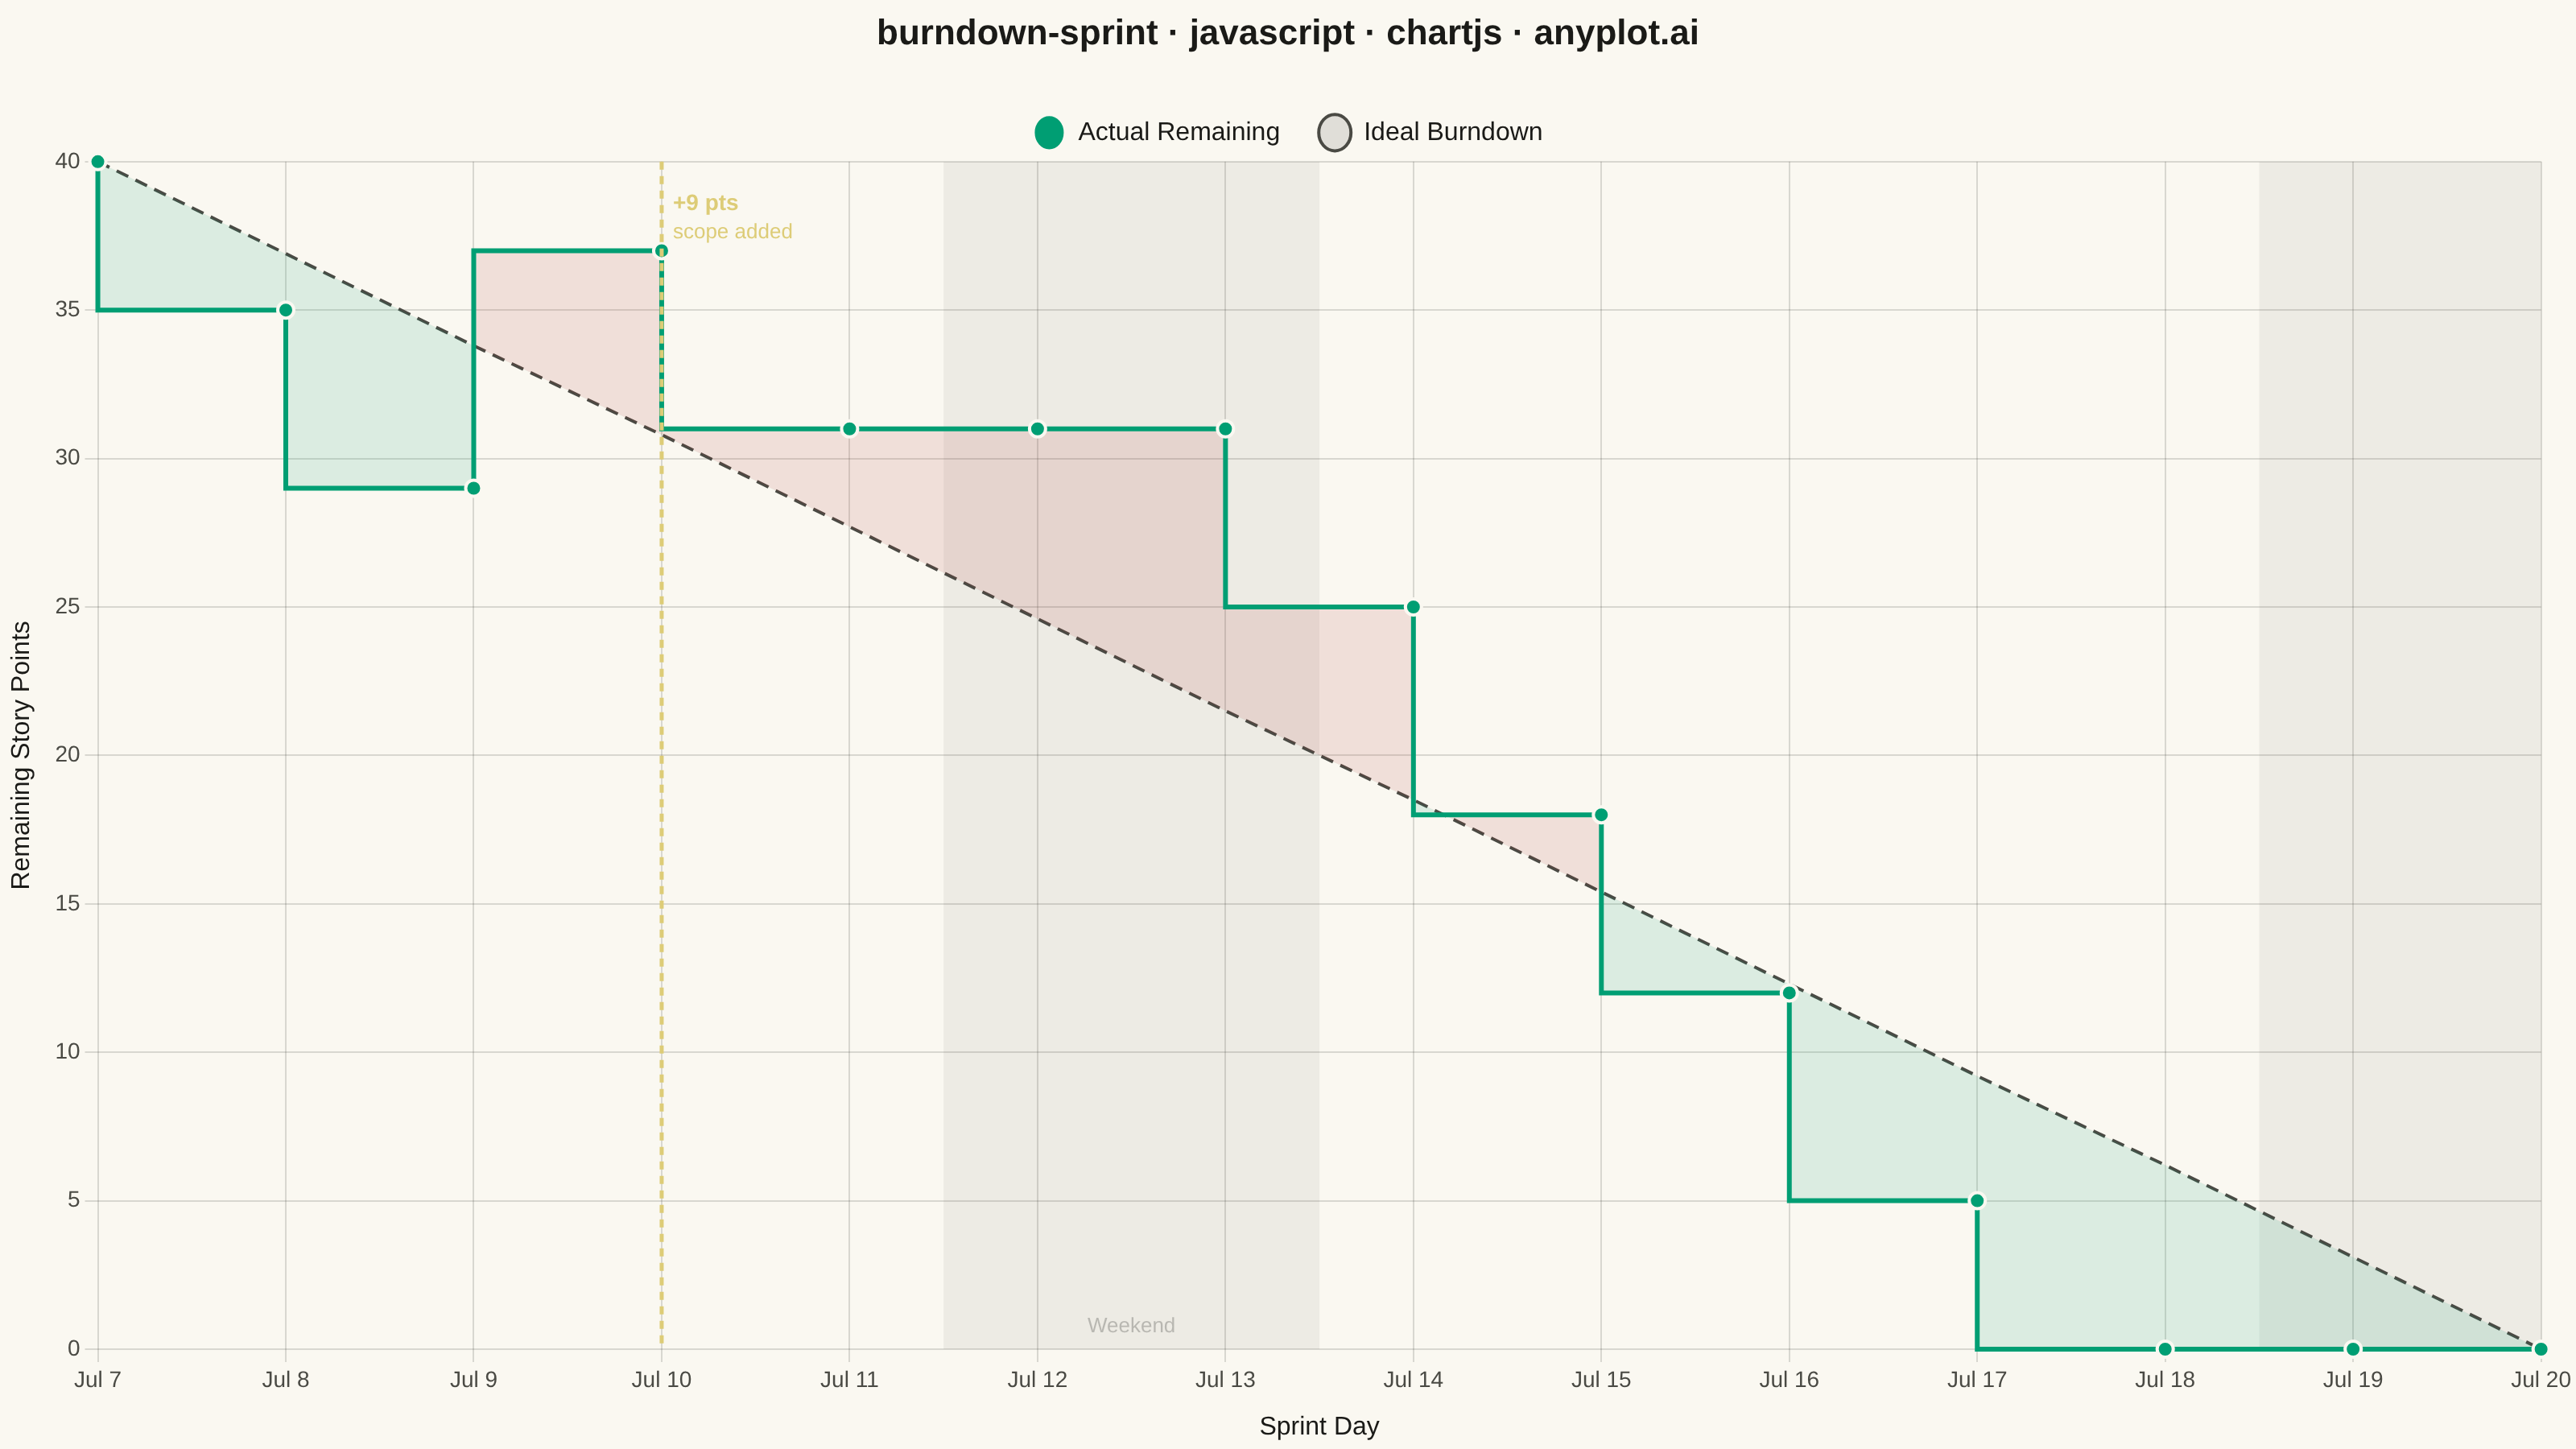
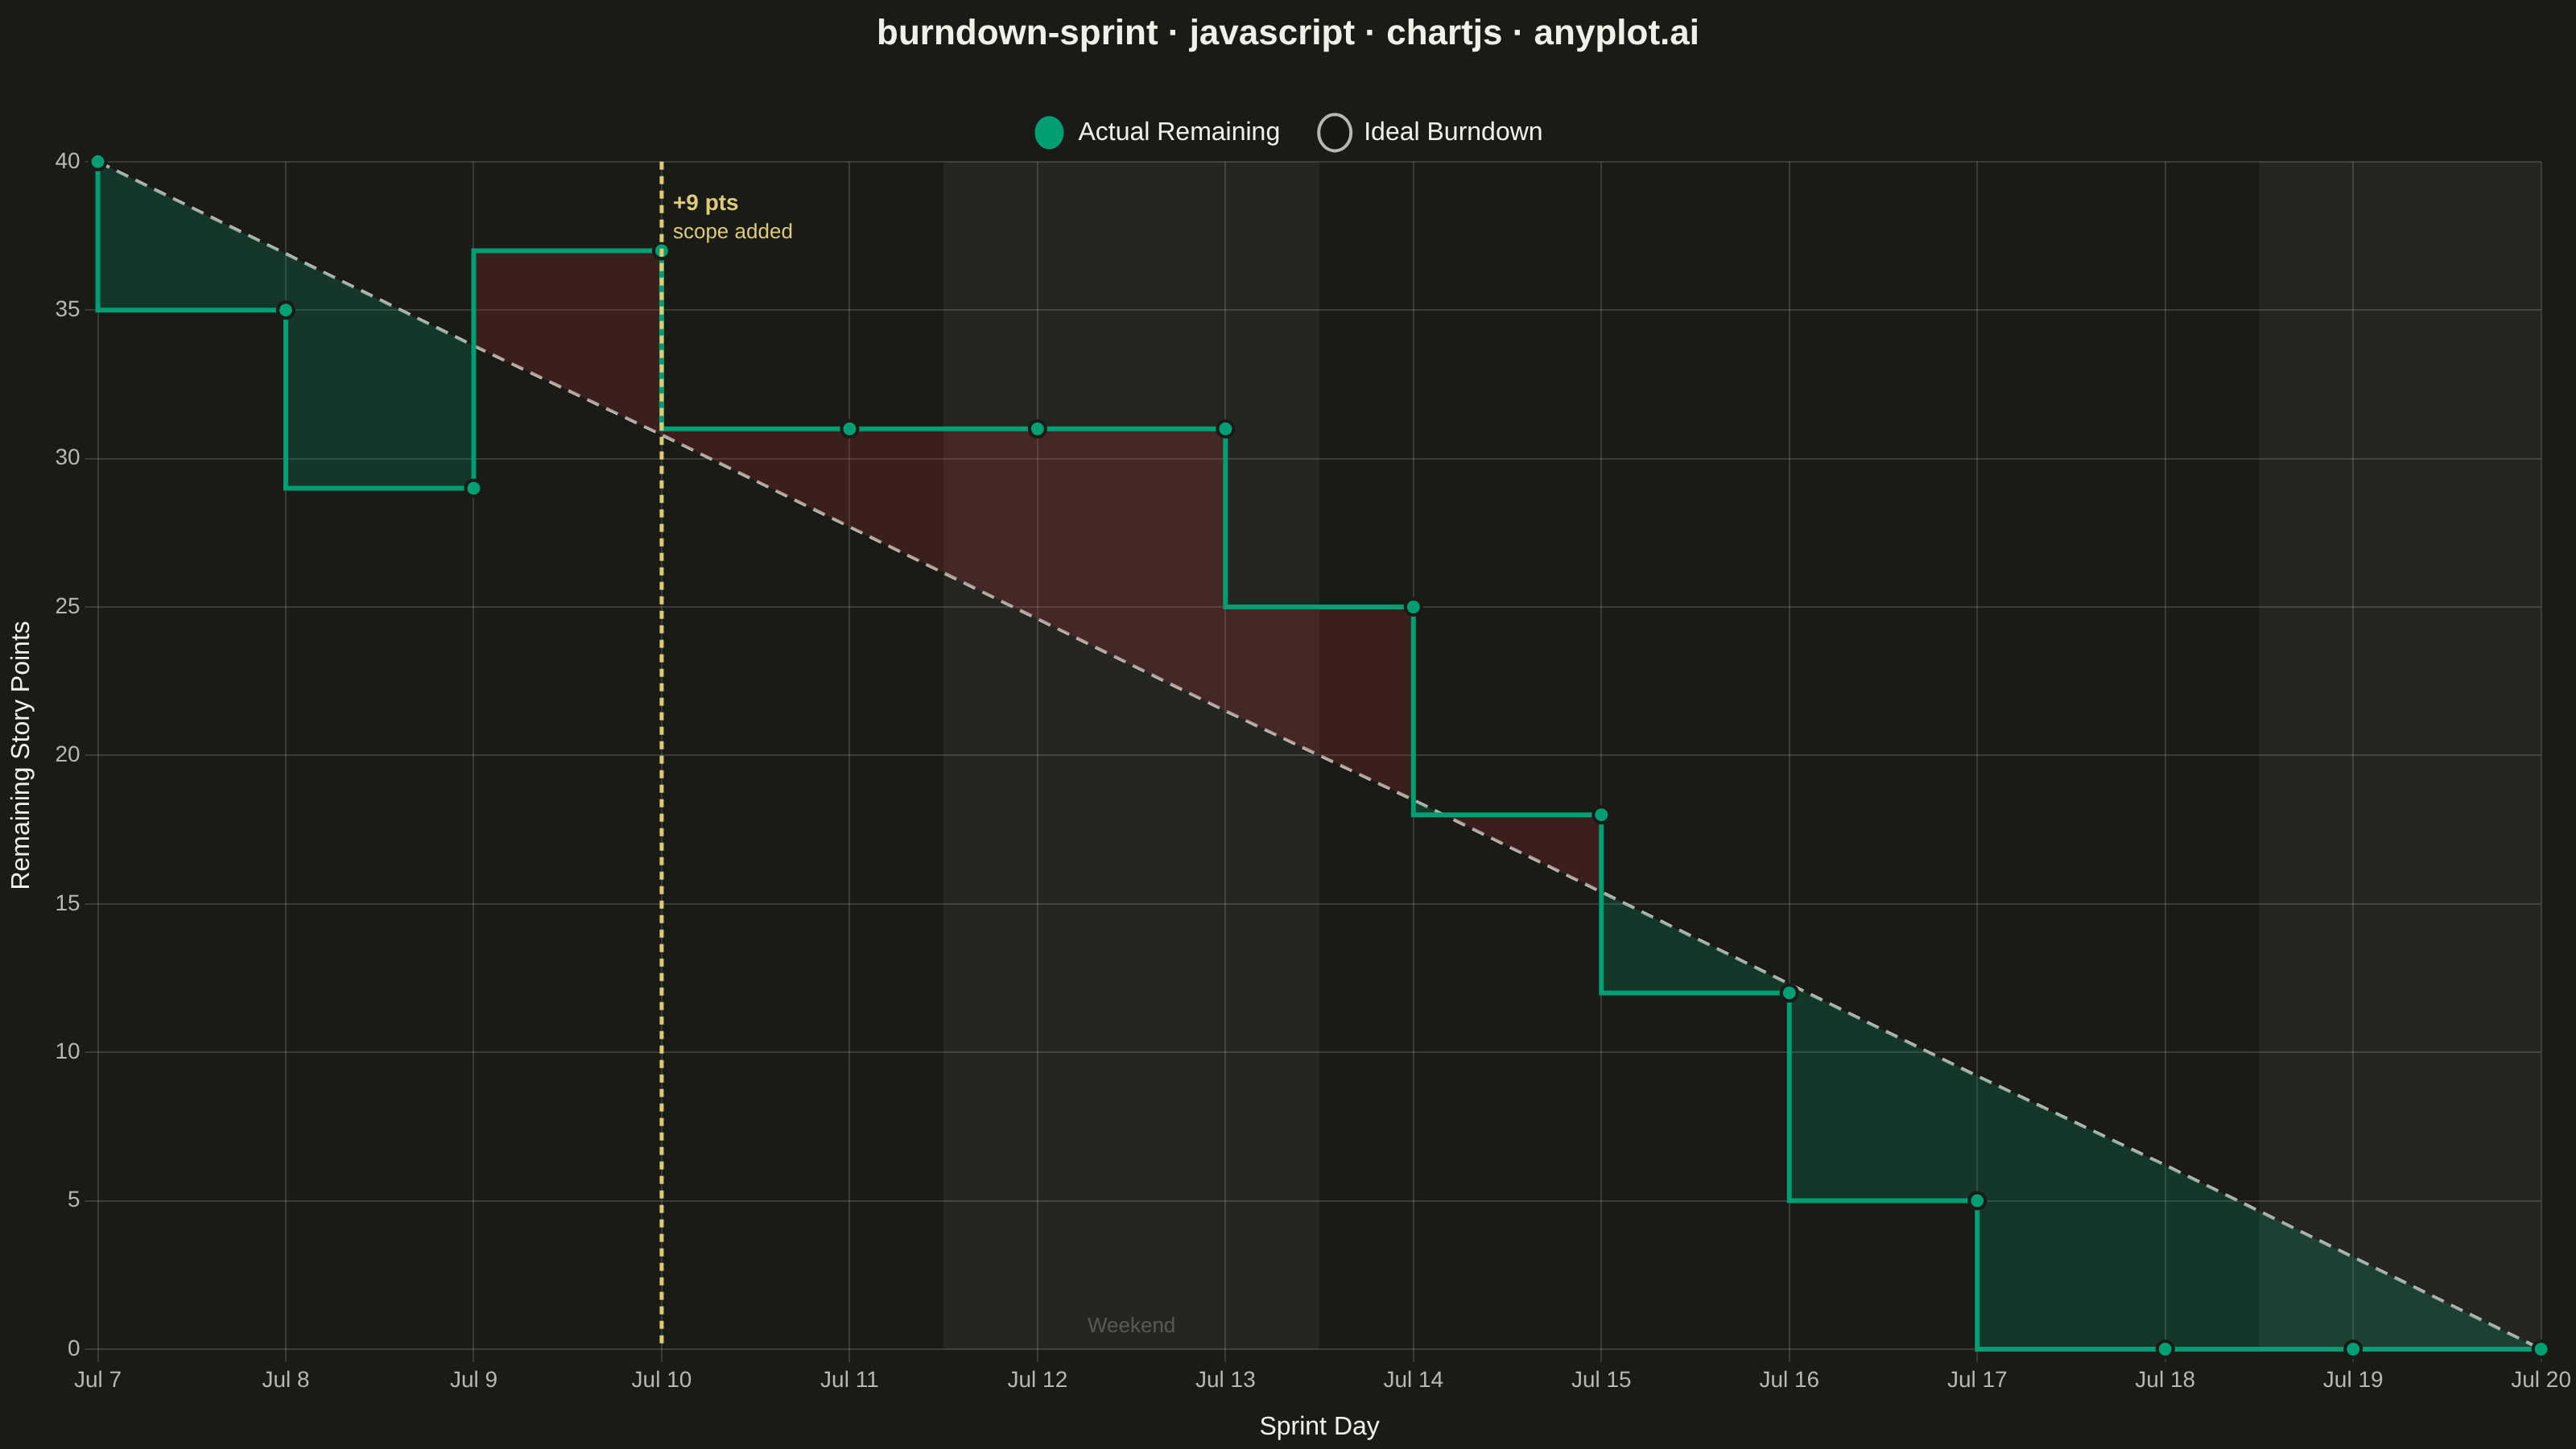
A sprint burndown chart tracks the amount of remaining work in an agile sprint over time, plotted as a step (or line) series that descends as tasks are completed. A straight ideal-burndown guideline runs diagonally from the total committed scope on day one down to zero on the final day, giving the team an at-a-glance reference for whether they are ahead of or behind schedule. It is one of the most widely used project-management visualizations in software development, surfacing scope creep, stalled progress, and end-of-sprint risk early enough to act on.
// anyplot.ai
// burndown-sprint: Agile Sprint Burndown Chart
// Library: chartjs 4.4.7 | JavaScript 22.22.3
// Quality: 92/100 | Created: 2026-06-14
//# anyplot-orientation: landscape

const t = window.ANYPLOT_TOKENS;
const THEME = window.ANYPLOT_THEME;

// Sprint: 14 calendar days (Jul 7–20), 10 working days, 40 initial story points.
// Scope change on Jul 10 (Day 4): +9 story points added mid-sprint.
const labels = [
  "Jul 7", "Jul 8", "Jul 9", "Jul 10", "Jul 11", "Jul 12", "Jul 13",
  "Jul 14", "Jul 15", "Jul 16", "Jul 17", "Jul 18", "Jul 19", "Jul 20",
];

// Actual remaining story points at end of each day (step-wise; flat on weekends).
// Day 4 (Jul 10) jumps from 29→37: scope grew by 9 pts, 1 pt was burned that day.
const remaining = [40, 35, 29, 37, 31, 31, 31, 25, 18, 12, 5, 0, 0, 0];

// Ideal burndown: straight diagonal from 40 (day 0) to 0 (day 13).
const ideal = labels.map((_, i) => +(40 * (1 - i / 13)).toFixed(1));

// Weekend bands: Jul 12–13 and Jul 19–20 (half-unit offsets centre on the gaps).
const weekendRanges = [[4.5, 6.5], [11.5, 13.5]];
const scopeChangeIndex = 3; // Jul 10

// Plugin: shade non-working weekend columns behind the chart data.
const weekendPlugin = {
  id: "weekendBands",
  beforeDraw(chart) {
    const { ctx, scales: { x, y } } = chart;
    ctx.save();
    ctx.fillStyle = THEME === "light"
      ? "rgba(26,26,23,0.055)"
      : "rgba(240,239,232,0.055)";
    weekendRanges.forEach(([s, e]) => {
      const x0 = x.getPixelForValue(s);
      const x1 = Math.min(x.getPixelForValue(e), x.right);
      ctx.fillRect(x0, y.top, x1 - x0, y.bottom - y.top);
    });
    // Weekend label in first band
    const midX = (x.getPixelForValue(4.5) + x.getPixelForValue(6.5)) / 2;
    ctx.fillStyle = THEME === "light"
      ? "rgba(26,26,23,0.25)"
      : "rgba(240,239,232,0.25)";
    ctx.font = `13px ${Chart.defaults.font.family}`;
    ctx.textAlign = "center";
    ctx.fillText("Weekend", midX, y.bottom - 14);
    ctx.restore();
  },
};

// Plugin: vertical amber line + label at the scope change day.
const scopeChangePlugin = {
  id: "scopeChangeMarker",
  afterDatasetsDraw(chart) {
    const { ctx, scales: { x, y } } = chart;
    const xPos = x.getPixelForValue(scopeChangeIndex);
    ctx.save();
    ctx.setLineDash([5, 4]);
    ctx.strokeStyle = t.amber;
    ctx.lineWidth = 2.5;
    ctx.beginPath();
    ctx.moveTo(xPos, y.top);
    ctx.lineTo(xPos, y.bottom);
    ctx.stroke();
    ctx.setLineDash([]);
    ctx.fillStyle = t.amber;
    ctx.font = `bold 14px ${Chart.defaults.font.family}`;
    ctx.textAlign = "left";
    ctx.fillText("+9 pts", xPos + 7, y.top + 26);
    ctx.font = `13px ${Chart.defaults.font.family}`;
    ctx.fillText("scope added", xPos + 7, y.top + 44);
    ctx.restore();
  },
};

// Mount canvas into the harness container.
const canvas = document.createElement("canvas");
document.getElementById("container").appendChild(canvas);

new Chart(canvas, {
  type: "line",
  data: {
    labels,
    datasets: [
      {
        label: "Actual Remaining",
        data: remaining,
        borderColor: t.palette[0],     // Imprint brand green
        borderWidth: 3,
        pointRadius: 5,
        pointHoverRadius: 7,
        pointBackgroundColor: t.palette[0],
        pointBorderColor: t.pageBg,
        pointBorderWidth: 2,
        stepped: "after",
        // Red fill when actual > ideal (behind schedule); green when actual < ideal (ahead).
        // Dark mode uses higher opacity so fills remain visible on the near-black surface.
        fill: {
          target: 1,
          above: THEME === "dark" ? "rgba(174,48,48,0.22)" : "rgba(174,48,48,0.12)",
          below: THEME === "dark" ? "rgba(0,158,115,0.22)" : "rgba(0,158,115,0.12)",
        },
      },
      {
        label: "Ideal Burndown",
        data: ideal,
        borderColor: t.inkSoft,
        borderWidth: 2,
        borderDash: [8, 5],
        pointRadius: 0,
        tension: 0,
        fill: false,
      },
    ],
  },
  options: {
    responsive: true,
    maintainAspectRatio: false,
    animation: false,
    interaction: {
      mode: "index",
      intersect: false,
    },
    plugins: {
      title: {
        display: true,
        text: "burndown-sprint · javascript · chartjs · anyplot.ai",
        color: t.ink,
        font: { size: 22, weight: "bold" },
        padding: { top: 8, bottom: 16 },
      },
      legend: {
        position: "top",
        labels: {
          color: t.ink,
          font: { size: 16 },
          padding: 24,
          usePointStyle: true,
          pointStyleWidth: 20,
        },
      },
    },
    scales: {
      x: {
        ticks: {
          color: t.inkSoft,
          font: { size: 14 },
          maxRotation: 45,
          minRotation: 0,
        },
        grid: { color: t.grid },
        border: { display: false },
        title: {
          display: true,
          text: "Sprint Day",
          color: t.ink,
          font: { size: 16 },
          padding: { top: 8 },
        },
      },
      y: {
        beginAtZero: true,
        ticks: {
          color: t.inkSoft,
          font: { size: 14 },
        },
        grid: { color: t.grid },
        border: { display: false },
        title: {
          display: true,
          text: "Remaining Story Points",
          color: t.ink,
          font: { size: 16 },
          padding: { bottom: 8 },
        },
      },
    },
  },
  plugins: [weekendPlugin, scopeChangePlugin],
});
Runnable source as JSON, for any HTTP client: https://api.anyplot.ai/specs/burndown-sprint/chartjs/code. Any spec id and library id listed in llms-full.txt fit the same URL shape; every URL below is complete and callable.
{
  "spec_id": "burndown-sprint",
  "language": "javascript",
  "library": "chartjs",
  "page": "https://anyplot.ai/burndown-sprint/javascript/chartjs",
  "hub": "https://anyplot.ai/burndown-sprint",
  "code_json": "https://api.anyplot.ai/specs/burndown-sprint/chartjs/code",
  "spec_json": "https://api.anyplot.ai/specs/burndown-sprint",
  "render_light_png": "https://storage.googleapis.com/anyplot-images/plots/burndown-sprint/javascript/chartjs/plot-light.png",
  "render_dark_png": "https://storage.googleapis.com/anyplot-images/plots/burndown-sprint/javascript/chartjs/plot-dark.png",
  "interactive_light_html": "https://storage.googleapis.com/anyplot-images/plots/burndown-sprint/javascript/chartjs/plot-light.html",
  "interactive_dark_html": "https://storage.googleapis.com/anyplot-images/plots/burndown-sprint/javascript/chartjs/plot-dark.html",
  "quality_score": 92.0,
  "license": "MIT",
  "guide": "https://anyplot.ai/llms.txt"
}
Part of Agile Sprint Burndown Chart on anyplot.ai.