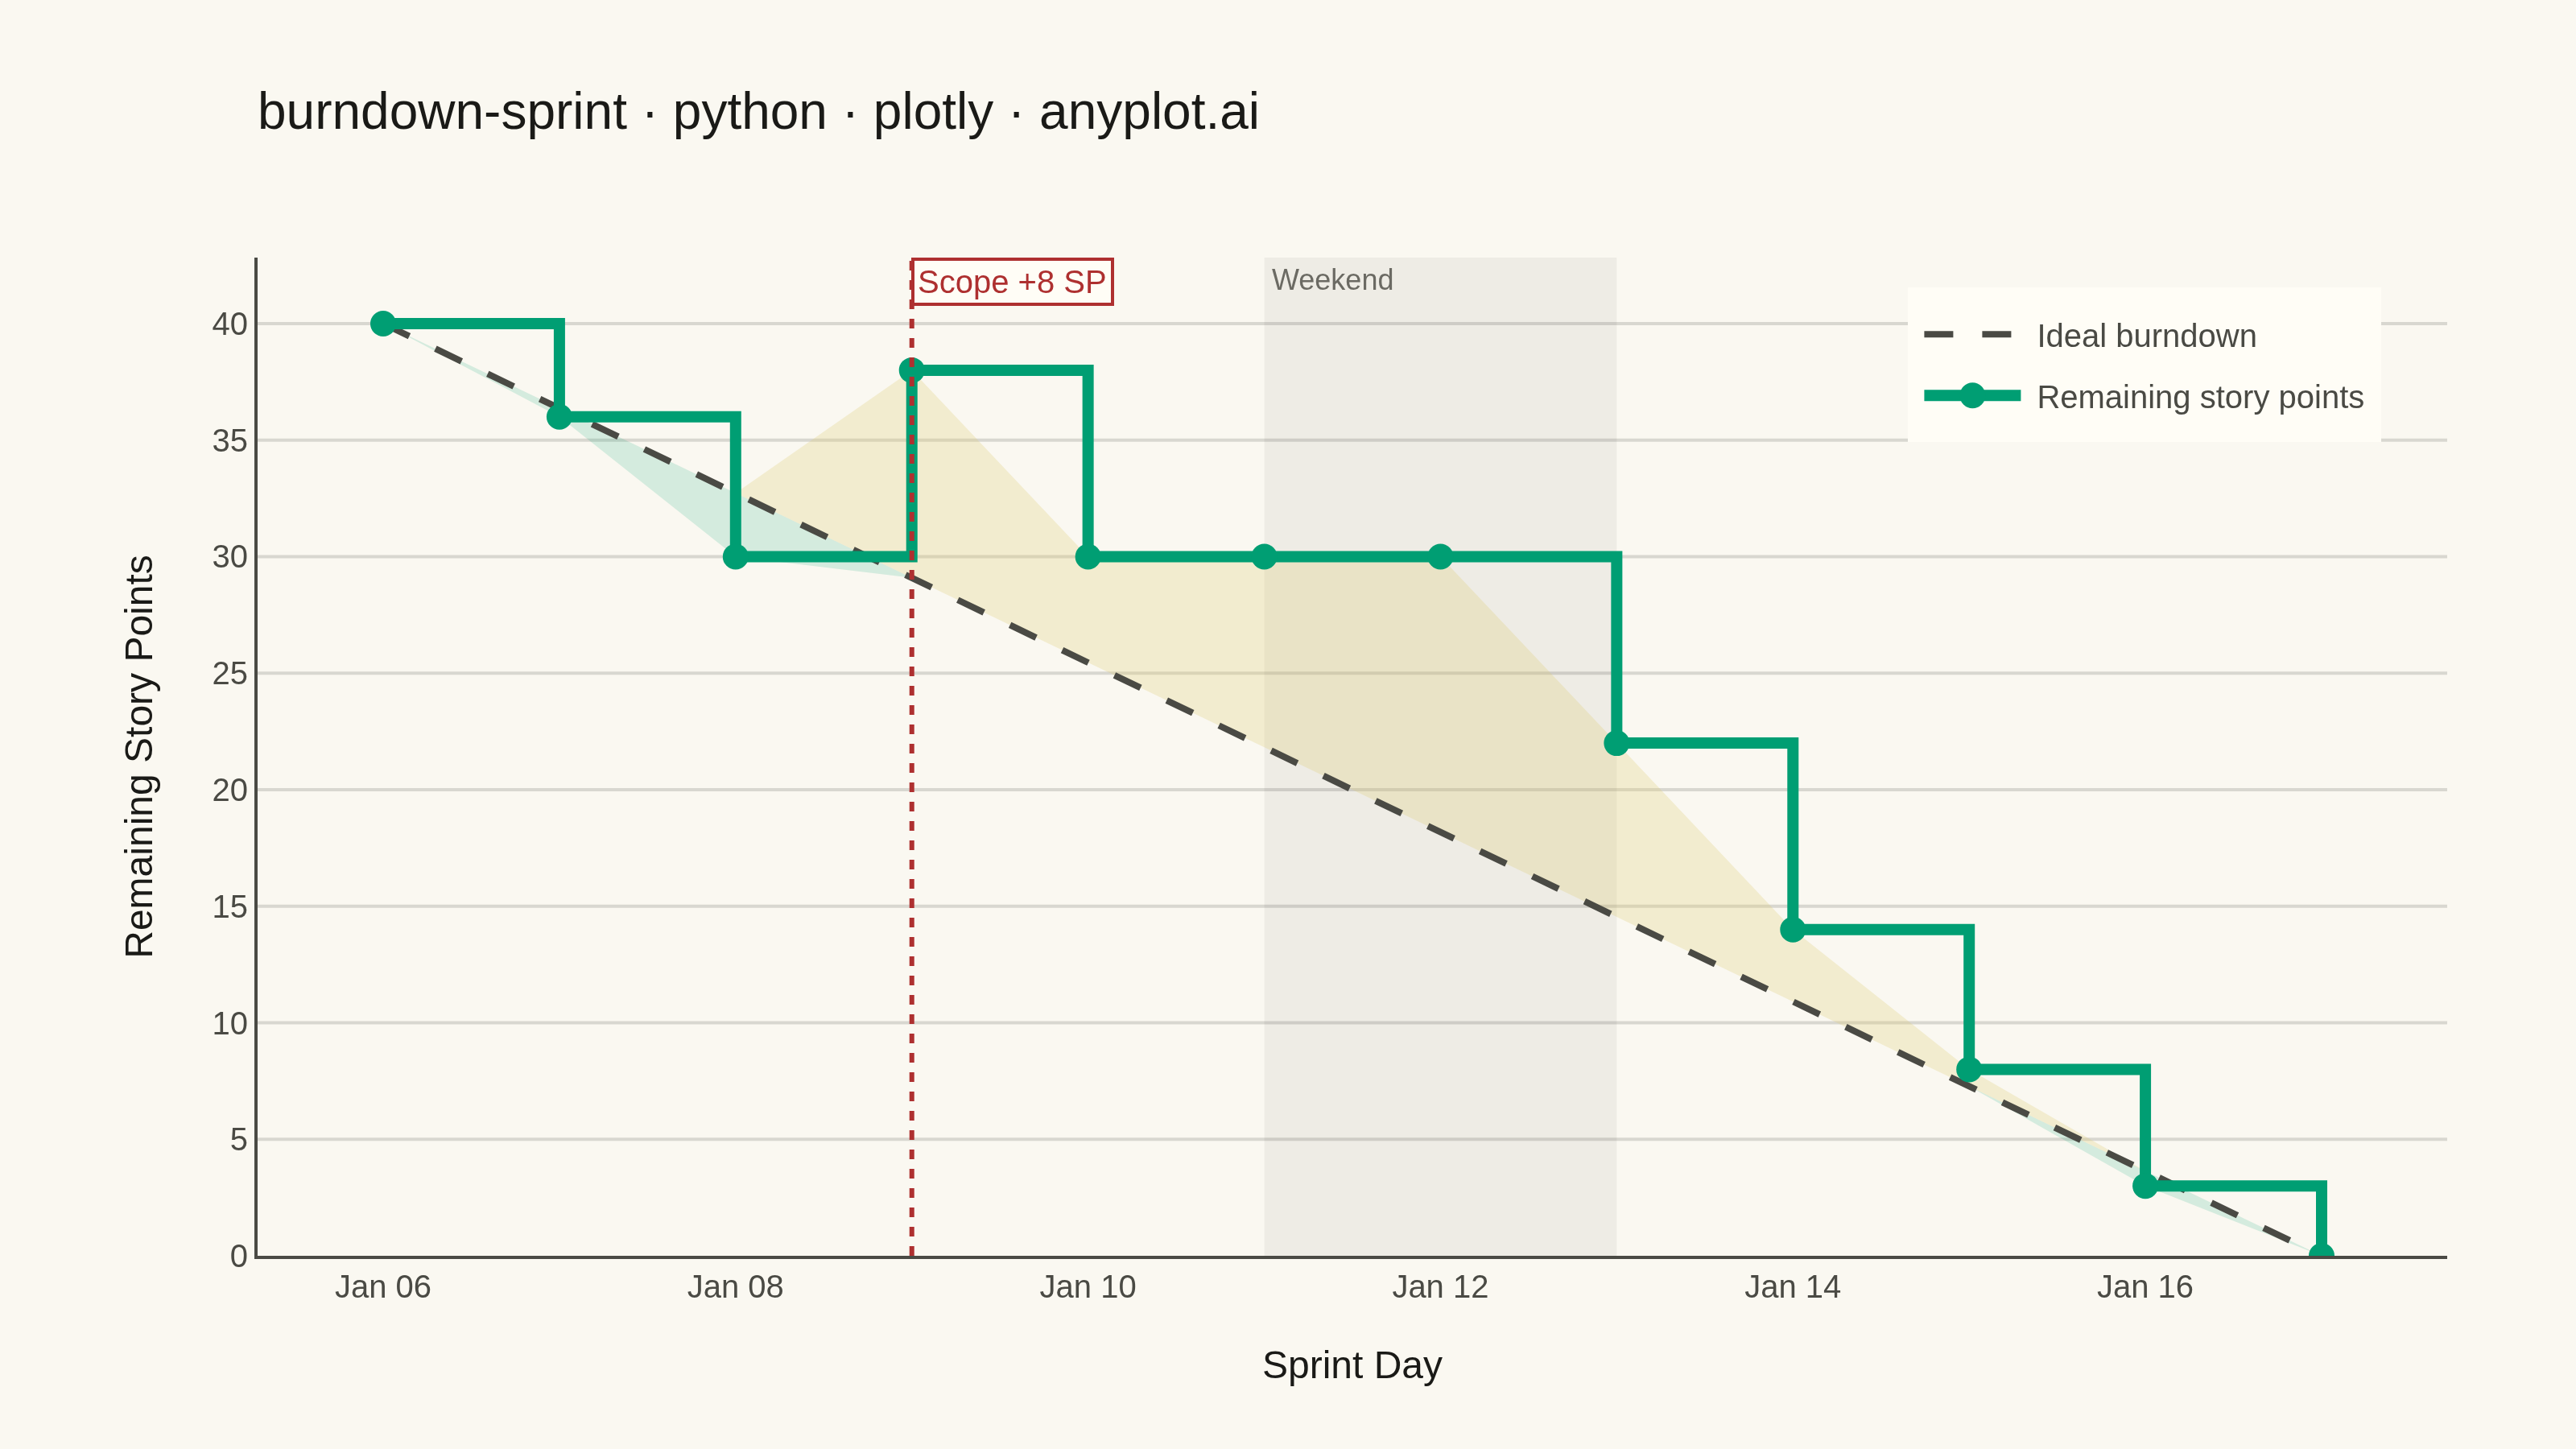
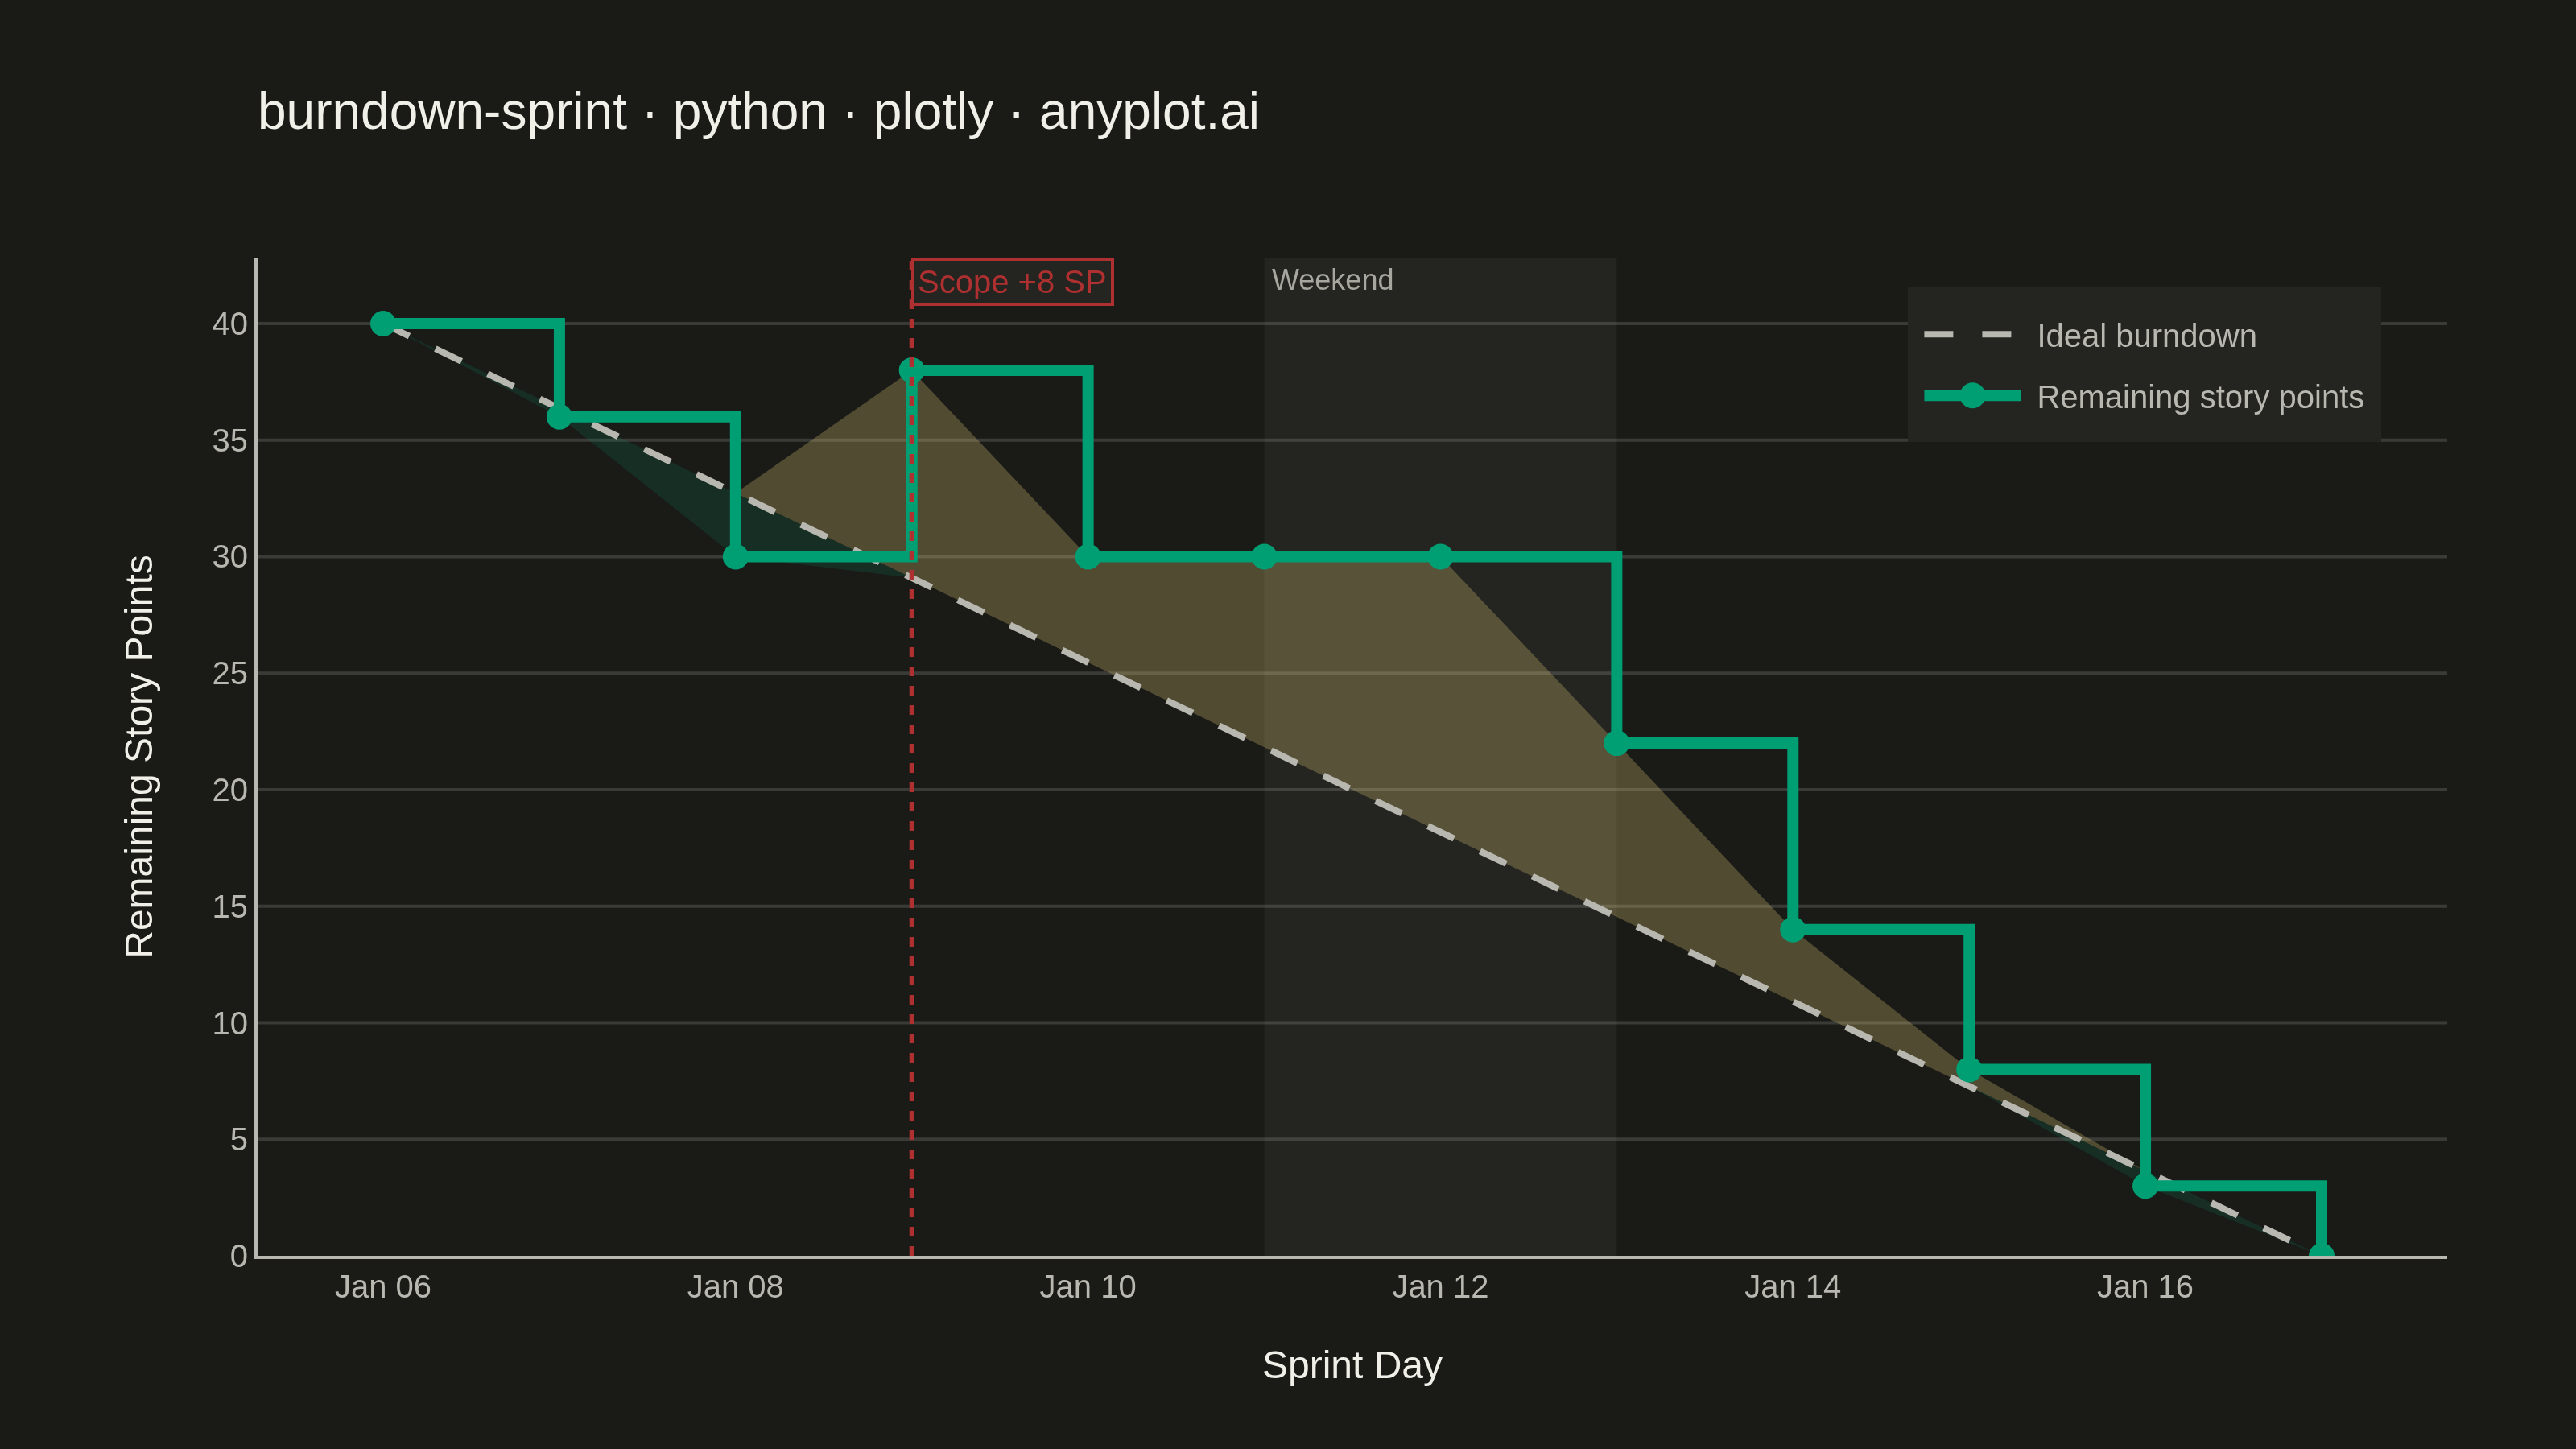
A sprint burndown chart tracks the amount of remaining work in an agile sprint over time, plotted as a step (or line) series that descends as tasks are completed. A straight ideal-burndown guideline runs diagonally from the total committed scope on day one down to zero on the final day, giving the team an at-a-glance reference for whether they are ahead of or behind schedule. It is one of the most widely used project-management visualizations in software development, surfacing scope creep, stalled progress, and end-of-sprint risk early enough to act on.
""" anyplot.ai
burndown-sprint: Agile Sprint Burndown Chart
Library: plotly 6.8.0 | Python 3.13.13
Quality: 88/100 | Created: 2026-06-14
"""

import os
import sys


# Remove this script's directory from sys.path so 'plotly' resolves to the
# installed package and not this file (which shares the package name).
_script_dir = os.path.dirname(os.path.abspath(__file__))
sys.path = [p for p in sys.path if p != _script_dir]

import pandas as pd
import plotly.graph_objects as go


# Theme tokens
THEME = os.getenv("ANYPLOT_THEME", "light")
PAGE_BG = "#FAF8F1" if THEME == "light" else "#1A1A17"
ELEVATED_BG = "#FFFDF6" if THEME == "light" else "#242420"
INK = "#1A1A17" if THEME == "light" else "#F0EFE8"
INK_SOFT = "#4A4A44" if THEME == "light" else "#B8B7B0"
INK_MUTED = "#6B6A63" if THEME == "light" else "#A8A79F"
GRID = "rgba(26,26,23,0.15)" if THEME == "light" else "rgba(240,239,232,0.15)"
WEEKEND_FILL = "rgba(26,26,23,0.05)" if THEME == "light" else "rgba(240,239,232,0.05)"

# Imprint palette — first series always #009E73
BRAND = "#009E73"  # actual remaining-work line
SCOPE_COLOR = "#AE3030"  # scope change event (semantic red — risk/addition)
ANYPLOT_AMBER = "#DDCC77"  # behind-schedule indicator (Imprint warning anchor)

# Data: 10-working-day sprint (Jan 6–17 2025), initial scope 40 SP
# Scope addition of +8 on Jan 9 (working day 4) causes remaining to jump
sprint_dates = pd.date_range("2025-01-06", "2025-01-17", freq="D").strftime("%Y-%m-%d").tolist()
remaining = [40, 36, 30, 38, 30, 30, 30, 22, 14, 8, 3, 0]

# Ideal burndown: straight reference from (sprint start, 40) to (sprint end, 0)
ideal_dates = [sprint_dates[0], sprint_dates[-1]]
ideal_values = [40, 0]

# Compute ideal at each sprint date for ahead/behind fill zones
n = len(sprint_dates)
ideal_at_dates = [40 * (1 - i / (n - 1)) for i in range(n)]

# Clip to create non-overlapping fill zones on each side of the ideal line
# ahead_y = actual clipped to ≤ ideal (fills the green zone below ideal)
# behind_y = actual clipped to ≥ ideal (fills the amber zone above ideal)
ahead_y = [min(r, idl) for r, idl in zip(remaining, ideal_at_dates, strict=True)]
behind_y = [max(r, idl) for r, idl in zip(remaining, ideal_at_dates, strict=True)]

AHEAD_FILL = "rgba(0,158,115,0.15)"  # brand green tint — ahead of schedule
BEHIND_FILL = "rgba(221,204,119,0.28)"  # amber tint — behind schedule

# Build closed polygons for toself fill (traces the boundary of each zone)
fill_x = sprint_dates + sprint_dates[::-1]
# Ahead zone: bottom=ahead_y, top=ideal (going forward then back)
ahead_fill_y = ahead_y + ideal_at_dates[::-1]
# Behind zone: bottom=ideal, top=behind_y (going forward then back)
behind_fill_y = behind_y + ideal_at_dates[::-1]

# Title (46 chars — under 67-char baseline, no fontsize scaling needed)
title = "burndown-sprint · python · plotly · anyplot.ai"

# Figure
fig = go.Figure()

# Weekend shading (Jan 11 Sat – Jan 12 Sun)
fig.add_vrect(
    x0="2025-01-11",
    x1="2025-01-13",
    fillcolor=WEEKEND_FILL,
    layer="below",
    line_width=0,
    annotation_text="Weekend",
    annotation_position="top left",
    annotation_font={"size": 9, "color": INK_MUTED},
)

# Ahead-of-schedule fill: closed green polygon between actual and ideal (actual < ideal)
fig.add_trace(
    go.Scatter(
        x=fill_x,
        y=ahead_fill_y,
        fill="toself",
        fillcolor=AHEAD_FILL,
        mode="none",
        showlegend=False,
        hoverinfo="none",
        line={"color": "rgba(0,0,0,0)"},
    )
)

# Behind-schedule fill: closed amber polygon between ideal and actual (actual > ideal)
fig.add_trace(
    go.Scatter(
        x=fill_x,
        y=behind_fill_y,
        fill="toself",
        fillcolor=BEHIND_FILL,
        mode="none",
        showlegend=False,
        hoverinfo="none",
        line={"color": "rgba(0,0,0,0)"},
    )
)

# Ideal burndown reference line (dashed, theme-adaptive muted)
fig.add_trace(
    go.Scatter(
        x=ideal_dates,
        y=ideal_values,
        mode="lines",
        name="Ideal burndown",
        line={"color": INK_SOFT, "width": 2, "dash": "dash"},
    )
)

# Actual remaining work (step series — horizontal-then-vertical)
fig.add_trace(
    go.Scatter(
        x=sprint_dates,
        y=remaining,
        mode="lines+markers",
        name="Remaining story points",
        line={"color": BRAND, "width": 3.5, "shape": "hv"},
        marker={"color": BRAND, "size": 8, "symbol": "circle"},
    )
)

# Scope change event on Jan 9 (working day 4, +8 SP added)
fig.add_vline(
    x="2025-01-09",
    line_width=1.5,
    line_dash="dot",
    line_color=SCOPE_COLOR,
    annotation_text="Scope +8 SP",
    annotation_position="top right",
    annotation_font={"size": 10, "color": SCOPE_COLOR},
    annotation_bgcolor=ELEVATED_BG,
    annotation_bordercolor=SCOPE_COLOR,
    annotation_borderwidth=1,
)

# Layout
fig.update_layout(
    autosize=False,
    margin={"l": 80, "r": 40, "t": 80, "b": 60},
    paper_bgcolor=PAGE_BG,
    plot_bgcolor=PAGE_BG,
    title={"text": title, "font": {"size": 16, "color": INK}, "x": 0, "xanchor": "left", "xref": "paper"},
    xaxis={
        "title": {"text": "Sprint Day", "font": {"size": 12, "color": INK}},
        "tickfont": {"size": 10, "color": INK_SOFT},
        "gridcolor": GRID,
        "linecolor": INK_SOFT,
        "zerolinecolor": INK_SOFT,
        "tickformat": "%b %d",
        "showgrid": False,
        "showline": True,
        "mirror": False,
    },
    yaxis={
        "title": {"text": "Remaining Story Points", "font": {"size": 12, "color": INK}},
        "tickfont": {"size": 10, "color": INK_SOFT},
        "gridcolor": GRID,
        "linecolor": INK_SOFT,
        "zerolinecolor": GRID,
        "rangemode": "tozero",
        "showgrid": True,
        "showline": True,
        "mirror": False,
    },
    legend={
        "bgcolor": ELEVATED_BG,
        "borderwidth": 0,
        "font": {"color": INK_SOFT, "size": 10},
        "x": 0.97,
        "y": 0.97,
        "xanchor": "right",
        "yanchor": "top",
    },
    font={"color": INK},
)

# Save
fig.write_image(f"plot-{THEME}.png", width=800, height=450, scale=4)
fig.write_html(f"plot-{THEME}.html", include_plotlyjs="cdn")
Runnable source as JSON, for any HTTP client: https://api.anyplot.ai/specs/burndown-sprint/plotly/code. Any spec id and library id listed in llms-full.txt fit the same URL shape; every URL below is complete and callable.
{
  "spec_id": "burndown-sprint",
  "language": "python",
  "library": "plotly",
  "page": "https://anyplot.ai/burndown-sprint/python/plotly",
  "hub": "https://anyplot.ai/burndown-sprint",
  "code_json": "https://api.anyplot.ai/specs/burndown-sprint/plotly/code",
  "spec_json": "https://api.anyplot.ai/specs/burndown-sprint",
  "render_light_png": "https://storage.googleapis.com/anyplot-images/plots/burndown-sprint/python/plotly/plot-light.png",
  "render_dark_png": "https://storage.googleapis.com/anyplot-images/plots/burndown-sprint/python/plotly/plot-dark.png",
  "interactive_light_html": "https://storage.googleapis.com/anyplot-images/plots/burndown-sprint/python/plotly/plot-light.html",
  "interactive_dark_html": "https://storage.googleapis.com/anyplot-images/plots/burndown-sprint/python/plotly/plot-dark.html",
  "quality_score": 88.0,
  "license": "MIT",
  "guide": "https://anyplot.ai/llms.txt"
}
Part of Agile Sprint Burndown Chart on anyplot.ai.