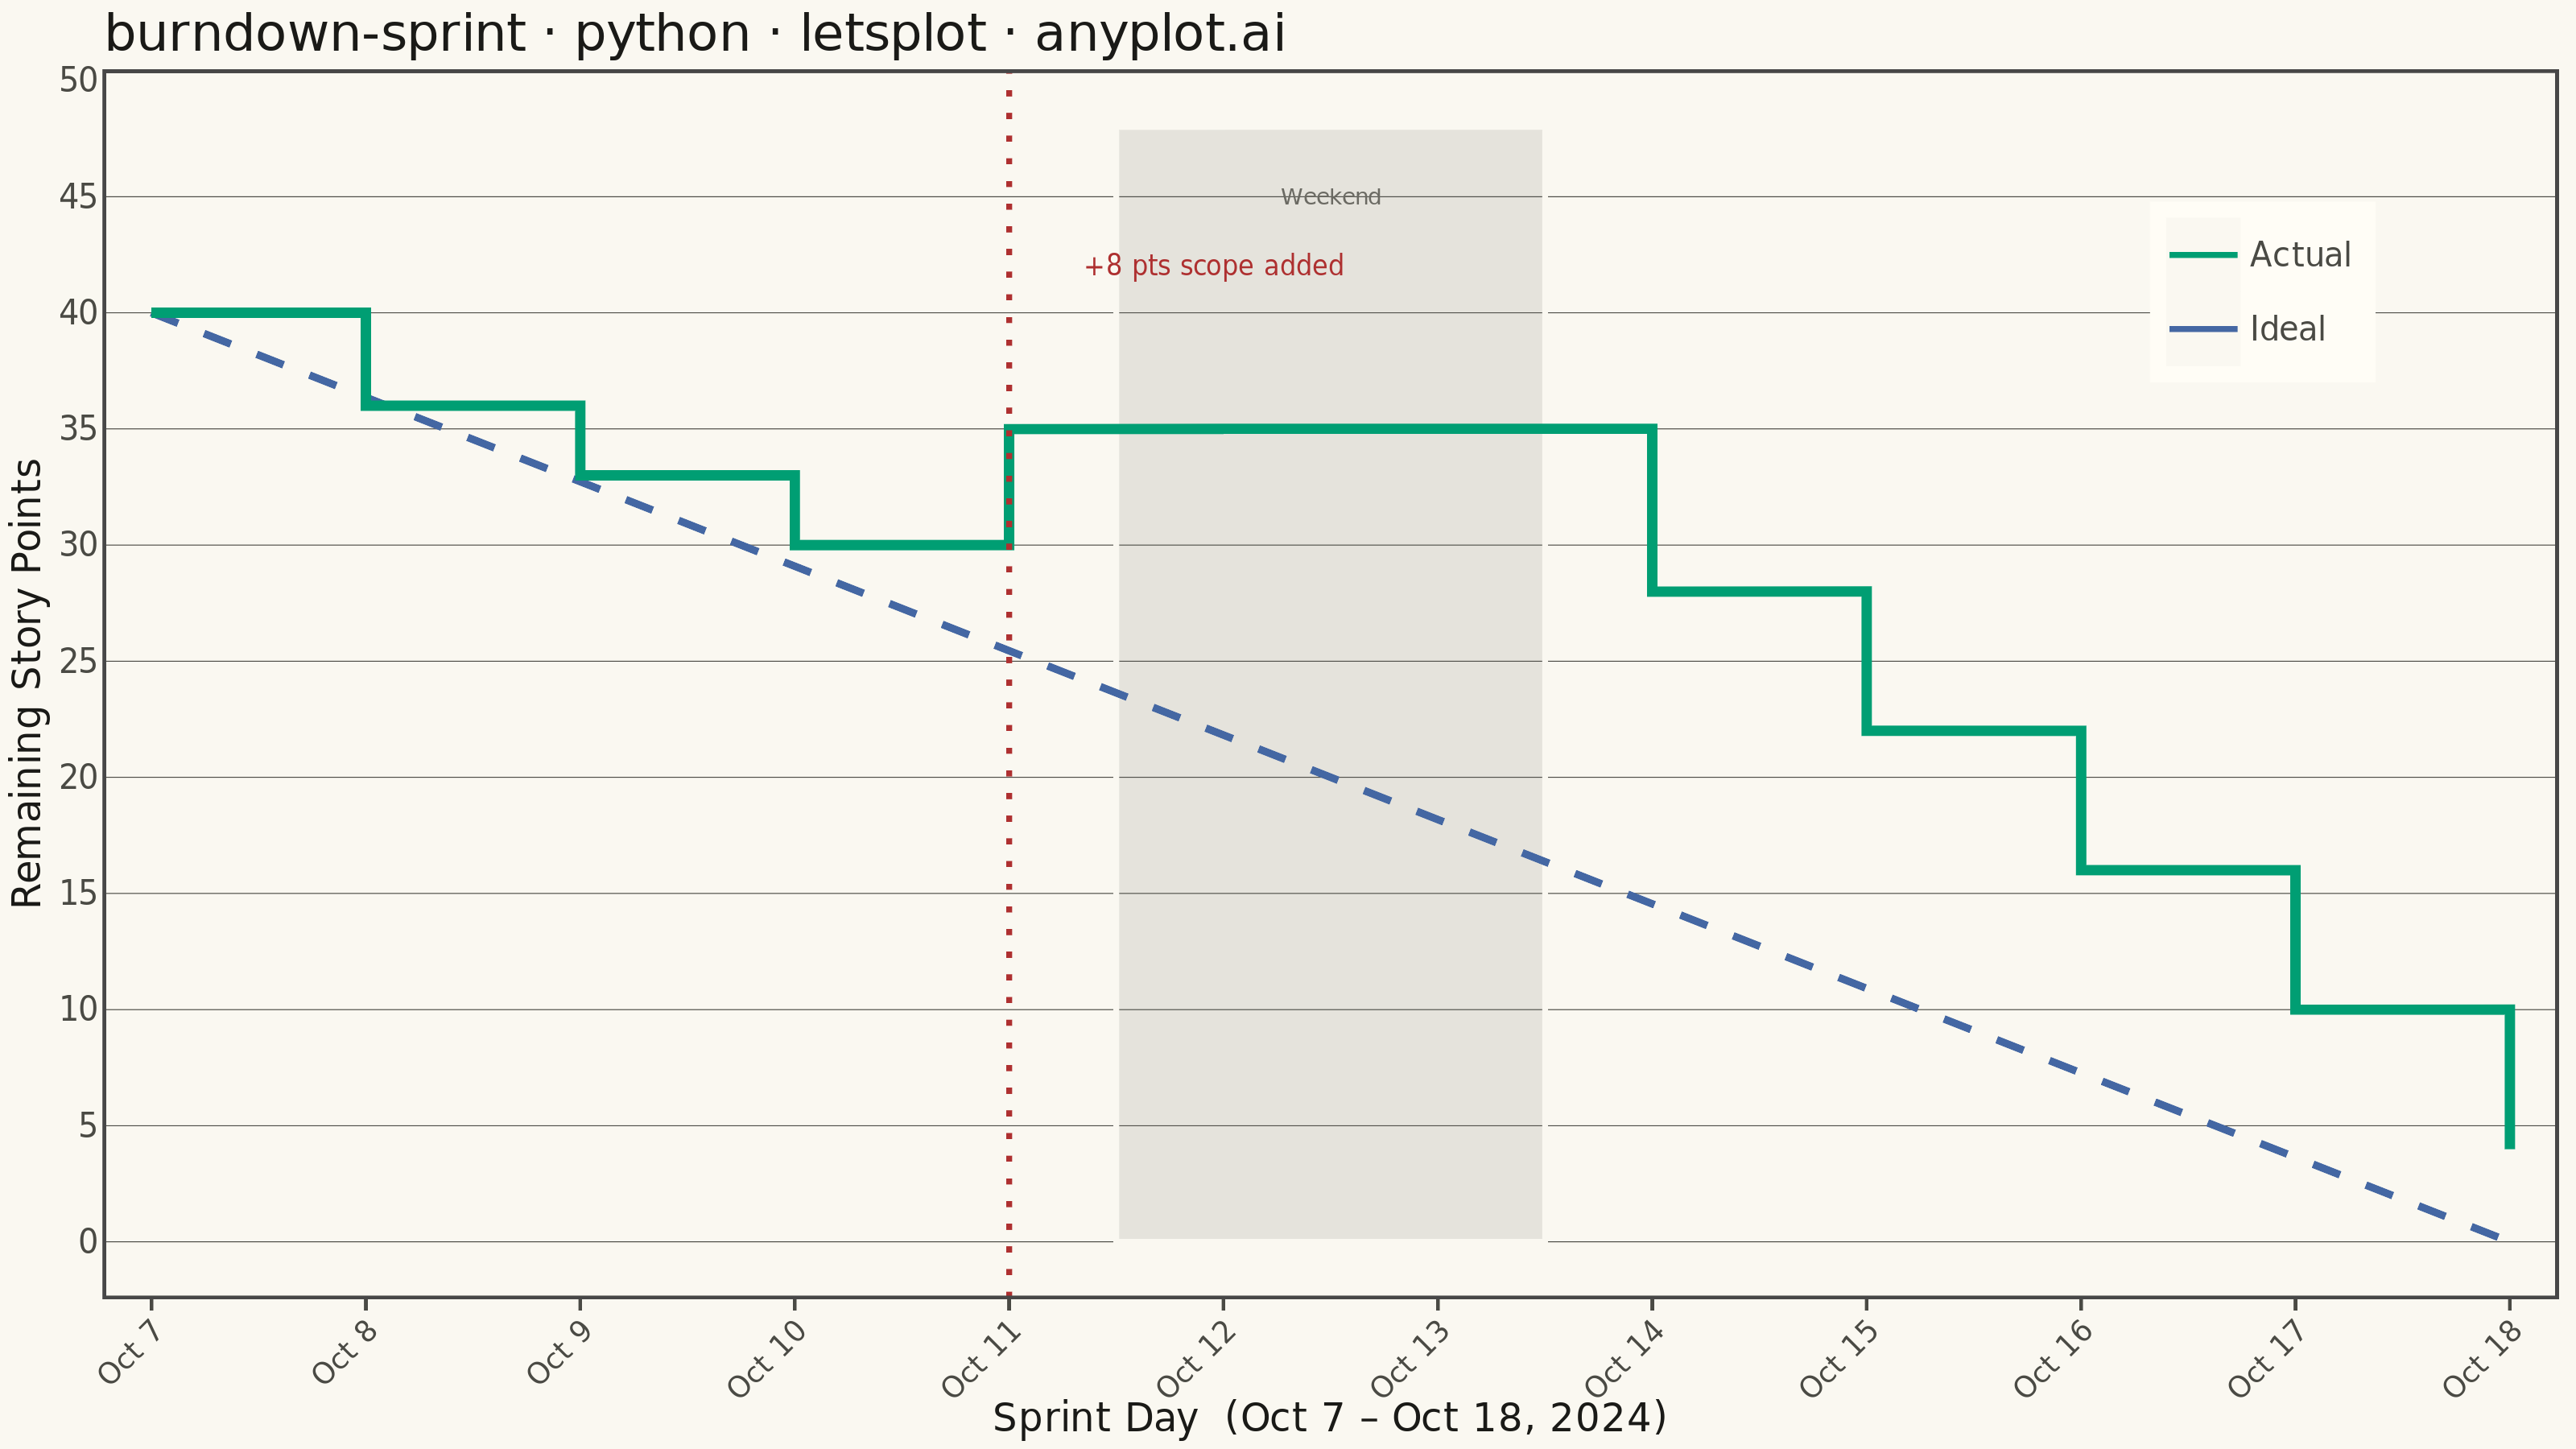
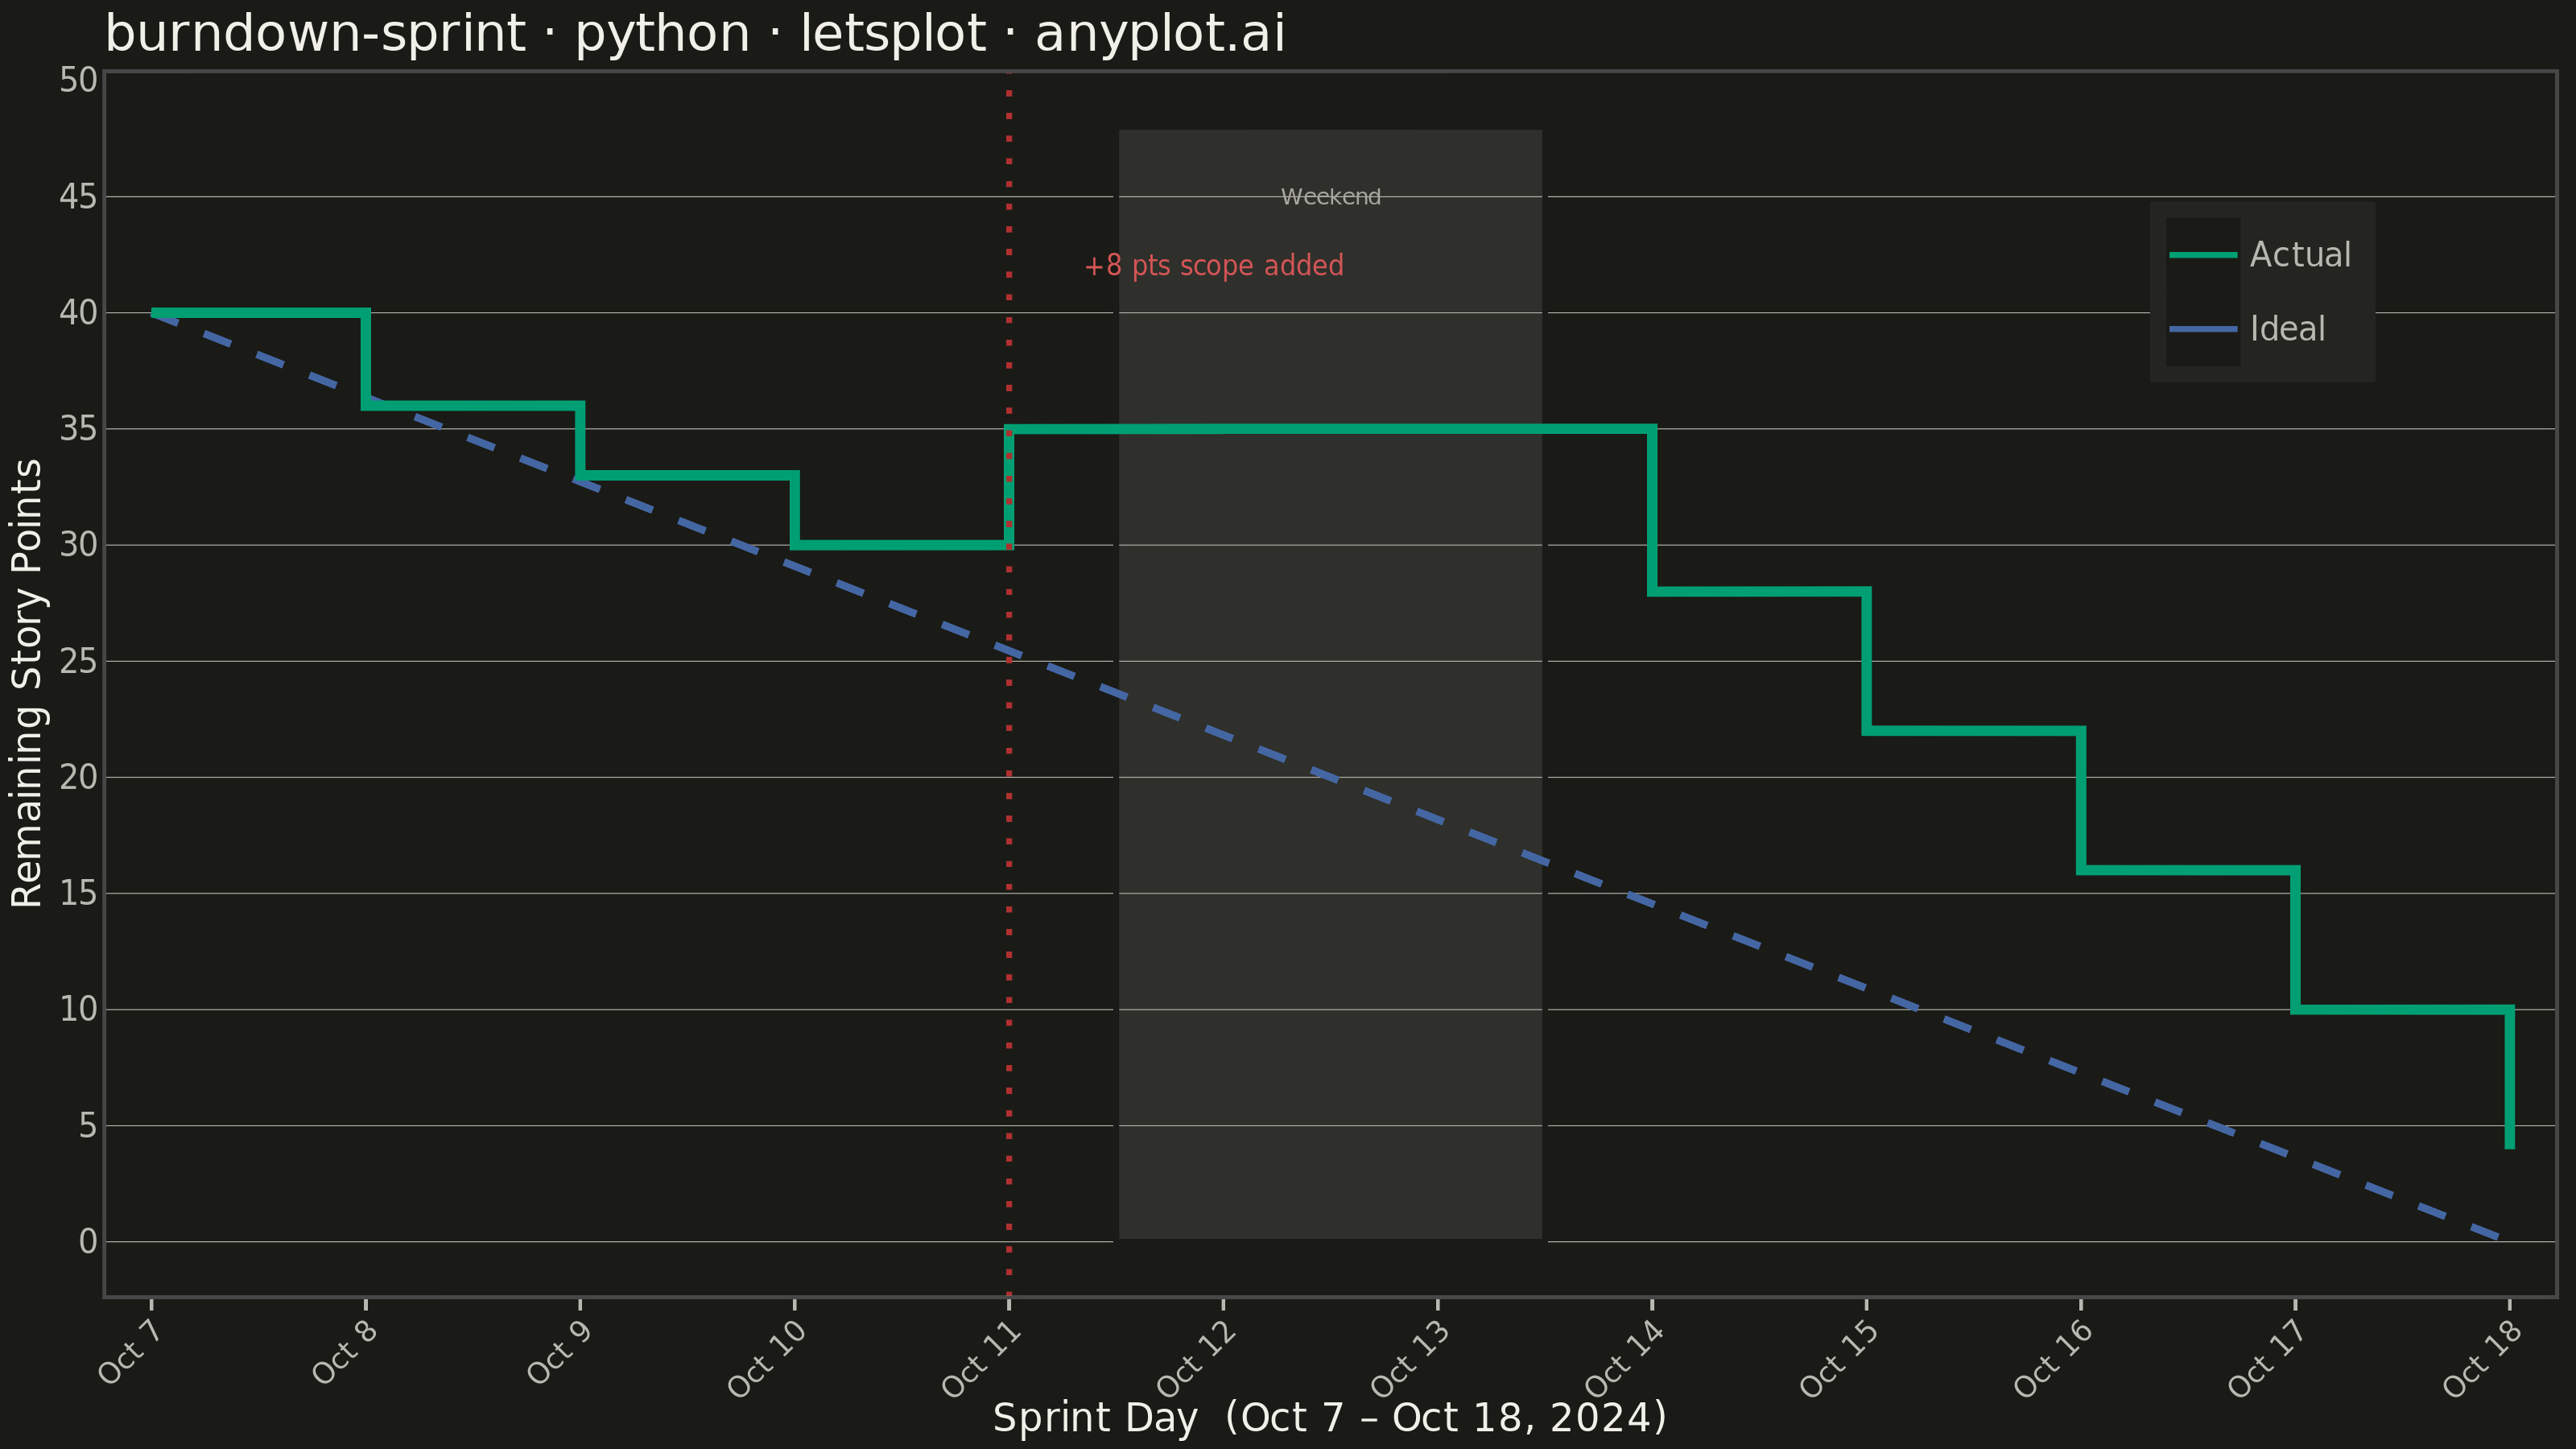
A sprint burndown chart tracks the amount of remaining work in an agile sprint over time, plotted as a step (or line) series that descends as tasks are completed. A straight ideal-burndown guideline runs diagonally from the total committed scope on day one down to zero on the final day, giving the team an at-a-glance reference for whether they are ahead of or behind schedule. It is one of the most widely used project-management visualizations in software development, surfacing scope creep, stalled progress, and end-of-sprint risk early enough to act on.
""" anyplot.ai
burndown-sprint: Agile Sprint Burndown Chart
Library: letsplot 4.10.1 | Python 3.13.13
Quality: 88/100 | Created: 2026-06-14
"""

import os

import pandas as pd
from lets_plot import *


LetsPlot.setup_html()

# Theme tokens
THEME = os.getenv("ANYPLOT_THEME", "light")
PAGE_BG = "#FAF8F1" if THEME == "light" else "#1A1A17"
ELEVATED_BG = "#FFFDF6" if THEME == "light" else "#242420"
INK = "#1A1A17" if THEME == "light" else "#F0EFE8"
INK_SOFT = "#4A4A44" if THEME == "light" else "#B8B7B0"
INK_MUTED = "#6B6A63" if THEME == "light" else "#A8A79F"

# Imprint palette — position 1 always first series
IMPRINT_PALETTE = ["#009E73", "#C475FD", "#4467A3", "#BD8233", "#AE3030", "#2ABCCD", "#954477", "#99B314"]
BRAND = IMPRINT_PALETTE[0]  # actual burndown — brand green, always first series
IDEAL_COLOR = IMPRINT_PALETTE[2]  # ideal guideline — Imprint blue
SCOPE_COLOR = IMPRINT_PALETTE[4]  # scope-change marker — matte red (semantic: risk/alert)
# Slightly lighter red for annotation on dark backgrounds to improve contrast
SCOPE_ANNOTATION_COLOR = "#AE3030" if THEME == "light" else "#D45555"

# Data — 10-working-day sprint, Oct 7–18 2024
# Initial scope: 40 story points; +8 scope added on day 4 (Oct 11, Fri)
day_indices = list(range(12))
day_labels = [
    "Oct 7",
    "Oct 8",
    "Oct 9",
    "Oct 10",
    "Oct 11",
    "Oct 12",
    "Oct 13",
    "Oct 14",
    "Oct 15",
    "Oct 16",
    "Oct 17",
    "Oct 18",
]

# Actual remaining story points — step series (flat on non-working days)
# Day 4 (Oct 11): 30 SP remaining, 8 added, 3 burned → 35
remaining = [40, 36, 33, 30, 35, 35, 35, 28, 22, 16, 10, 4]

# Ideal burndown: linear from 40 → 0 across all 12 calendar days
ideal = [round(40 - 40 * i / 11, 2) for i in range(12)]

df_actual = pd.DataFrame({"day": day_indices, "value": remaining, "series": "Actual"})
df_ideal = pd.DataFrame({"day": day_indices, "value": ideal, "series": "Ideal"})

# Weekend band (Oct 12–13 = day indices 5–6)
df_weekend = pd.DataFrame({"xmin": [4.5], "xmax": [6.5], "ymin": [0.0], "ymax": [48.0]})

# Scope change annotation (placed just right of the vertical marker)
df_scope_label = pd.DataFrame({"x": [4.35], "y": [42.0], "label": ["+8 pts scope added"]})

# Weekend band label (top of the shaded band)
df_wknd_label = pd.DataFrame({"x": [5.5], "y": [45.0], "label": ["Weekend"]})

# Theme
anyplot_theme = theme(
    plot_background=element_rect(fill=PAGE_BG, color=PAGE_BG),
    panel_background=element_rect(fill=PAGE_BG),
    panel_grid_major_y=element_line(color=INK_SOFT, size=0.25),
    panel_grid_major_x=element_blank(),
    panel_grid_minor=element_blank(),
    panel_border=element_blank(),
    axis_title=element_text(color=INK, size=12),
    axis_text=element_text(color=INK_SOFT, size=10),
    axis_text_x=element_text(color=INK_SOFT, size=9, angle=45, vjust=1, hjust=1),
    axis_ticks=element_line(color=INK_SOFT),
    axis_line=element_line(color=INK_SOFT),
    plot_title=element_text(color=INK, size=16),
    legend_background=element_rect(fill=ELEVATED_BG, color=INK_SOFT),
    legend_text=element_text(color=INK_SOFT, size=10),
    legend_title=element_blank(),
    legend_position=[0.88, 0.82],
)

title = "burndown-sprint · python · letsplot · anyplot.ai"

plot = (
    ggplot()
    # Weekend background shading (border matches bg so only the fill shows)
    + geom_rect(
        mapping=aes(xmin="xmin", xmax="xmax", ymin="ymin", ymax="ymax"),
        data=df_weekend,
        fill=INK_MUTED,
        alpha=0.15,
        color=PAGE_BG,
    )
    # Weekend label inside the band
    + geom_text(mapping=aes(x="x", y="y", label="label"), data=df_wknd_label, color=INK_MUTED, size=3.5)
    # Ideal burndown guideline (dashed, Imprint blue)
    + geom_line(mapping=aes(x="day", y="value", color="series"), data=df_ideal, size=1.0, linetype="dashed")
    # Actual burndown as a step series (brand green — first series)
    + geom_step(mapping=aes(x="day", y="value", color="series"), data=df_actual, size=1.4)
    # Scope change vertical marker (matte red — semantic alert)
    + geom_vline(xintercept=4, color=SCOPE_COLOR, size=0.8, linetype="dotted")
    # Scope change annotation
    + geom_text(
        mapping=aes(x="x", y="y", label="label"), data=df_scope_label, color=SCOPE_ANNOTATION_COLOR, size=4.0, hjust=0
    )
    # Color scale / legend for the two series
    + scale_color_manual(values={"Actual": BRAND, "Ideal": IDEAL_COLOR}, name="")
    + scale_x_continuous(breaks=day_indices, labels=day_labels, expand=[0.02, 0])
    + scale_y_continuous(limits=[0, 48])
    + labs(x="Sprint Day  (Oct 7 – Oct 18, 2024)", y="Remaining Story Points", title=title)
    + ggsize(800, 450)
    + anyplot_theme
)

# Save PNG + HTML (both themes handled by ANYPLOT_THEME env var)
ggsave(plot, f"plot-{THEME}.png", path=".", scale=4)
ggsave(plot, f"plot-{THEME}.html", path=".")
Runnable source as JSON, for any HTTP client: https://api.anyplot.ai/specs/burndown-sprint/letsplot/code. Any spec id and library id listed in llms-full.txt fit the same URL shape; every URL below is complete and callable.
{
  "spec_id": "burndown-sprint",
  "language": "python",
  "library": "letsplot",
  "page": "https://anyplot.ai/burndown-sprint/python/letsplot",
  "hub": "https://anyplot.ai/burndown-sprint",
  "code_json": "https://api.anyplot.ai/specs/burndown-sprint/letsplot/code",
  "spec_json": "https://api.anyplot.ai/specs/burndown-sprint",
  "render_light_png": "https://storage.googleapis.com/anyplot-images/plots/burndown-sprint/python/letsplot/plot-light.png",
  "render_dark_png": "https://storage.googleapis.com/anyplot-images/plots/burndown-sprint/python/letsplot/plot-dark.png",
  "interactive_light_html": "https://storage.googleapis.com/anyplot-images/plots/burndown-sprint/python/letsplot/plot-light.html",
  "interactive_dark_html": "https://storage.googleapis.com/anyplot-images/plots/burndown-sprint/python/letsplot/plot-dark.html",
  "quality_score": 88.0,
  "license": "MIT",
  "guide": "https://anyplot.ai/llms.txt"
}
Part of Agile Sprint Burndown Chart on anyplot.ai.