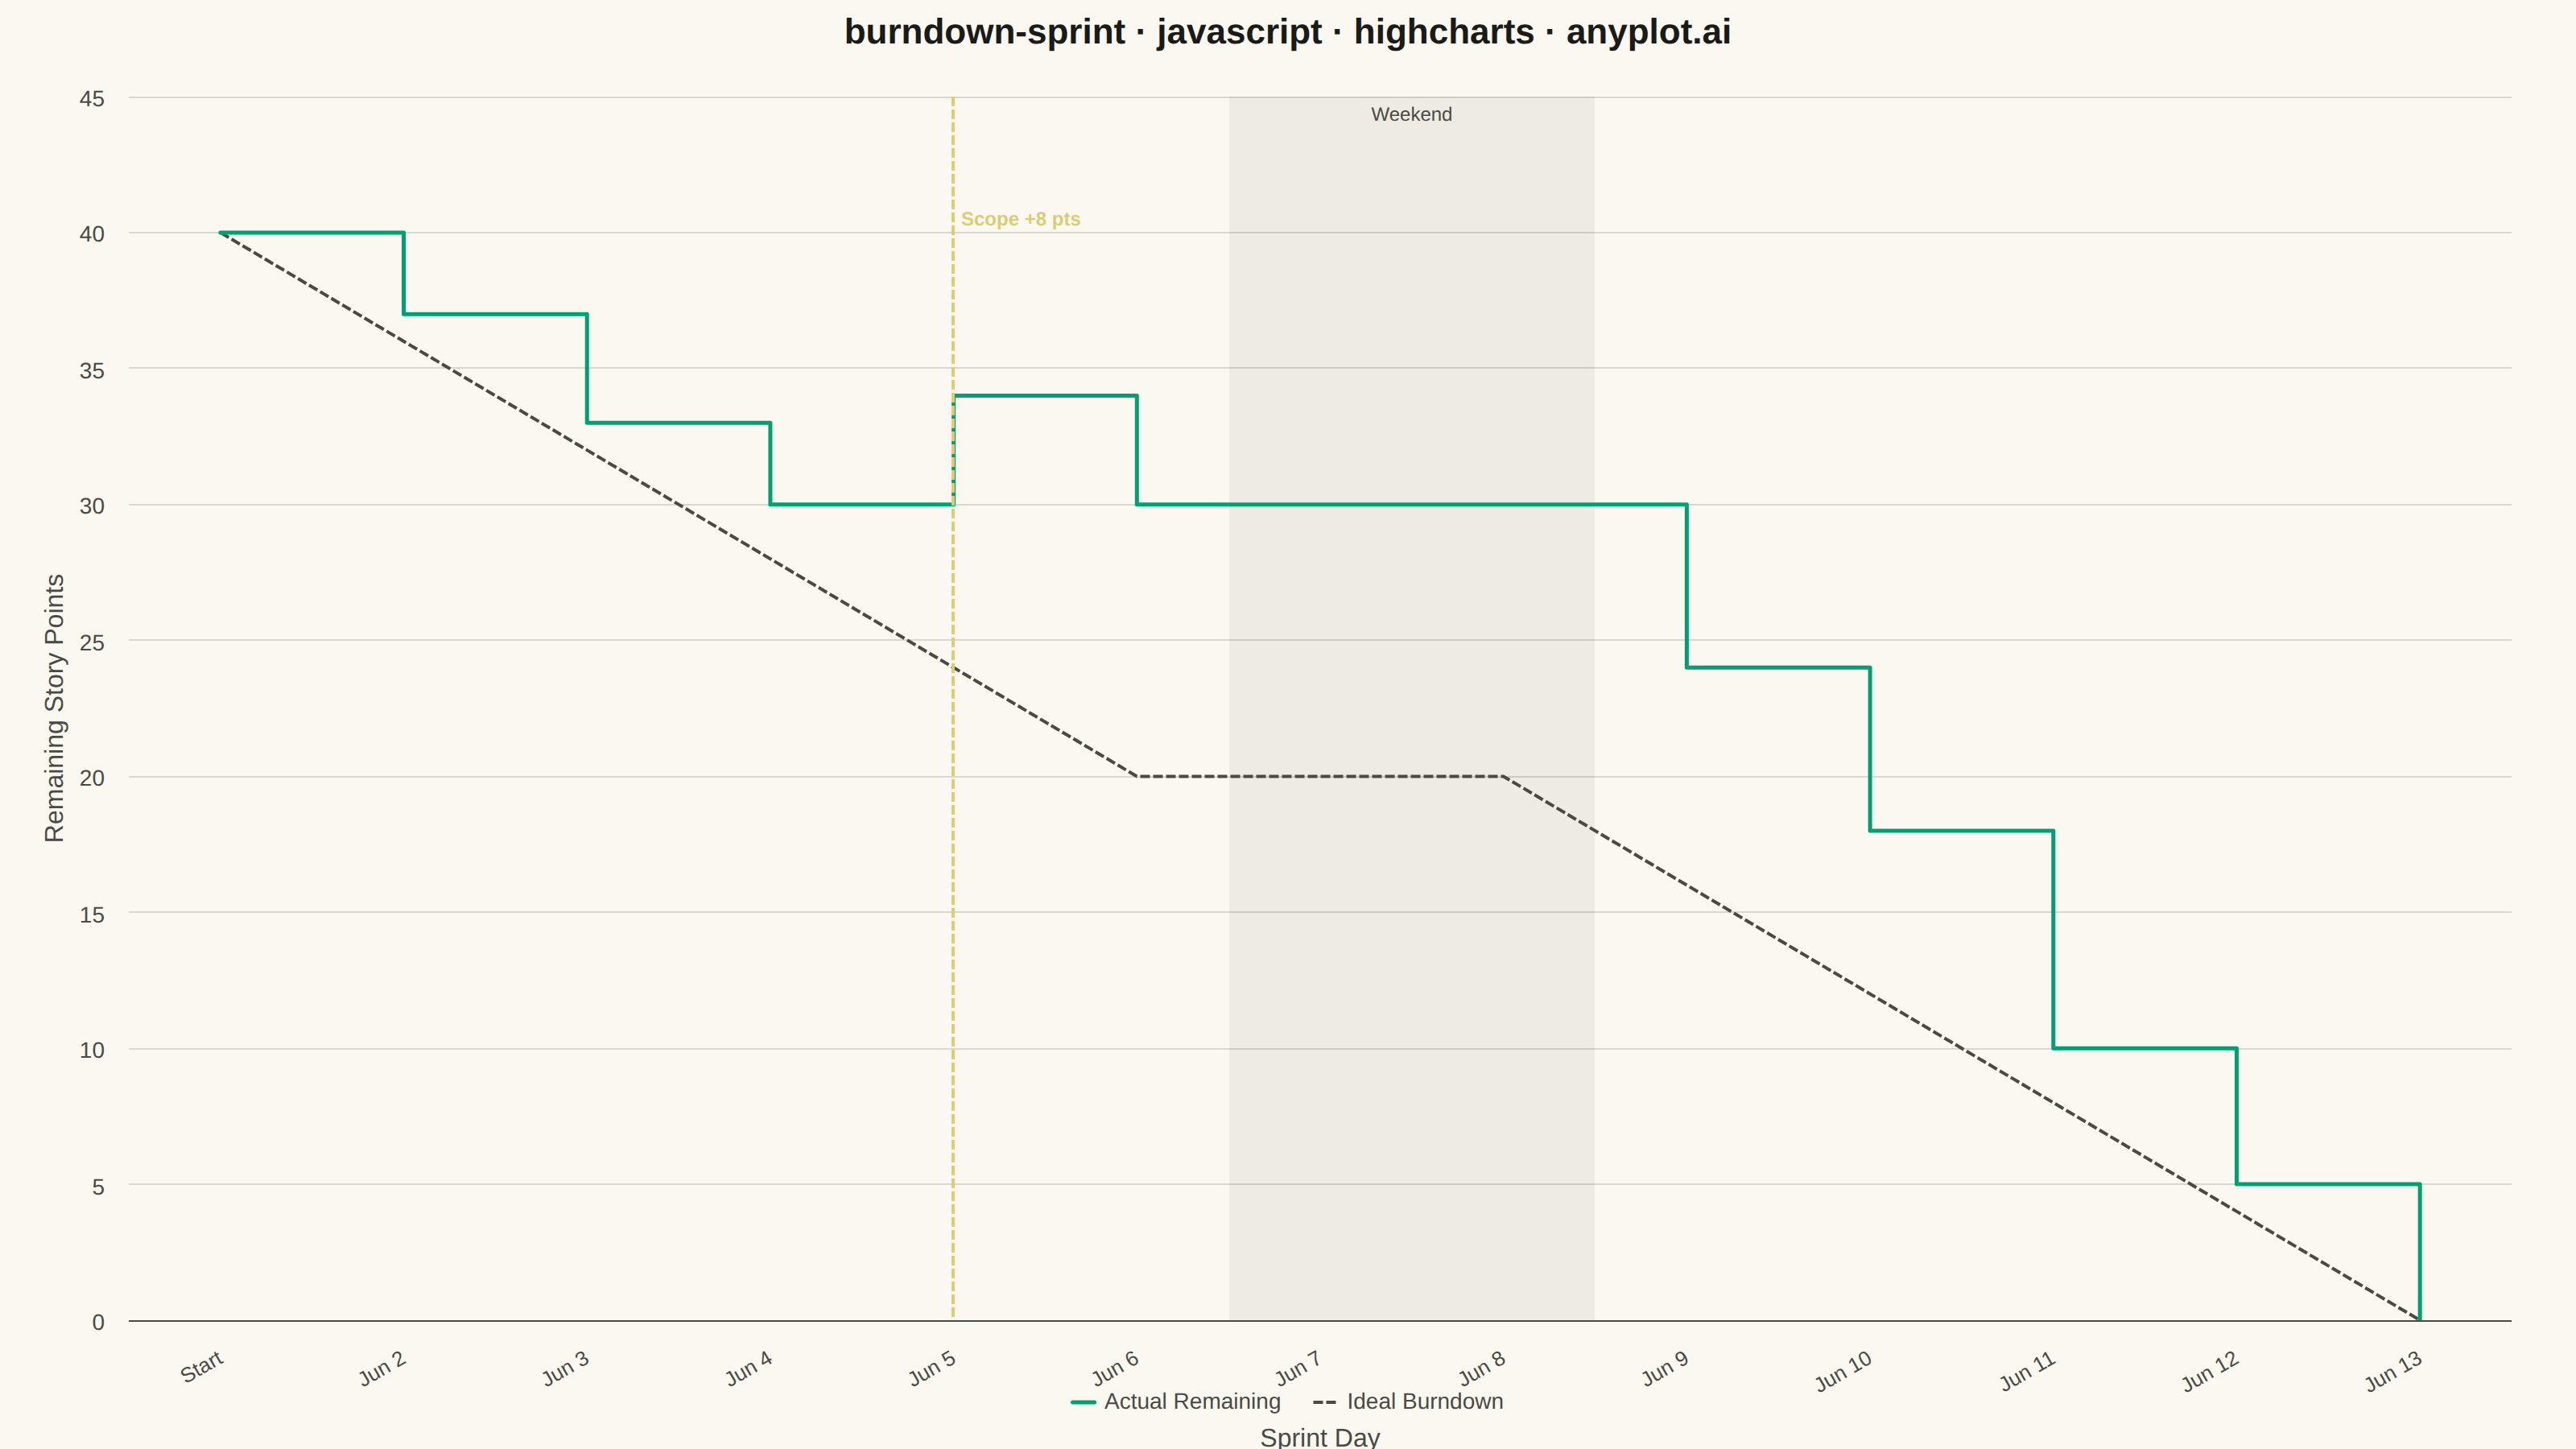
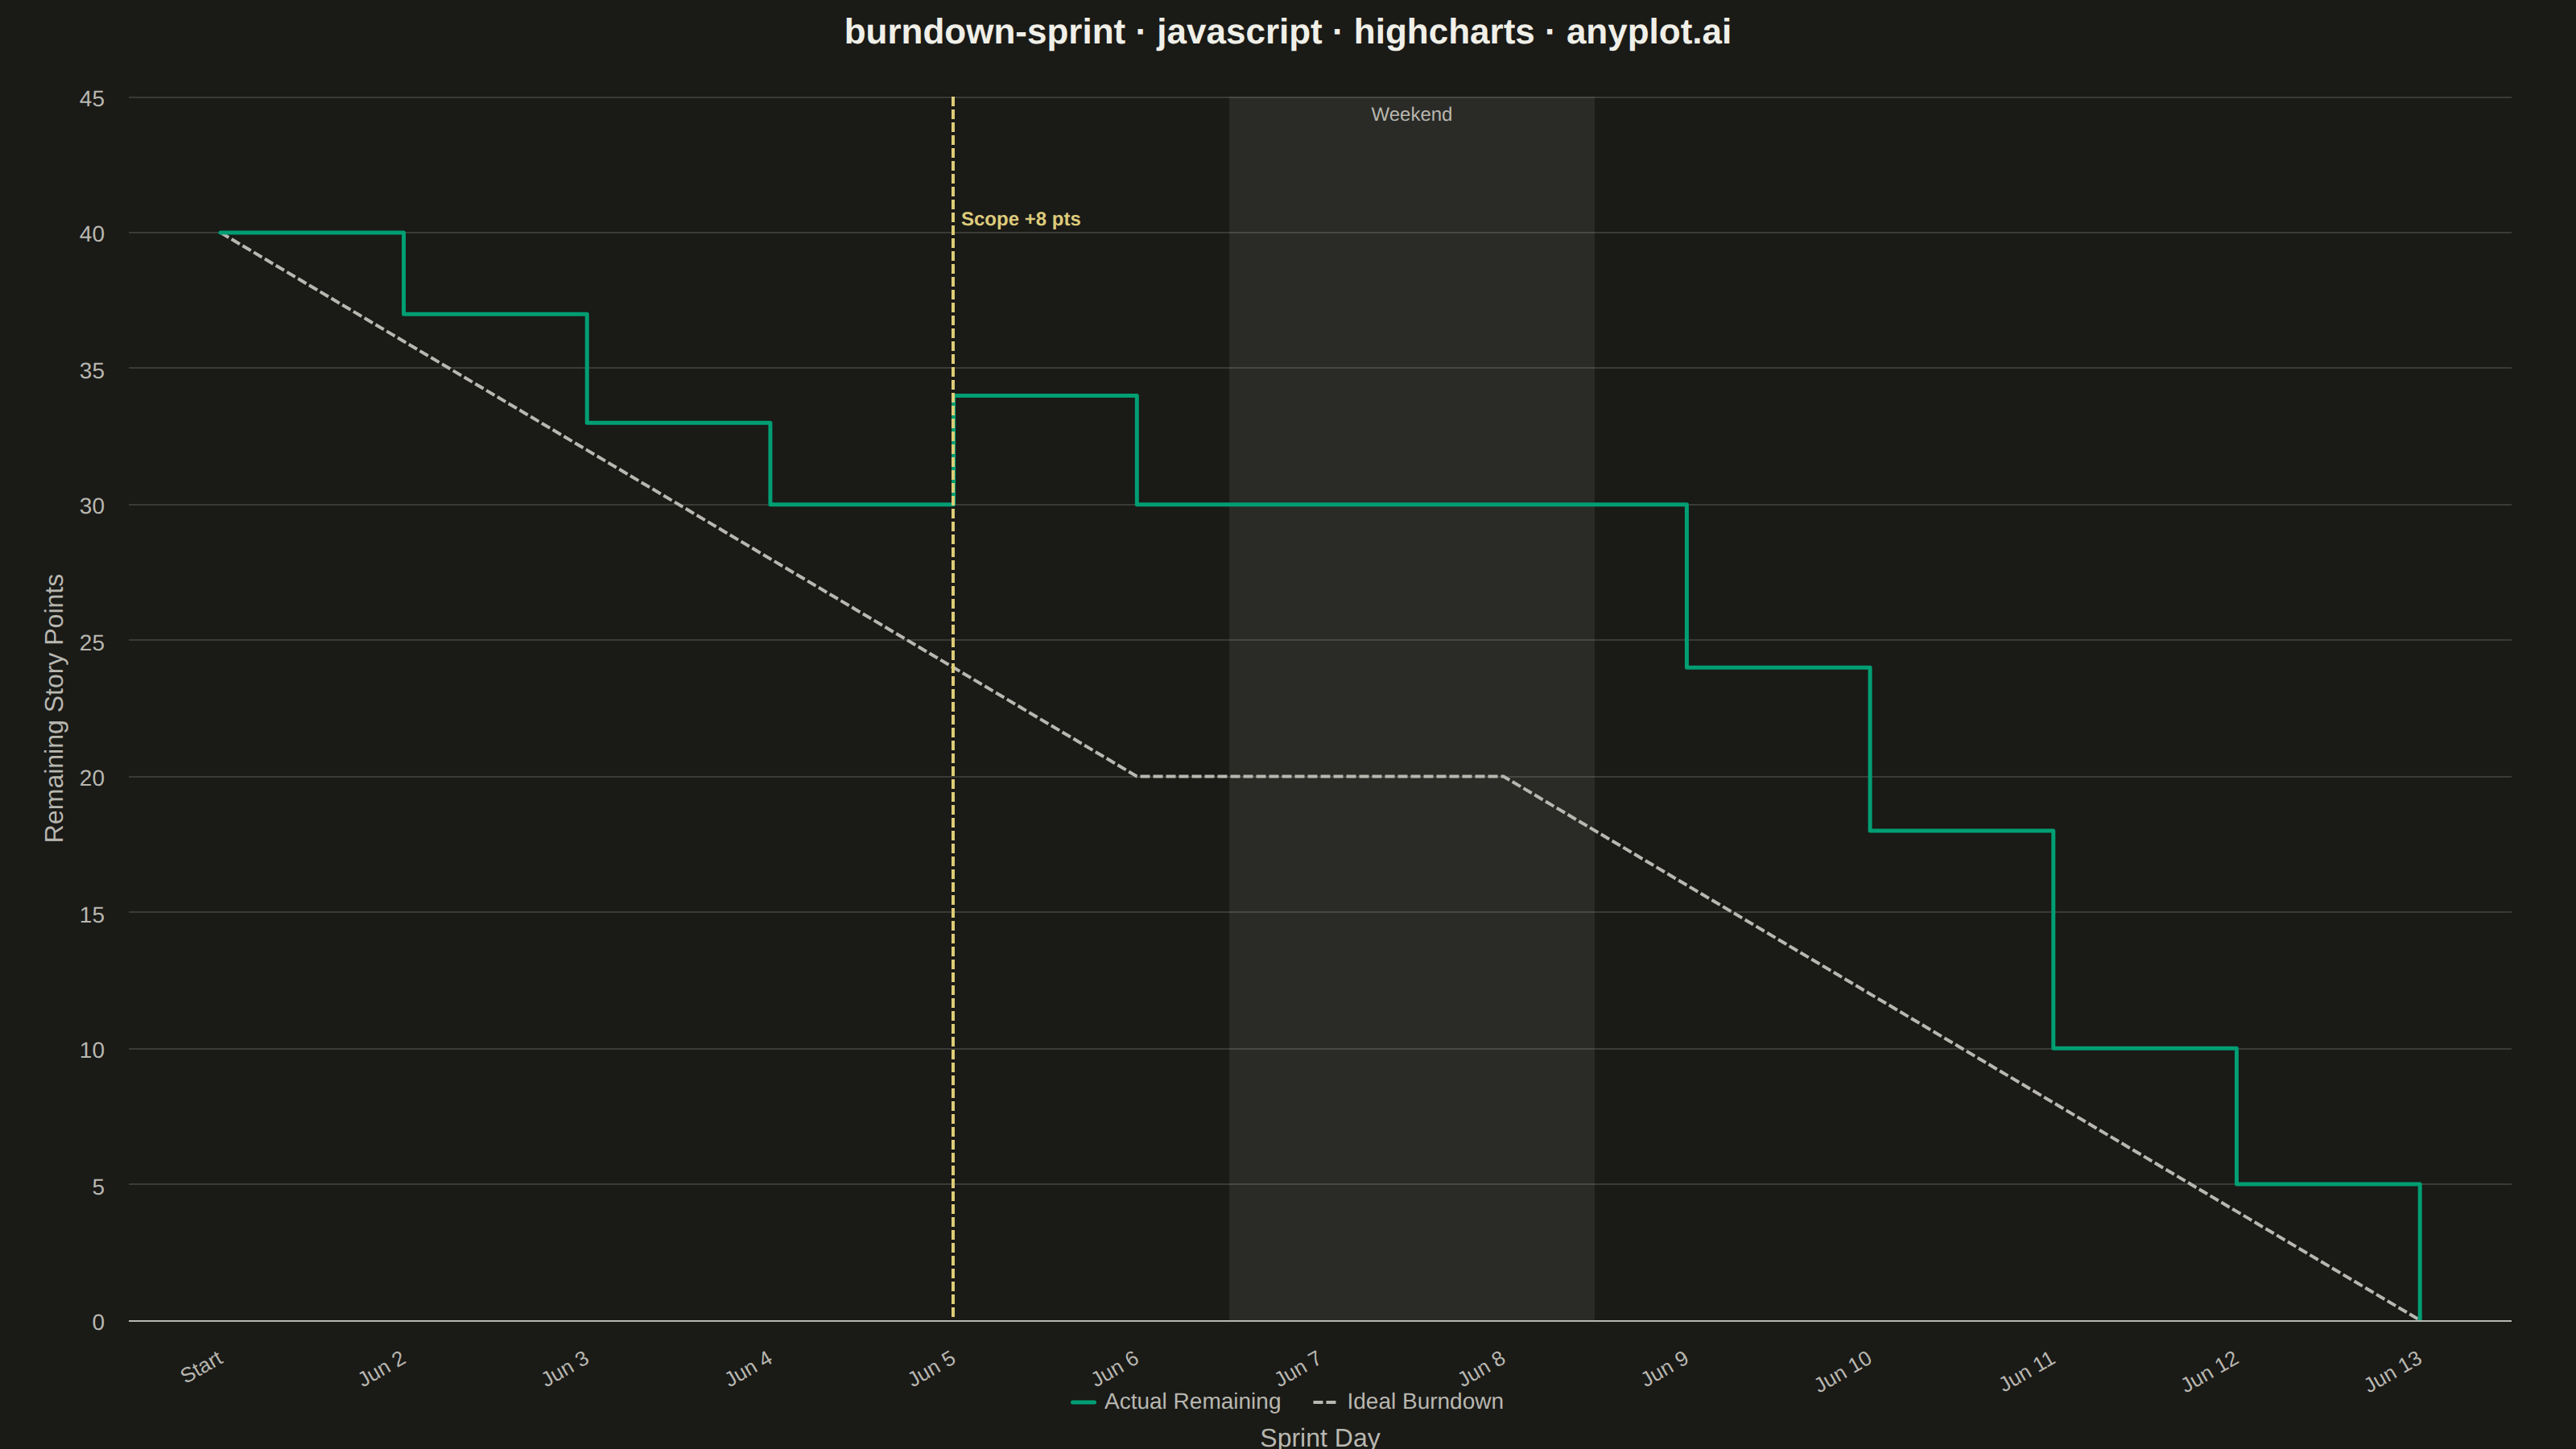
A sprint burndown chart tracks the amount of remaining work in an agile sprint over time, plotted as a step (or line) series that descends as tasks are completed. A straight ideal-burndown guideline runs diagonally from the total committed scope on day one down to zero on the final day, giving the team an at-a-glance reference for whether they are ahead of or behind schedule. It is one of the most widely used project-management visualizations in software development, surfacing scope creep, stalled progress, and end-of-sprint risk early enough to act on.
// anyplot.ai
// burndown-sprint: Agile Sprint Burndown Chart
// Library: highcharts 12.6.0 | JavaScript 22.22.3
// Quality: 91/100 | Created: 2026-06-14
//# anyplot-orientation: landscape

const THEME = window.ANYPLOT_THEME || "light";
const t = window.ANYPLOT_TOKENS;

// Sprint data: 10 working days (Jun 2–13 2025), initial scope 40 story points
const categories = [
  "Start",  "Jun 2", "Jun 3", "Jun 4",  "Jun 5",
  "Jun 6",  "Jun 7", "Jun 8", "Jun 9",  "Jun 10",
  "Jun 11", "Jun 12", "Jun 13"
];

// Actual remaining story points (step series);
// +8 scope added end of Jun 5 (Thu, day 4) — team finishes at zero by sprint end
const actualRemaining = [40, 37, 33, 30, 34, 30, 30, 30, 24, 18, 10, 5, 0];

// Ideal burndown: 40 → 0 linearly over 10 working days (flat on weekends)
const idealRemaining  = [40, 36, 32, 28, 24, 20, 20, 20, 16, 12,  8, 4, 0];

// Weekend band: subtly distinct from the page background
const weekendColor = THEME === "light"
  ? "rgba(26,26,23,0.06)"
  : "rgba(240,239,232,0.08)";

Highcharts.chart("container", {
  chart: {
    backgroundColor: "transparent",
    animation: false,
    style: { fontFamily: "inherit" },
    marginTop: 60,
    marginRight: 40,
    marginBottom: 80,
    marginLeft: 80,
  },
  credits: { enabled: false },
  colors: t.palette,
  title: {
    text: "burndown-sprint · javascript · highcharts · anyplot.ai",
    style: { color: t.ink, fontSize: "22px", fontWeight: "600" },
    margin: 20,
  },
  xAxis: {
    categories,
    lineColor: t.inkSoft,
    tickColor: t.inkSoft,
    labels: { style: { color: t.inkSoft, fontSize: "13px" }, rotation: -30 },
    title: {
      text: "Sprint Day",
      style: { color: t.inkSoft, fontSize: "16px" },
      margin: 15,
    },
    plotBands: [
      {
        from: 5.5,
        to: 7.5,
        color: weekendColor,
        label: {
          text: "Weekend",
          style: { color: t.inkSoft, fontSize: "12px" },
          align: "center",
          verticalAlign: "top",
          y: 15,
        },
      },
    ],
    plotLines: [
      {
        value: 4,
        color: "#DDCC77",
        dashStyle: "ShortDash",
        width: 2,
        zIndex: 5,
        label: {
          text: "Scope +8 pts",
          style: { color: "#DDCC77", fontSize: "12px", fontWeight: "600" },
          align: "left",
          rotation: 0,
          x: 5,
          y: 80,
        },
      },
    ],
  },
  yAxis: {
    title: {
      text: "Remaining Story Points",
      style: { color: t.inkSoft, fontSize: "16px" },
    },
    min: 0,
    gridLineColor: t.grid,
    lineColor: t.inkSoft,
    tickColor: t.inkSoft,
    labels: { style: { color: t.inkSoft, fontSize: "14px" } },
  },
  legend: {
    enabled: true,
    itemStyle: { color: t.inkSoft, fontSize: "14px" },
    itemHoverStyle: { color: t.ink },
    backgroundColor: "transparent",
    borderWidth: 0,
  },
  plotOptions: {
    series: {
      animation: false,
      marker: { enabled: false },
    },
  },
  series: [
    {
      name: "Actual Remaining",
      data: actualRemaining,
      type: "line",
      step: "left",
      color: t.palette[0],
      lineWidth: 2.5,
      zIndex: 2,
    },
    {
      name: "Ideal Burndown",
      data: idealRemaining,
      type: "line",
      color: t.inkSoft,
      dashStyle: "ShortDash",
      lineWidth: 2,
      zIndex: 1,
    },
  ],
});
Runnable source as JSON, for any HTTP client: https://api.anyplot.ai/specs/burndown-sprint/highcharts/code. Any spec id and library id listed in llms-full.txt fit the same URL shape; every URL below is complete and callable.
{
  "spec_id": "burndown-sprint",
  "language": "javascript",
  "library": "highcharts",
  "page": "https://anyplot.ai/burndown-sprint/javascript/highcharts",
  "hub": "https://anyplot.ai/burndown-sprint",
  "code_json": "https://api.anyplot.ai/specs/burndown-sprint/highcharts/code",
  "spec_json": "https://api.anyplot.ai/specs/burndown-sprint",
  "render_light_png": "https://storage.googleapis.com/anyplot-images/plots/burndown-sprint/javascript/highcharts/plot-light.png",
  "render_dark_png": "https://storage.googleapis.com/anyplot-images/plots/burndown-sprint/javascript/highcharts/plot-dark.png",
  "interactive_light_html": "https://storage.googleapis.com/anyplot-images/plots/burndown-sprint/javascript/highcharts/plot-light.html",
  "interactive_dark_html": "https://storage.googleapis.com/anyplot-images/plots/burndown-sprint/javascript/highcharts/plot-dark.html",
  "quality_score": 91.0,
  "license": "MIT",
  "guide": "https://anyplot.ai/llms.txt"
}
Part of Agile Sprint Burndown Chart on anyplot.ai.